Study of Defects after the Second Handover of the
Construction of Highrise Buildings
in PT ABC as a Quality Improvement Strategy
Sutoyo1, Jason Lim 2 , Onnyxiforus Gondokusumo3
Master Student of Civil Engineering, Tarumanagara University, Jakarta, Indonesia1
Master Lecture of Civil Engineering, Tarumanagara University, Jakarta, Indonesia 2
Doctor Lecture of Civil Engineering, Tarumanagara University, Jakarta, Indonesia 3
ABSTRACT: Completion of all contractor's responsibilities to the owner until the maintenance period is completed, marked by the Final Hand Over (FHO). After this FHO process, the contractor is legally irresponsible if the building he is working on has defects. Some contractors, one of which is PT ABC, provides a difference in service for customer satisfaction in the form of improved defects after FHO. This policy has the aim that the owner and contractor relationship is still well established, a form of contractor's responsibility and of course indirect expectations, so that the Owner will be a Repeat Customer. As a result of this policy certainly has an impact on expenditure. From data defects 10 years (2008-2017) obtained dominant defects and the cost of repairs. With the RCA analysis method (Root Cause Analysis) and expert judgment validation, the causes of defects and proposed improvements / improvement are obtained. The proposal to reduce the defects is given so that in the future, the number of defects after FHO becomes less, the cost of repairs becomes cheaper and most importantly the image / brand of the company is maintained.
KEYWORDS: Defects, Owner, Final Hand Over/FHO, expert judgement.
I. INTRODUCTION
The responsibility of the construction service provider does not stop after the FHO, but is still burdened with responsibilities within a certain time according to the contract clause. This responsibility is called guarantee of construction.
In the Law of the Republic of Indonesia Number 2 of 2017 in Chapter VI Article 65 paragraph (2) is stated In the case of the construction age plan as referred to in paragraph (1) more than 10 (ten) years, the Service Provider must be responsible for Building Failures in a maximum period of 10 (ten) year from the final delivery date of the Construction Services.
Formulation of the problems discussed: defects that occur, average costs and improvement due to defects in the construction of highrisebuildings after the FHO.
Research objectives: knowing defects, average cost of improvement and recommendations for improvement based on data defects in highrise building construction that occurs after FHO.
The limitations of this study are: the viewpoint of the service provider, the cost in question is the cost of repairing defects after FHO, the reference project is the building construction project of PT ABC.
II.LITERATURE REVIEW
The construction project process begins with planning and ends with Handover. During the process, several technical aspects related to the construction process are: Cost, Quality and Project Time.
Low and Chong (2004) have shown that design is the main cause of defects in buildings, because condition surveys show that design can prevent at least 66% of all defects found during the initial stages of occupancy.
Seeley's (1987) study also showed that 58% of defects were caused by incorrect design, 35% of operations and installations, 12% of material and poor systems, and 11% of unexpected user needs.
Harrison (1993) suggests that building quality is directly related to the number of defects found.
In overcoming the source of defects, according to Josephson and Hammarlund (1999), the source of the main causes of defects:
a. Designer / consultant,
Sources of design are defects caused by poor design decisions. Designer's decisions include material specifications, layout, and integration between different materials and systems.
b. Contractor
Labor sources are defects that cause poor work practices on site, such as poor installation methods, including poor mixing of materials, poor handling of materials, poor methods of implementation of the contractor and failure of the correct connection process.
c. Material supplier
Sources of material are defects caused by lower quality materials coming from suppliers. The quality of materials can only be expected to meet the required standards.
d. Maintenance contractor / Building Management.
Sources of maintenance are defects caused by materials or systems that are not properly maintained or irregular maintenance or even no maintenance. Lack of maintenance / protection is a defect caused by failure to provide proper preservation so that work results are not durable.
The process of implementing the construction is stated to be finished by doing a hand over. During the handover process, one of the things that contractors need to pay attention to is documenting learning or lessons learned.
According to Made Pastiarsa (2015) lessons learned include:
a. Explanation of the project, such as: background and project objectives, scope, schedule and project costs, chronology of the project trip, the owner along with the work contract number, project organization etc.
b. Project implementation performance from technical aspects, such as: success achieved compared to contract plans and provisions, especially on aspects of the schedule, costs, quality and scope of the project and the shortcomings and causes that need attention.
c. Additional / less work or agreed contract changes along with background or reasons for the proposal or agreement. d. Project implementation performance from administrative aspects, among others: success and shortcomings in
contract administration, handling claims etc.
e. Project implementation performance from management aspects, including experience of success and deficiencies in coordinating and communicating with all project stakeholders.
f. Problems and obstacles encountered during project implementation, background causes. Strategic decisions that have been taken and the choice of alternatives and their effects on the physical implementation of the project, especially those related to project boundaries such as cost, time and quality.
III. RESEARCH METHODOLOGY
This study will use secondary data in the form of Project Complaint Report (LKP) data, including: date of complaint, type of complaint and costs incurred.
The instrument used is Microsoft Excel and RCA Analysis (Root Cause Analysis).
Root Cause Analysis (RCA) is a problem solving tool to help find and understand the root causes of problems, with the aim of eliminating these root causes and preventing problems from reappearing.
Basically, RCA aims to identify the origin of the problem.
According to Robert J Tilano, att all (Root Cause Analysis 2011), several methods commonly used in RCA: The 5 Why's, The Fishbone Diagram, The Regulatory Form, and The Logic Tree.
In this case, The 5 Why's method is used, namely the method by asking "why" up to 5 times, so that the root problem can befound.
Methodof Problem Solving:
1. Determining defects that often occur in buildings that have FHO. Secondary data of LKPs are grouped according to the classification of defects.
2. The results of the study of data defects produced several main defects and were reviewed with RCA, so that there will be found causes of defects that arise.
3. Validate the RCA results by comparing the opinions of several Project Managers as expert judgment. 4. Determination of recommendations for improvement
IV.KAJIANDANPEMBAHASAN
Examples of 2008 LKP Data (January 2 - 12, 2008)
This data / LKP is an example of data from resolving defect repairs from January 2 to 12, 2008 from several projects that have been FHO and have been declared completed by the owner.
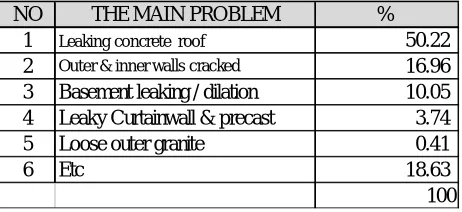
From processing the LKP data with Microsoft Excel, the dominant Defects such as Table IV.1 are obtained
All improvements to defects for 10 years (2008-2017) from buildings that have been FHO, after grouping are found the main problems that occur with the percentage value, according to Table IV.1Of course the largest percentage value is the cause of the most defects.
No Month Date Problem Code Total (Rp)
1 Jan 1/2 Leaking concrete roof 1 13,801,000.00
2 Jan 1/2 Etc 8 14,798,000.00
3 Jan 1/2 Leaking concrete roof 1 1,021,000.00 4 Jan 1/3 Leaking concrete roof 1 14,376,000.00 5 Jan 1/3 Leaking concrete roof 1 9,234,000.00 6 Jan 1/3 Leaking concrete roof 1 4,529,000.00 7 Jan 1/3 Outer & inner walls cracked 2 17,945,000.00
Table IV.1: Annual 10 Defects (2008-2017)
Roof leaks are the main cause of all LKPs that occur with a value of 50.22%. Other causes are sequential in the order of the percentages above.
Table IV.2: Number of Monthly LKPs for the 10-year period (2008-2017)
If the LKP that occurs every month from 2008 to 2017 is recorded, the number of defects will be obtained each month for each year, as in Table IV.2The average number of LKPs in a year = 166
The average number of LKPs in a month = 14
In accordance with the monthly average rainfall data in Kemayoran (Jakarta) from BMKG (Meteorology, Climatology and Geophysics Agency), data is obtained as shown in Figure IV.1
Kemayoran is one of the sub-district cities in Jakarta that is installed by the BMKG. In this case, the city is a reference for measurement, because most high-rise building projects in Indonesia are predominantly built in the city of Jakarta as the capital city of Indonesia.
NO THE MAIN PROBLEM %
1 Leaking concrete roof 50.22 2 Outer & inner walls cracked 16.96 3 Basement leaking / dilation 10.05 4 Leaky Curtainwall & precast 3.74 5 Loose outer granite 0.41
6 Etc 18.63
100
NO YEAR TOTAL
1 2 3 4 5 6 7 8 9 10 11 12 PER YEAR
1 2008 17 19 14 10 9 4 7 7 4 8 10 18 127
2 2009 25 26 9 17 17 6 9 15 5 12 25 17 183
3 2010 25 20 17 15 18 24 16 13 21 29 20 16 234
4 2011 16 18 20 12 19 8 13 2 4 16 9 10 147
5 2012 28 16 25 18 14 15 10 5 18 19 24 21 213
6 2013 39 13 19 18 14 11 15 6 10 11 18 11 185
7 2014 43 16 14 21 13 12 11 9 7 17 7 12 182
8 2015 18 14 17 10 9 11 5 11 7 3 11 8 124
9 2016 16 21 9 10 9 5 4 9 11 16 19 2 131
10 2017 23 14 9 12 14 7 6 11 5 12 15 5 133
MONTH
NO YEAR TOTAL
JAN FEB MAR APR MAY JUN JUL AGT SEPT OCT NOV DES PER YEAR 25 17.7 15.3 14.3 13.6 10.3 9.6 8.8 9.2 14.3 15.8 12 165.9
MONTH
Fig IV.1: Monthly Weather in a Year (BMKG)
From Table IV.2 and Figure IV.1, it can be concluded, that the number of LKPs is above the average of ≥ 12 LKPs, occurring between October and May, in accordance with the amount of water discharge ≥100 mm or occurs in the rainy season.
Cost of Repairing Defects
From LKP data, it is found that the amount of annual defects repair costs, such as table IV.3:
Table IV.3: Costs for Repairing Annual Defects (2008-2017)
The cost of this repair data is the amount of costs incurred by PT ABC for all sub-contractors and declared completed by the owner with an Official Report on each LKP The amount of this fee depends on the level of damage per LKP, which is certainly a matter that continues to move and is not the same at all times.
Based on Table IV.2 and Table IV.3, the average LKP data and cost averages are obtained such as Table IV.4:
Table IV.4: Average annual LKP and cost data (2008-2017)
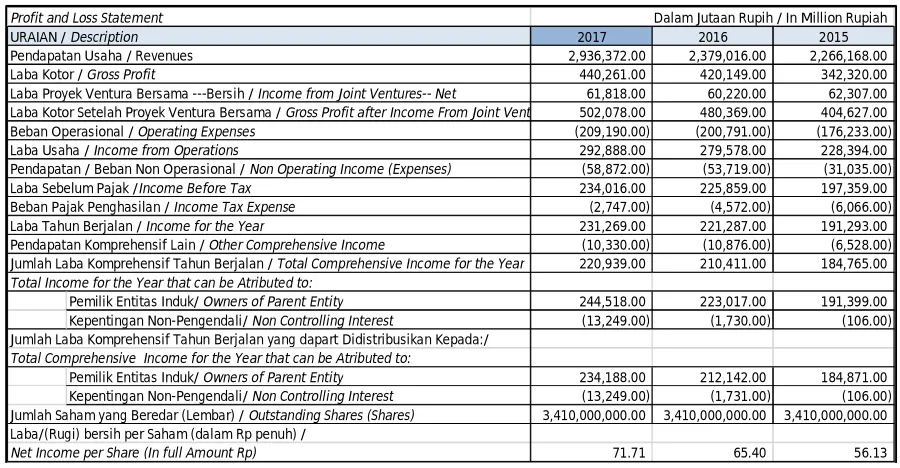
Based on the Financial Report in Figure IV.2 and Data on Improvement of the average Defects in Table IV.4, the percentage of the cost of repairing revenues obtained is:
Rp 2.000.931.854 x 100% = 0,068 % Rp 2.936.372.000.000
From the percentage value of 0.068%, from the Management of PT ABC, it was decided to continue implementing improvements to defects after the FHO.
The financial statements in Figure IV.2 are obtained from the PT ABC Annual Report.
Fig IV.2: PT ABC Financial Reports for 2015-2017
Relationship between Repairing Defects and Customer Satisfaction
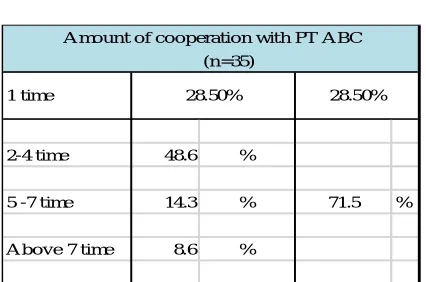
Repeat Customer data obtained from surveys conducted by PT ABC using external consultants for the 2017 survey period, obtained data such as Figure IV.3:
ANNUAL LKP (Bh) 166
MONTHLY LKP (Bh) 14
ANNUAL COST (Rp) 2,000,931,854
MONTHLY COST (Rp) 166,744,321
COST PER LKP (Rp) 12,053,806 AVERAGE
LAPORAN LABA RUGI
Profit and Loss Statement
2017 2016 2015
Pendapatan Usaha / Revenues 2,936,372.00 2,379,016.00 2,266,168.00
Laba Kotor / Gross Profit 440,261.00 420,149.00 342,320.00
Laba Proyek Ventura Bersama ---Bersih / Income from Joint Ventures-- Net 61,818.00 60,220.00 62,307.00 Laba Kotor Setelah Proyek Ventura Bersama / Gross Profit after Income From Joint Ventures 502,078.00 480,369.00 404,627.00 Beban Operasional / Operating Expenses (209,190.00) (200,791.00) (176,233.00) Laba Usaha / Income from Operations 292,888.00 279,578.00 228,394.00 Pendapatan / Beban Non Operasional / Non Operating Income (Expenses) (58,872.00) (53,719.00) (31,035.00) Laba Sebelum Pajak /Income Before Tax 234,016.00 225,859.00 197,359.00 Beban Pajak Penghasilan / Income Tax Expense (2,747.00) (4,572.00) (6,066.00) Laba Tahun Berjalan / Income for the Year 231,269.00 221,287.00 191,293.00 Pendapatan Komprehensif Lain / Other Comprehensive Income (10,330.00) (10,876.00) (6,528.00) Jumlah Laba Komprehensif Tahun Berjalan / Total Comprehensive Income for the Year 220,939.00 210,411.00 184,765.00
Total Income for the Year that can be Atributed to:
Pemilik Entitas Induk/ Owners of Parent Entity 244,518.00 223,017.00 191,399.00 Kepentingan Non-Pengendali/ Non Controlling Interest (13,249.00) (1,730.00) (106.00) Jumlah Laba Komprehensif Tahun Berjalan yang dapart Didistribusikan Kepada:/
Total Comprehensive Income for the Year that can be Atributed to:
Pemilik Entitas Induk/ Owners of Parent Entity 234,188.00 212,142.00 184,871.00 Kepentingan Non-Pengendali/ Non Controlling Interest (13,249.00) (1,731.00) (106.00) Jumlah Saham yang Beredar (Lembar) / Outstanding Shares (Shares) 3,410,000,000.00 3,410,000,000.00 3,410,000,000.00 Laba/(Rugi) bersih per Saham (dalam Rp penuh) /
Net Income per Share (In full Amount Rp) 71.71 65.40 56.13
Fig IV.3: Data Repeat Customer PT ABC "Results of 2017 Consultant Survey" Selection of respondents with convenient sampling method
Source :Markplus Consulting Analysis 2017
Based on the results of the interview with the customers, the data obtained from the advantages and disadvantages of PT ABC as shown in Fig IV.4:
Fig IV.4: Comparison of Strengths & Weaknesses PT ABC
Based on Fig IV.4 on "Services" (there is a Life Time Guarantee service, good Customer Service and good After Sales service), it can be stated that the Owner is satisfied with the repair service after the FHO and is proven to have become a Repeat Customer, such as the data in Figure IV.3.
Root Cause Analysis (RCA) and Expert Judgement
The results of the study of LKP data over a period of 10 years, the largest costs incurred for each item defects are in
(n=35)
2-4 time 48.6 %
5 -7 time 14.3 % 71.5 %
Above 7 time 8.6 %
Amount of cooperation with PT ABC
28.50%
1 time 28.50%
ADVANTAGES DEFICIENCY
SERVICE 1. The quality of construction work is satisfying There are still cases of project delays
RESULT 2. Responsible for completing the project under any circumstances
1. Staff / employee quality is qualified 1. Coordination with less established subcontractors
2. Having a system that is consistently run 2. Management of K3 is still lacking
FIELD 3. Very detailed in the work 3. Consistency with the project timeline is lacking.
OPERATIONAL 4. High safety awareness 4. Maintenance of work equipment is not good.
5. Good quality and performance 5. Less responsive to complaints
6. English language skills Poor staff.
FIELD 1. There is a life time guarantee service 1. Prices are more expensive than others.
2. Good customer service 2. Less flexible in terms of contracts
Table IV.5: The Biggest 10-Year LKP Period (2008-2017)
When compared between defects that often appear for 10 years (Table IV.1) and the greatest cost of defects for 10 years (Table IV.5), then there are 4 dominant defects, as in Table IV.6:
Table IV.6: Causes of 10 Annual Largest Defects & Costs (2008-2017)
Or it can be said that the 4 problems in this table are the problem of dominant problems that occur from the point of view of the causes of defects and the viewpoint of the biggest costs. We are looking for this part of the slice so that the main cause will be found at the time of RCA.
From Table IV.6, a Root Cause Analysis is performed on the 4 Main problems and validation with Expert Judgment. In each of the problems, RCA was carried out: asking up to 5 times, why did this happen. Arriving at the root of the problem, we get things that need to be fixed.
Validation with the results of written interviews to several project managers who have worked for more than 5 years at PT ABC (in this case an Expert Judgment). So the RCA results are the actual results.
V. CONCLUSIONS AND SUGGESTIONS Conclusion
Defects that often occur after FHO in a highrisebuilding project at PT ABC are: 1. Leaking the roof floor
2. Outer and Inner Walls Cracked 3. Basement leaking / dilation
4. Screeds Remove from Concrete Plates / Etc
Based on the results of the RCA and Expert Judgment, the main things that are the causes of these defects are:
1. Stage Design: wrong design, improper selection of material types (waterproofing, Waterstop), planning the number of supporting equipment requirements from the owner for incomplete building operations (adding antennas, billboards, no gondolas).
2. Implementation phase: Cold joint implementation method, supervision of the lack of work (addition of water,
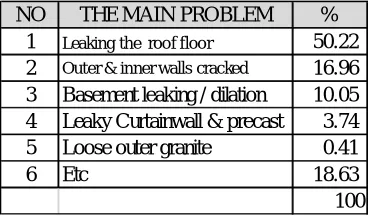
NO THE MAIN PROBLEM %
1 Leaking the roof floor 50.22 2 Outer & inner walls cracked 16.96 3 Basement leaking / dilation 10.05 4 Leaky Curtainwall & precast 3.74
5 Loose outer granite 0.41
6 Etc 18.63
100
NO THE MAIN PROBLEM
1 Leaking the roof floor
2 Outer & inner walls cracked
3 Basement leaking / dilation
Average Defects Cost
The cost of repairing the average defects needed and the number of LKPs in the construction of a highrisebuilding after the FHO at PT ABC are:
- Total LKP / month : 14
- Total LKP / year : 166
- Cost per month : Rp. 166,744,321
- Costs per year : Rp. 2,000,931,854
- Cost per LKP : Rp12,053,806
Advice and Improvement
Things to note when handling defects are:
1. Recording the scope of work during the construction period must be clear, because with this archive, it will be clear the responsibility for repairing its defects. Because it could be during the construction period, done by the owner himself, / Direct Subcontractor.
1. The speed of response from the contractor, whether in the form of oral and written communication is very necessary, because in this case the owner is having problems with defects, requiring other parties who can help quickly.
2. Able to track data during construction, (project personnel data, project subcontracts and material supplier data), to help repair the defects.
3. The service provider must have a Subcon Team specifically to repair defects after the FHO, to quickly handle owner complaints about defects.
4. Before carrying out repairs, joint checks must be carried out between: the owner, the contractor team and the subcontractor, to agree on matters that must be corrected, the Job safety Analysis and the cost of implementation.
REFERENCES
[1] Chew, M.Y.L. “Defects Analysis on Wet Areas of Buildings. ”Constr. Build. Mater., 19(3), 165-173, 2005
[2] Hansen, S. : Manajemen KontrakKonstruksi : “PedomanPraktisdalamMengelolaProyek Konstruksi.”22(1), 210-211, 2015 [3] Harrison, H.W., Quality in New BuidHousing , Building Research Establishment, Watford, U.K, 1993
[4] Josephson, P.E danHammarlund, Y. “ the causes and cost of defects in construction: A Study of seven buildings projects.” Autom Construct., 8(6), 681-687, 1999
[5] Law of the Republic of Indonesia Number 2 of 2017 concerning Construction Services, 33-34, 2017
[6] Low, S.P. and Chong, W.K.. ”Construction Quality Evaluation and Design Parameters for Preventing LatebtDefecrs in Buildings. ”Proc, Joint Intl Sympo, of CIB Working Commissions, Singapore, 554-556, 2004
[7] Made Pastiarsa. “Manajemen ProyekKonstruksiBangunanIndustri, PerspektifPemilikProyek.” Teknosain, 189, 2015 [8] Project Management Body of Knowledge” (PMBOK) 5thEdition , 2013.
[9] Robert J latino, Kenneth C Latino, Mark A Latino , Root Cause Analysis, Reliability Center, Inc, 145-146, 2011 [10] Seely, I.H. Building Maintenance , 2nd Editions, Macmillan, London, 1987