Study of Risk and Cost at Planning Phase of
Construction Project in Oil and Gas Industry
(Study Case: Project XYZ)
Mathawi1, Johny Johan2
P.G. Student, Dept. of Civil Engineering, Tarumanagara University, Jakarta, Indonesia1
Doctor Lecturer, Dept. of Civil Engineering, Tarumanagara University, Jakarta, Indonesia2
ABSTRACT: The construction industry for industrial buildings, especially the oil and gas industry is very vulnerable to the risk of uncertainty because of the nature of its business from the assessment of the initial project investment to the physical completion at the end of the project. Risk management ensures that risks can be identified, examined and mitigated where stakeholders are key in any decision making. The application of risk management in a project is very necessary so that the success rate is high and generate high profits on the project team. In this study the risk and cost study was carried out by analyzing the HAZOP study report with probability techniques andMonte Carlo simulation withCrystal Ball Version 11.1.2.3 software. To determine the most significant risk and cost consequences in the entire system in the production plant and the feasibility of the project to be able to continue in the construction phase (EPC). From the simulation results at 90% confidence level, the risk range values in Low category based on OWNER risk ranking matrix specifications. While estimated cost of the project based on the AACE international standard at 90% confidence level is still within the range of the cost value.
KEYWORDS: Risk Management, HAZOP study, Monte Carlo Simulation and Crystal Ball.
I. INTRODUCTION
The Oil and Gas Sectoris an important element for developing countries to improve the quality of people's lives. And also catch up with other countries. The high public consumption of fuel oil (BBM) along with very high population growth each year has become a central issue of energy lately. So that the national development efforts being carried out in essence are efforts to improve people's welfare by increasing oil production from existing wells.
Field X is located in Pelawad Village, Karawang-West Javawhich is the working area of PT. ABC - Subang Field. The surface production facility called the Collecting Station X is located on the ABC-03 well site, which will be built with 2 (two) procurement schemes, namely: rental and permanent facilities. The oil fluid from field X will be produced in advance of all X wells. The field production fluid X will be processed to meet the gas and oil sales specifications. Gathering Station) X is designed to produce 7 MMSCFD of gas (6 MMSCFD non asso gas and 1 MMSCFD gas asso), 2700 BOPD and 500 BWPD. Asso gas is a gas with high CO2 content and cannot be processed while non asso gas is a
gas with low CO2 content and can be processed. The purpose of this study are:
1. To Obtain and know the risks and costs at the planning stage of the construction project of the oil and gas industry.
2. From the results of the risk study based onHAZOP study report and costs at the FEED stage, it can be seen the feasibility of the project to proceed to EPC construction stage with the help of Crystal Ball software version 11.1.
II. LITERATUREREVIEW
FEED (Initial Planning)
FEED (Front End Engineering Design) is also called FEL (Frond End Loading) is a planning phase of the project where the FEED document will be used as a tender / tender document for EPC work. InFEED phasewill determine the basic design and carry out the initial design of the construction of the building to be built.
The aim of the FEED is to develop the scope of the project and to provide all specifications needed for project implementation. Engineering design specifications and estimated project costs (OWNER Estimate) are the main products of this phase. The FEED phase is carried out by an engineering consultant appointed by the OWNER through the Auction / Tender process.
EPC (Engineering, Procurement and Construction)
A process by which a contractor works on a project with the scope of responsibility for completing work including design studies, material procurement and construction and planning of the three activities. Usually used for complex project projects such as: oil and gas industry, fertilizer factory, petrochemical. The scope of EPC's work includes: procurement of materials and equipment, all design, engineering, procurement, construction and installation work including commissioning, start-up, training, and reception and testing activities. So that all the required tasks are ready to be operated and submitted to the OWNER.
Fig. 1 Typical life cycle of oil and gas projects (Moazzami, M, 2015)
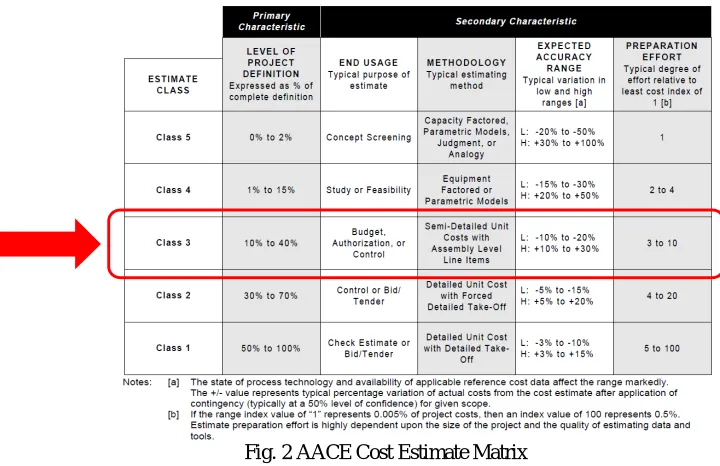
Fig. 2 AACE Cost Estimate Matrix
Risk Management
A structured approach / methodology for managing uncertainty related to threats. A series of human activities including; risk assessment, development of strategies to manage it and risk mitigation by using empowerment / resource management.
Fig. 3 Risk Management Process in project (Dale, 2005)
HAZOP
Hazard and Operability (HAZOP) is one method of qualitative analysis to identify potential hazards and operational problems of a project / facility. According to Dale (2005) the HAZOP focuses on examining the proposed process systems, equipment and procedures systematically and in detail, through structured use through the process of "brainstorming" using guidewords to immediately check deviations from design conditions.
people including management, design, operations and maintenance and operation personnel directly involved in the project.
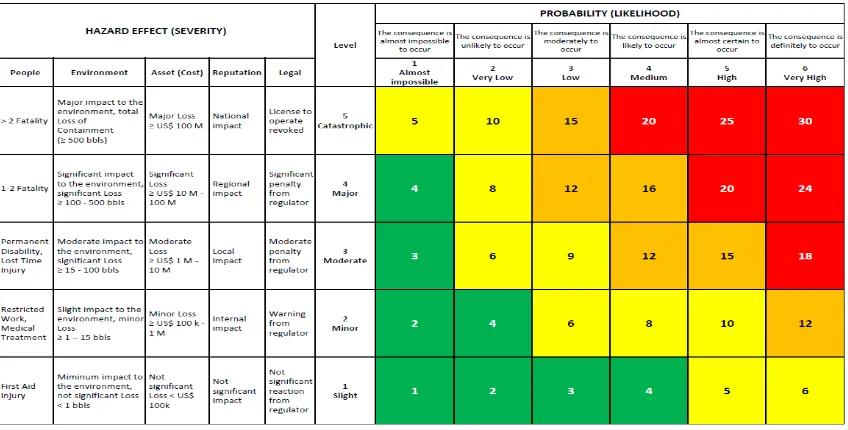
Table 1: OWNER risk ranking specification matrix
The application of risk management on a project as an important tool to achieve higher quality and quantity in renewable energy development projects.
Based on the above problems, the risk studies in the HAZOP report and costs at the initial planning stage (FEED stage) will be carried out as a method to determine what factors have a significant impact on project management activities before the integrated construction phase (EPC) is continued. And to explore the process of the auction / tender stages in the construction industry, especially oil and gas from the FEED (initial planning) stage.
Monte Carlo Simulation
One method of risk analysis found in ISO 31000 is a Monte Carlo simulation, which is a method that can overcome complex situations that will be very difficult to understand and solve with an analytical method. The usefulness of this method is to evaluate the effects of uncertainty in a system in a wide range. In the risk analysis and cost of Monte Carlo simulation is a mathematical technique that is computerized and can calculate risks and costs in quantitative analysis and decision making. Monte Carlo simulations carry out risk and cost analysis by modelling a possible outcome by substituting a range of possible distribution values for any factor containing uncertainty. The simulation then calculates the results repeatedly each time using a different random value from the probability function.
Crystal Ball
Sensitivity Analysis
This analysis helps determine which risks have the most potential impact on a project. This analysis also helps to understand how variations in project objectives correlate with variations in different uncertainties. Instead, he tests the extent to which the uncertainty of each element of the project influences the objectives being studied when all other uncertain elements remain.
III.RESEARCHMETHODOLOGY
The data used in this study is secondary data, namely data obtained from the second party. The X Field FEED Project which is used as the object of study in this study is located in Karawang, West Java.
The data analysis technique uses Crystal Ball Version 11.1.2.3 with the following stages: 1. Input data on risk and costs that have been identified
2. Input data in the form of upper limit (maximum), lower limit (minimum) and frequency level (likelihood) 3. Start the simulation.
4. The simulation results in the form of a forecast graph in the form of probability with several confidence levels of statistical data and the significance of risks and costs so that the risk factors which have the most influence on the project can be known
IV.STUDYANDDISCUSSION
This study begins by analyzing the HAZOP report using Value Engineering techniques for each NODE, then proceed with risk and cost analysis using crystal ball software.
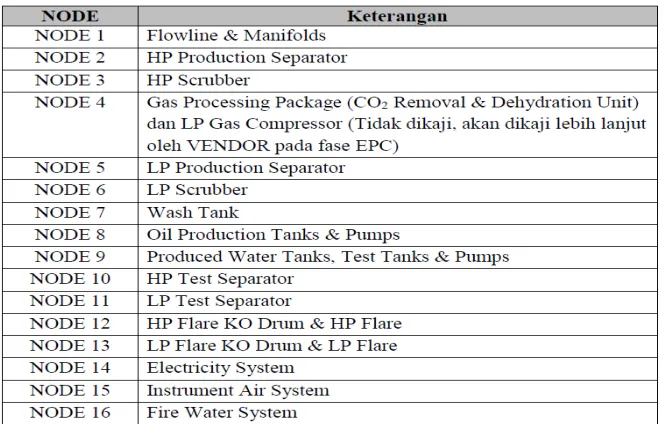
In this project based on the HAZOP report, the number of nodes has been determined by the HAZOP Team total 16 numbers, including:
Table 2:NODE list
NODE 1
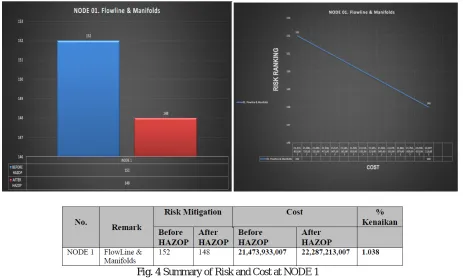
Fig. 4 Summary of Risk and Cost at NODE 1
Summary for the entire NODE shown at table below.
Table 3:Summary of the results of the risk assessment of entire NODE
From the table above, it can be seen that the overall cost increase 1.009% after analysis on the study's HAZOP report.
NO. REMARK BEFORE
HAZOP AFTER HAZOP BEFORE HAZOP AFTER HAZOP
Deviation % Increase
NODE 1 01. Flowline & Manifolds 152 148 21,473,933,007 22,287,213,007 813,280,000 1.038
NODE 2 HP Production Separator 182 165 21,473,933,007 21,686,073,007.19 212,140,000.00 1.010
NODE 3 HP Scrubber 108 102 21,473,933,007 22,038,033,007.19 564,100,000.00 1.026
21,473,933,007
21,473,933,007.19 - 1.000
NODE 5 LP Production Separator 192 168 21,473,933,007 21,645,133,007.19 171,200,000.00 1.008
NODE 6 LP Scrubber 124 115 21,473,933,007 21,660,043,607.19 186,110,600.00 1.009
NODE 7 Wash Tank 92 80 21,473,933,007 21,499,533,007.19 25,600,000.00 1.001
NODE 8 Oil Production Tanks
& Pumps 188 179 21,473,933,007 21,537,907,007.19 63,974,000.00 1.003
NODE 9 Produced Water Tanks,
Test Tanks & Pumps
132 117 21,473,933,007 21,508,473,007.19 34,540,000.00 1.002
NODE 10 HP Test Separator 192 189 21,473,933,007 21,499,533,007.19 25,600,000.00 1.001
NODE 11 LP Test Separator 200 194 21,473,933,007 21,619,533,007.19 145,600,000.00 1.007
NODE 12 HP Flare KO Drum
& HP Flare 48 36 21,473,933,007 21,765,933,007.19 292,000,000.00 1.014
NODE 13 LP Flare KO Drum
& LP Flare 48 39 21,473,933,007 21,585,933,007.19 112,000,000.00 1.005
NODE 14 Electricity System 84 78 21,473,933,007 21,679,533,007.19 205,600,000.00 1.010
NODE 15 Instrument Air System 108 105 21,473,933,007 21,541,165,807.19 67,232,800.00 1.003
NODE 16 Fire Water System 24 24 21,473,933,007 21,486,733,007.19 12,800,000.00 1.001
343,582,928,114.99
346,514,705,514.99 1.009
1.009
2,931,777,400.000
NODE 4 (Akan dikaji oleh VENDOR during EPC stage)
RISK
TOTAL
COST IMPACT AFTER HAZOP (% ) COST DEVIATION
Sensitivity Analysis for Risks
The minimum risk scale is obtained based on the OWNER ranking risk specification data. Consequences Likelihood: Risk ranking after HAZOP recommendations from the HAZOP team of the entire NODE in the system.
The maximum risk scale is obtained based on the OWNER risk ranking specification data.
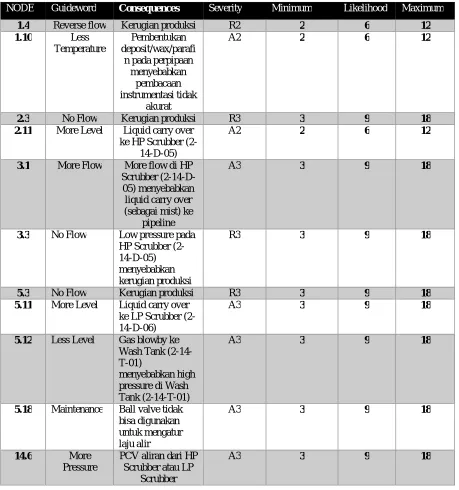
Table 4: Input Risk Analysis for Crystal Ball
NODE Guideword Consequences Severity Minimum Likelihood Maximum
1.4 Reverse flow Kerugian produksi R2 2 6 12
1.10 Less Temperature
Pembentukan deposit/wax/parafi
n pada perpipaan menyebabkan
pembacaan instrumentasi tidak
akurat
A2 2 6 12
2.3 No Flow Kerugian produksi R3 3 9 18
2.11 More Level Liquid carry over ke HP Scrubber
(2-14-D-05)
A2 2 6 12
3.1 More Flow More flow di HP Scrubber (2-14-D-05) menyebabkan liquid carry over (sebagai mist) ke
pipeline
A3 3 9 18
3.3 No Flow Low pressure pada HP Scrubber (2-14-D-05) menyebabkan kerugian produksi
R3 3 9 18
5.3 No Flow Kerugian produksi R3 3 9 18
5.11 More Level Liquid carry over ke LP Scrubber (2-14-D-06)
A3 3 9 18
5.12 Less Level Gas blowby ke Wash Tank (2-14-T-01)
menyebabkan high pressure di Wash Tank (2-14-T-01)
A3 3 9 18
5.18 Maintenance Ball valve tidak bisa digunakan untuk mengatur laju alir
A3 3 9 18
14.6 More Pressure
PCV aliran dari HP Scrubber atau LP
Scrubber
NODE Guideword Consequences Severity Minimum Likelihood Maximum
gagal/rusak pada kondisi terbuka 14.12 Less Level Gas blowby pada
flare sump pit (safety hazard)
M3 3 9 18
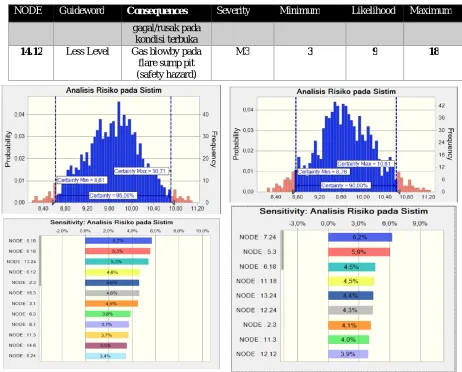
Fig. 5 Simulation results at confidence level95% & 90% for risk
Based on some of the simulation results in the picture above, it shows the following:
1. - At 95% confidence level the results obtained are the probability of the level of risk with a range of 8.61 to 10.71.
- NODE 5.18 (LP Production Separator - Maintenance) withconsequence that ball valve cannot be used to regulate the flow rate having the highest sensitivity value of 5.7%
2. - At 90% confidence level the results obtained are the probability of the level of risk with a range of 8, 76to10, 61.
- NODE 7.24 (Wash Tank - Design) with consequence causing barriers to venting lines and flame arrestor not optimal for protecting tanks having the highest sensitivity value of 6.2%
Sensitivity Analysis for Costs
The minimum cost estimate is obtained based on the AACE Cost Estimate Matrix in Class 3 with L: - 20% of the cost at each WBS Level.
Likelihood: initial planning costs compiled at the FEED stage
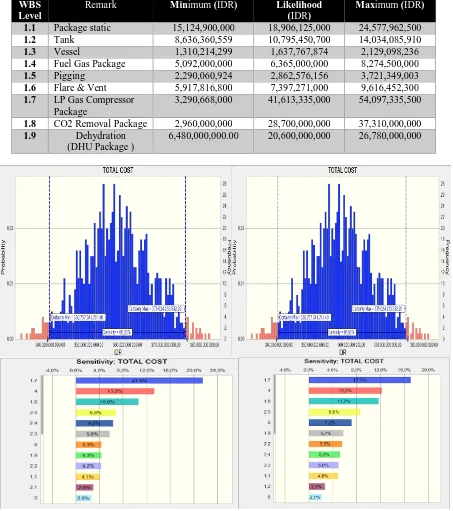
Table 5: Input Cost Analysis Crystal Ball
WBS Level
Remark Minimum (IDR) Likelihood
(IDR)
Maximum (IDR)
1.1 Package static 15,124,900,000 18,906,125,000 24,577,962,500 1.2 Tank 8,636,360,559 10,795,450,700 14,034,085,910 1.3 Vessel 1,310,214,299 1,637,767,874 2,129,098,236 1.4 Fuel Gas Package 5,092,000,000 6,365,000,000 8,274,500,000 1.5 Pigging 2,290,060,924 2,862,576,156 3,721,349,003 1.6 Flare & Vent 5,917,816,800 7,397,271,000 9,616,452,300 1.7 LP Gas Compressor
Package
3,290,668,000 41,613,335,000 54,097,335,500
1.8 CO2 Removal Package 2,960,000,000 28,700,000,000 37,310,000,000 1.9 Dehydration
(DHU Package )
6,480,000,000.00 20,600,000,000 26,780,000,000
Based on some of the simulation results in the picture above, it shows the following:
1. - At the 95% confidence level the results obtained are probability level costs with a range of 339,757 to 375,024. - WBS Level 1.7(LP Gas Compressor Package) has the highest sensitivity value of 21.5%.
2. - At a 90% confidence level the results obtained are the probability of a cost level with a range of 343,854 to 372,983. - WBS Level 1.7 WBS (LP Gas Compressor Package) has the highest sensitivity value of 17.1%.
V. CONCLUSIONS
The results obtained can be summarized as follows.
1. Based on the recommendations from the study's HAZOP report after a study of risks and costs in the entire NODE using the VE Job Plan technique, a cost increase of 1.009% (2,931,777,400 Billion) was obtained. The impact of the increase in cost (cost impact) of 1.009% is not too significant from the total project cost, therefore FEED project Field X is feasible to continue on EPC construction phase.
2. The results of the Risk Analysis for the entire NODE can be seen in the table below. C.L Risk Range Risk Significant Percentage
value 95% 8.61 to 10.71 NODE 5.18 5.7 % 90% 8.76 to 10.61 NODE 7.24 6.2 % 85% 8.91 to 10.53 NODE 5.12 5.6 % 80% 8.97 to 10.35 NODE 13.24 6.4 % 70% 9.14 to 10.25 NODE 13.12 6.9 %
From the table above it can be seen that the results of the risk sensitivity analysis vary depending on the level of confidence (Confidence Level) used.
Based on the simulation results above from several levels of confidence and based on common practice used at statistical literature. Hence author chooses at the level of confidence (C.L.) 90% with a risk range8.76 - 10.61. Based on the Risk ranking specification from the OWNER, the overall risk for this project falls into the category with LOW Probability (likelihood) at the Moderate - 3 level (see table 1), the project is feasible to continue on EPC construction phase.
3. Results Analysis of the overall cost of the project can be seen in the table below. C. L. Cost Range
(IDR)
WBS Cost Significant
Percentage value 95% 339.757 to 375.024 Level 1.7 21.5 % 90% 343.844 to 372.983 Level 1.7 17.1 % 85% 345.787 to 370.456 Level 1.7 27.7 % 80% 346.461 to 370.021 Level 1.7 21.1 % 70% 348.595 to 367.024 Level 1.7 21.3 %
Based on the simulation results on several levels of confidence, at confidence level 90% with a range of costs343,844 - 372,983 billion, hence OWNER Estimate price at FEED stage 346,514 billion is still within that range. The estimated cost of the project at the FEED stage is feasible to continue at the construction stage (EPC phase).
4. From the results of sensitivity analysis at different levels of confidence (Confidence Level), the same results were obtained at WBS Level 1.7 (LP Gas Compressor Package) becausehad a significant impact on the overall cost of the project.
5. Sensitivity analysis is very effective in helping determine what factors are the most sensitive / significant in a project.
REFERENCES
[1] AACE International Recommended Practice No. 18R-97. Cost Estimate Classification System – as Applied in Engineering, Procurement and Construction for the Process Industries,1998.
[2] Berawi, M.A., “The Integration of Value and Risk Management in Infrastructure Projects: Learning from others,” Quantity Surveying International conference Kuala Lumpur, Malaysia,pp. 1–13, 2007.
[3] Chapman, C. & Ward, S., “Project Risk Management: Processes, Techniques and Insight,” John Wiley & Sons, 2002.
[4] Dale, C., “Project Risk Management: Managing Risk in Large Projects and Complex Procurements,” John Wiley and Sons, 2005. [5] Dell’Isola, “A.Value Engineering: Practical Application,” United States of America: RS Means Company Inc, 1997.
[6] Hamid, R.F, Nasiri S.Integrating Risk Management and Value Engineering in the Development of Renewable Energy Project. SAS Technical Paper, vol. 6, no. 11,pp. 1–10, 2012.
[7] Haghnegahdar Lida, and Ezzatollah A. The Risk and Value Engineering Structures and their Integration with Industrial Projects Management (A Case Study on I. K. Corporation). International Journal of Structural and Construction Engineering, vol.2, no. 4,pp. 1–9, 2008.
[8] IEC 61882Hazard and Operability Studies (HAZOP Studies) - Application Guide, 2016. [9] ISO 31000 (2009). Risk Management - Principles and Guidelines, Published in Switzerland, 2009.
[10] Maisenbacher, Sebastian, “Extended Model for Integrated Value Engineering,” Procedia Computer Science 28,pp. 1–8, 2014.
[11] Moazzami, M. A,“Theoretical Framework to Enhance the Conversion Process in Convertible Contracts,” International Journal of Construction Engineering and Management 2015, vol.4, no. 6, pp. 1–8, 2015.
[12] Oberlender, Garold D., “Project Management for Engineering and Construction,” McGraw Hill Education, 2000.