ISSN 2286-4822 www.euacademic.org
Impact Factor: 3.1 (UIF) DRJI Value: 5.9 (B+)
Attitude and Level of Knowledge of Farmers on ICT
based Farming
KHONDOKAR HUMAYUN KABIR Lecturer Department of Agricultural Extension Education Bangladesh Agricultural University, Mymensingh
Abstract:
which could help towards conversion of traditional farming to ICT based farming and also for development in future Bangladesh.
Key words: ICT based farming, Attitude, Level of Knowledge
General Background
Agricultural Extension in the current scenario of rapidly changing world has been recognized as an essential mechanism for delivering knowledge (information) and advices as an input into modern farming (Jones, 1997). Present day agriculture and Bangladeshi farming community is facing a multitude of problems to maximize crop productivity. In spite of successful research on new agricultural practices related to crop cultivation, the majority of farmers are not getting upper bound yield due to several reasons. One of the reasons is expert/scientific advice regarding crop cultivation is not reaching farming community in a timely manner. Farmers need expert advice well on time to make them more productive and competitive. For this, extension agency plays a major role in bridging this gap to make available the latest technologies at the door step of the farmers.
1997; Chapman et al. 2004; Anandajayasekeram et al. 2008; Mcnamara 2009; Aker 2010). E-agriculture helps in dissemination of gathered information to the farmers, mostly lived in rural areas, to use in their routine work (World Summit on the Information Society, Geneva 2003). In a country like Bangladesh farms are extremely small, cultivation is dependent on the uncertainties of variable rainfall and average output is generally low. Value addition in agriculture requires technological, institutional and price incentive changes designed to raise the productivity of the small farms (Todaro, 2000). Imperfect information and high transaction costs can constitute major impediments in the agricultural marketing process (Dao, 2004). Information helps the poor to avail of the opportunities and also reduce their vulnerability. Kiplang’at (1999).
Recent developments in information and communications technology (ICT) offer a great opportunity to facilitate the flow of information and technology services delivery especially to the farmers (Maningas, 2006). It is comprehensible that on the one hand agriculture is becoming highly science driven and knowledge intensive, but on the other hand the existing public extension system, has become less effective, more time consuming and costly and fails to meet the expectations of those involved in agricultural production
(Mruthunjaya and Adhiguru, 2005). The role of public
promoted for communication between researchers, extension workers and farmers to transfer technologies and information in a cost effective manner. Moreover, at present, the ratio of the farm families to the extension agent is 1000:1, which is really very less (NAEP, 1996). ICT has many potential applications in agricultural extension (Zijp, 1994), most especially in accessing required information and knowledge (Richardson, 1997; Chapman et al., 2004; Mcnamara, 2009).
The use of ICT is an important pillar of agriculture extension and in the current scenario of a rapidly changing world, has been recognized as an essential mechanism for delivering knowledge (information) and advice as an input for modern farming (Jones, 1997). ICT covers any product that will store, retrieve, manipulate, transmit or receive information electronically in a digital form.For example, personal computers, digital television, email, mobile etc. As ICT’s diffusion started to grow in many developing countries, the application of ICT to agricultural and rural development began to receive the attention of researchers and policy makers. A number of studies have suggested that ICT could play an important role in agricultural development.
proved that rural community possess positive attitude towards ICT and they welcome any ICT project to be built in their areas. However, Shiro (2008) also found that their lack of ICT knowledge reduces their ICT usage.
Here, an attempt has been made to analyze the reaction and to know the level of knowledge of the farmers towards ICT as a source of reliable and timely information about best production practices, processing, marketing, input and output prices, financial and risk-covering institutions etc. The favorable attitude of farmers towards ICT as an effective and efficient information support tool would lead to stronger conviction and efficient extension program planning in changing agri-rural environment. The focus of this study was on the attitude of the farmers towards ICT based agricultural system, their present level of knowledge on ICT based agriculture, the present situation of the system, problem faced by the farmers to run-through this system, which will be very helpful for the improvement of the existing system as well as the development in e-agricultural sector of Bangladesh.
Methodology
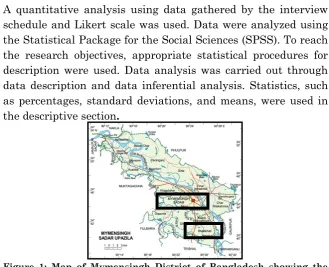
Area and Sampling
personal interview was conducted with the 90 respondents through the interview schedule in January 2014.
Measuring Attitude and Level of Knowledge of farmers
For measuring attitude of the respondents a 5-point Likert scale was used. There were twelve (12) statements including both positive and negative against the 5-point scale to avoid the biasness of the respondents. The 5-ponit scale: ‘strongly agree’, ‘agree’, ‘undecided’, ‘disagree’ and ‘strongly disagree’ with assigned score 5, 4, 3, 2 and 1 respectively.
The level of knowledge was measure followed by Bloom’s Taxonomy technique and by asking them 12 questions regarding ICTs. The correct answer for each question was given a score 2 and for each wrong answer o. Thus, the knowledge score was calculated from the responses to the 12 item.
Statistical Measure
A quantitative analysis using data gathered by the interview schedule and Likert scale was used. Data were analyzed using the Statistical Package for the Social Sciences (SPSS). To reach the research objectives, appropriate statistical procedures for description were used. Data analysis was carried out through data description and data inferential analysis. Statistics, such as percentages, standard deviations, and means, were used in the descriptive section.
Findings and Discussion
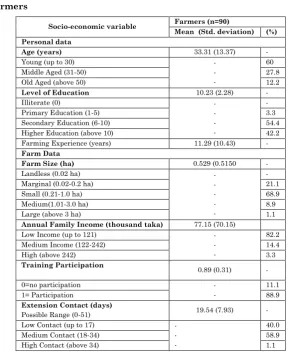
Socio-economic Profile of Respondents: Socio-economic characteristics of respondent farmers were analyzed and presented in Table 1.
Table 1: Salient Features of the Selected Characteristics of the Farmers
Result in table 1 shows that majority (60.0%) of the respondent’s belonged to young age group followed by middle age (27.8%) and old age (12.2%) group. The frequency distribution was highly skewed towards the younger
Socio-economic variable Farmers (n=90)
Mean (Std. deviation) (%) Personal data
Age (years) 33.31 (13.37) -
Young (up to 30) -
- -
60
Middle Aged (31-50) 27.8
Old Aged (above 50) 12.2
Level of Education 10.23 (2.28) -
Illiterate (0) -
- - -
-
Primary Education (1-5) 3.3
Secondary Education (6-10) 54.4
Higher Education (above 10) 42.2
Farming Experience (years) 11.29 (10.43) -
Farm Data
Farm Size (ha) 0.529 (0.5150 -
Landless (0.02 ha) -
- - - -
-
Marginal (0.02-0.2 ha) 21.1
Small (0.21-1.0 ha) 68.9
Medium(1.01-3.0 ha) 8.9
Large (above 3 ha) 1.1
Annual Family Income (thousand taka) 77.15 (70.15)
Low Income (up to 121) -
- -
82.2
Medium Income (122-242) 14.4
High (above 242) 3.3
Training Participation
0.89 (0.31) -
0=no participation -
-
11.1
1= Participation 88.9
Extension Contact (days)
Possible Range (0-51) 19.54 (7.93) -
Low Contact (up to 17) -
- -
40.0
Medium Contact (18-34) 58.9
respondents. This means that more young people are getting involved in making use of ICT services for getting useful information.
While looking at the educational status of respondent, result revealed that majority (54.4%) of respondents had secondary education followed by higher education (42.2%) and primary education (3.3%) respectively. The study findings lead to conclude that future development program on ICTs will be helpful in the present study areas due to better educational qualification of the respondents.
The respondent farmers of the study areas had good farming experience with a mean score 11.29 and standard deviation 10.43.
Out of total 90 farmers under study, 68.9 percent had small farm land followed by 21.1 percent marginal, 8.9 percent medium and only 1.1 percent had large farm land. Moreover, it was observe that 82.2 percent of the respondents had low income followed by 14.4 percent medium and only 3.3 percent had high income from both agricultural and non-agricultural source. The results also show that 88.9 percent of the respondents participate in training program on ICTs and they had a medium contact (58.9%) with different information sources followed by 40.0 percent had low contact and only 1.1 percent had high contact with different extension source.
Appropriateness of Information:
Table 2: Appropriateness of Information Perceived by Farmers (n=90)
Items
Response Most
appropriate Appropriate
Less appropriate
No % No % No %
Question and answering service 13 14.4 28 31.1 49 54.4
Market Information 25 27.8 34 37.8 31 34.4
Input service and availability 34 37.8 34 37.8 22 24.4
Information on different
agricultural program 07 7.8 31 34.4 52 57.8
General agricultural news 14 15.6 30 33.3 46 51.1
Post-harvest technology 02 2.2 28 31.1 60 66.7
Different agricultural program
on TV 21 23.3 43 47.8 26 28.9
Information on input service and availability like sources of quality seed, fertilizer or different farm machineries etc. were considered most appropriate information by majority (37.8%) of the respondents while about the same percentage of respondents (37.8%) rated it as appropriate. Looking forward to the importance of different inputs on improved agricultural production and management practices farmers felt that information regarding input service and their availability was most appropriate and appropriate information perceived through ICTs.
The information relating to post-harvest technology was perceived as less appropriate by majority (66.7%) of the farmers. Giving due consideration to importance on market information, including daily updates on the prices of agricultural commodities in the local markets a sizeable portion (27.8%) of sample of farmers perceived “market information” as most appropriate information for their farming.
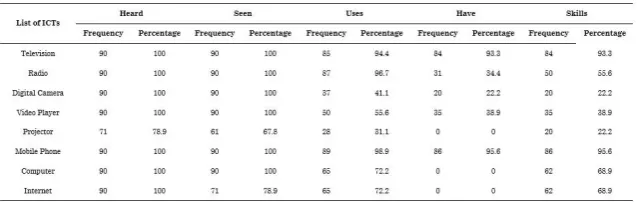
Table 3: Distribution of Farmers on The Basis of Awareness on Various ICT Tools
Result in Table 3 shows that all of the farmers had heard of television while all of them had seen television. Also majority (84%) had television set while all had used a television set. Furthermore, 84.0% of the farmers had skills on how to operate television set. However, all of the farmers had heard of Radio while all had seen Radio. Furthermore, 87.0% farmers used Radio while 31.0% had Radio and 55.6% of the farmers had skill on how to operate Radio. Result on Table 3 also revealed that all of the farmers had heard and seen digital camera while only 41.1% had used digital camera, 22.2% had digital camera and the same percent farmers had the skill to operate the digital camera.
their household. That’s why they need to depend on the ICT hub for their necessary information. From training program arranging by the project authority of ICT hub they (68.9%) had the skills on how to use internet and collect necessary information.
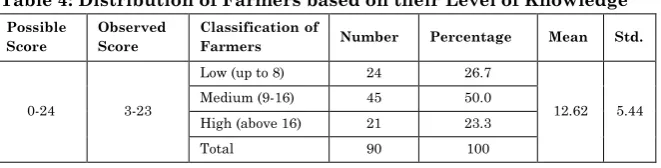
Knowledge of Farmers on ICTs
The possible knowledge score of farmers on ICTs could range from 0-24, where 0 indicating no knowledge of farmers on ICTs and 24 indicating high knowledge of farmers on ICTs. The computed knowledge scores of the respondents ranged from 3-23 with a mean and standard deviation of 12.62 and 5.44 respectively. Based on the observed scores the distributions of the respondents have been presented in Table 4.
Table 4: Distribution of Farmers based on their Level of Knowledge Possible
Score
Observed Score
Classification of
Farmers Number Percentage Mean Std.
0-24 3-23
Low (up to 8) 24 26.7
12.62 5.44
Medium (9-16) 45 50.0
High (above 16) 21 23.3
Total 90 100
Information presented in the table 4 leads to illustrate that half of the respondents (50.0%) belongs to medium category i.e. they had medium level of knowledge on ICTs while 26.7% and 23.3% had low and high level of knowledge respectively. Thus, the findings indicate that proper training program should be arranged to enrich the level of knowledge of the farmers regarding the use of different ICTs.
Constraints Faced by the Farmers associated with ICT application:
having a clear understanding of the problems faced by the farmers 10 problems were selected through pre-testing with the farmers. Problems faced by the farmers which were identified in the project study areas which are presented below in table.
Table 5: Constraints faced by the farmers associated with ICT application
Constraints
Extent of Constraints
Severe (3) Moderate (2)
Low (1)
Not at
all (0) Mean
Rank Order Unavailability of
electricity 49 30 03 08 2.33 1
Lack of knowledge on
ICT 32 40 11 07 2.08 2
Insufficient availability of ICT service to rural farmers
35 30 16 09 2.01 3
Lack of training on
specific aspects 31 38 10 11 1.99 4
Complex process on
specific aspects 14 34 13 29 1.37 5.5
Affiliation of the farmers in less important topics
11 35 20 24 1.37 5.5
Less technical
support from experts 13 29 19 29 1.29 7
Selling small amounts of products in the market
12 28 17 33 1.21 8
Biasness in enlisting farmers name for training
06 38 11 35 1.17 9
Social barrier of
using internet 07 26 26 31 1.00 10
value shows 2.08 and 2.01 respectively. Similarly the constraints such as “lack of training on specific aspects”, “Complex process on specific aspects”, “Affiliation of the farmers in less important topics”, “Less technical support from experts” are also one of the problems associated with ICTs application in Agriculture and its mean value shows 1.99. 1, 37, 1.37 and 1.29 respectively. Further the problem such as “Selling small amount of product”, “Biasness in enlisting farmers name for training” and “Social barrier of using internet” affect the accessing of ICTs application of farmers and ranked from eight to ten positions respectively under study.
Attitude of Farmers towards ICTs
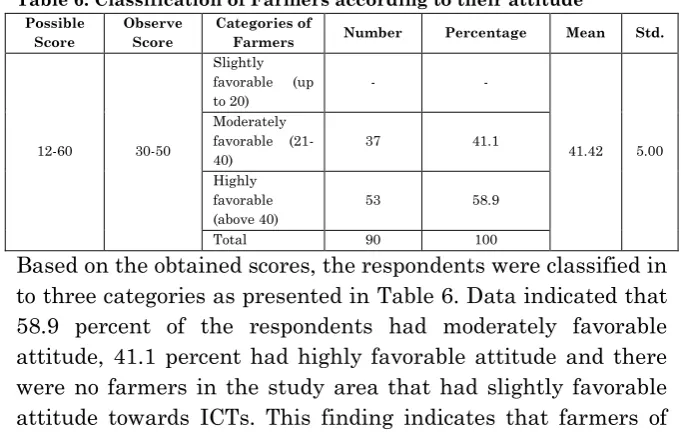
The possible attitude score of farmers towards ICT could range from 12-60, 12 indicating highly unfavorable attitude and 60 indicating highly favorable attitude. The computed attitude scores of the pond owners range from 30-50, the mean being 41.42 with a standard deviation of 5.00.
Table 6: Classification of Farmers according to their attitude Possible
Score
Observe Score
Categories of
Farmers Number Percentage Mean Std.
12-60 30-50
Slightly favorable (up to 20)
- -
41.42 5.00
Moderately favorable (21-40)
37 41.1
Highly favorable (above 40)
53 58.9
Total 90 100
that area were enthusiastic to perceive different ICTs tools to get their required information.
Factors Affecting Farmers’ Attitude on ICTs:
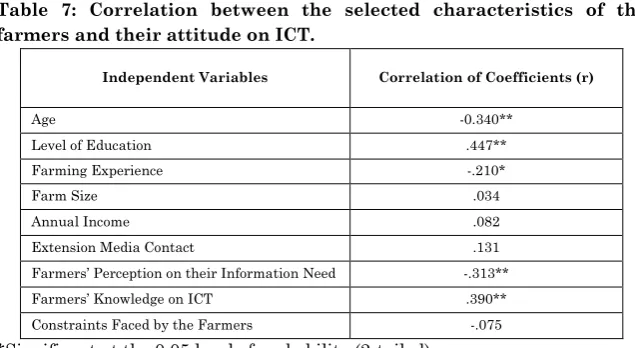
The correlation analysis presented in Table 7 further shows that age of the respondents, level of education, farming experience, farmers perception on their information need and farmers’ knowledge were found to be the potential factors of enhancing their attitude towards ICTs.
Table 7: Correlation between the selected characteristics of the farmers and their attitude on ICT.
Independent Variables Correlation of Coefficients (r)
Age -0.340**
Level of Education .447**
Farming Experience -.210*
Farm Size .034
Annual Income .082
Extension Media Contact .131
Farmers’ Perception on their Information Need -.313**
Farmers’ Knowledge on ICT .390**
Constraints Faced by the Farmers -.075
*Significant at the 0.05 level of probability (2-tailed) ** Significant at the 0.01 level of probability (2-tailed)
and attitude of farmers on ICT use. Farmers’ perception on their information need showed a negative significant relationship with the attitude of farmers on ICT based farming. Similar to the finding of Dhaka (2010) a positive significant relationship was found between level of education of farmers and their attitude on ICT based farming. This may be due to the fact that education changes the human behavior and using of different ICT tools are difficult for illiterate people. Finally, a significant positive relationship was found between farmers knowledge on ICT and their attitude on ICT based farming. Ajayi (2013) also found the same result in his study. This is to say that farmers attitude on ICT based farming are most likely to be positive if their level of knowledge are found satisfactory and relevant to their need.
Conclusion and Recommendation
The study revealed that the average age of the farmers in the study areas is 33.31 and most of the respondents were young aged. This established that farmers are still in their active years and can still cope with the different ICT tools.
Based on the results obtained it can be concluded that farmers of the study areas have a moderately favorable attitude and the most important finding is that there are no farmers in the study areas who less or slightly favorable attitude towards ICT based farming, Besides this, the findings of the study also revealed that majority of the farmers (54.4%) had secondary education and education is responsible for their favorable attitude towards ICT based farming. Therefore, this finding will enhance the future development of ICT tools use for getting extension service delivery in the study areas and government should take proper steps to make these areas as a potential ICT based farming zone.
different inputs service and their availability were considered most important information by majority (37.8%) of the respondents and information on post-harvest technology was perceived as less appropriate by majority (66.7%) of the respondents. Therefore, further research may be conducted to explore why other information seems less appropriate to the farmers that they are getting through different ICT tools.
The study revealed that half of the respondents (50.0%) had medium level of knowledge on ICTs. Researcher and policy makers should take initiative so that their level of knowledge will increase.
REFERENCES
Ajayi, A. O., Alabi, O. S. and Akinsola, T. O. 2013, “Knowledge and perception of extension agents on Information and Communication Technologies (ICTs) use in extension service delivery in Ondo state, Nigeria”, African Journal of Agricultural Research, Vol. 8(48), pp. 6226-6233. Aker, J. C. 2010. Dial ‘A’ for Agriculture: Using Information
and Communication Technologies for Agricultural Extension in Developing Countries. Tuft University, Economics Department and Fletcher School, Medford MA02155.
Anandajayasekeram, P., Puskur, R., Workneh, S. and Hoekstra, D. 2008. Concepts and practices in Agricultural extension in Developing countries: A source book. IFPRI (International Food Policy Research Institute), Washington, DC, USA, and ILRI (International Livestock Research Institute), Nairobi, Kenya. p. 275. Anderson, J. R. and Feder, G. 2004. Agricultural extension:
Good intentions and hard realities, The World Bank Research Observer, 19(1):41-60.
Bayes, A. 2001, “Infrastructural and rural development: insights from a Grameen Bank village phone initiative in Bangladesh”, Agricultural Economics, Vol. 25, pp. 261-272.
Chapman, R., Slaymaker, T. and Young, J. 2004. Livelihoods Approaches to Information and Communication in Support of Rural Poverty Elimination and Food Security. Overseas Development Institute, UK Department of International Development and Food and Agricultural Organization.
Dhaka, B. L. and Chayal, K. 2010, “Farmers’ experience with ICTs on transfer of technology in changing Agri-rural environment”, Indian Research Journal of Extension Education, Vol. 10(3), pp. 114-118.
Food and Agriculture Organization of the United Nations. 2004. Institute building to strengthen agricultural extension. 27th FAO regional conference for Asia and the pacific Beijing, china, May, 17th– 21st.
James, J. 2004, “Reconstructing the digital divide from the perspective of a large, poor, developing country”, Journal of Information Technology, Vol. 19, pp. 172-177.
Jones Gwyn E. 1997. The history, development and future of Agricultural Extension in improving Agricultural Extension – A reference manual by Burton E Swanson et al., FAO, Rome.
Jones, G.E. 1997. The history, development and the future of agricultural extension. In: B. E. Swanson, R .P. Bentz, and A.J. Sofranko (Eds), Improving agricultural extension – a reference manual. Rome: FAO.
Kiplang’at, J. 1999. “An analysis of the opportunities for information technology in improving access, transfer and the use of agricultural information in the rural areas in Kenya”, Library Management, Vol. 20, No 2, pp 115-127. Lio, M. and Liu, M. 2006. “ICT and agricultural productivity: evidence from cross-country data”, Agricultural Economics, Vol. 34, pp. 221-228.
Luarn, P. and H. Lin, 2004. Towards an understanding of the behavioral intention to use mobile banking. Journal of Computing Human Behavior, 30: 1-9. DOI: 10.1016/j.chb.2004.03.003
World Congress Conference, Proceedings of the 24-26 July 2006 (Orlando, Florida USA) Publication.
McNamara, K. 2009. Improving Agricultural Productivity and Markets: The Role of Information and Communication Technologies. Agriculture and Rural Development Notes, Issue 47, April, The World Bank, Washington DC..
Mruthunjaya and Adhiguru, A. 2005. ICT for livelihood security: a reality check. Mainstreaming ICTs, II (2):14-18.
NAEP, 1996. New Agricultural extension Policy, Govt. of the People’s Republic of Bangladesh, Ministry of Agriculture. P-8.
Richardson, D. 1997. The Internet and Rural and Agricultural Development: An Integrated Approach. Rome: FAO. Shih, H. P. 2004. Extended technology acceptance model of
internet utilization behavior. Journal of Information
Management, 41: 719-729. DOI:
10.1016/j.im.2003.08.009,
Shiro, U. 2008. A case study of DIY ICT. Journal of Information
Management, 10: 46-60. DOI:
10.1108/14636690810887535.
Silva, D. Harsha and Dimuthu R. 2008, 'Using ICT to reduce transaction costs in agriculture through better communication: A case-study from Sri Lanka', mimeo, 20.
Todaro, M. P. 2000. Economic Development. Addison Wesley Longman Inc. 1st Edition, pp. 363-375. Kiplang’at, J. (1999), “An analysis of the opportunities for information technology in improving access, transfer and the use of agricultural information in the rural areas in Kenya”, Library Management, Vol. 20, No 2, pp 115-127.
WSIS, 2003. World Summit on the Information Society, Geneva
2003 – Tunis 2005, Plan of
Action.Paragraph21.http://www.itu.int/dms_pub/itus/md /03/wsis/doc/S03-WSIS-DOC 0005!!PDF-E.pdf