Scholarship@Western
Scholarship@Western
Electronic Thesis and Dissertation Repository
8-4-2017 12:00 AM
A Diffusion Tensor Imaging Study of Motor Fibre Path Integrity
A Diffusion Tensor Imaging Study of Motor Fibre Path Integrity
and Overt Responsiveness in Disorders of Consciousness
and Overt Responsiveness in Disorders of Consciousness
Clara A. Stafford
The University of Western Ontario
Supervisor Dr. Adrian Owen
The University of Western Ontario Graduate Program in Psychology
A thesis submitted in partial fulfillment of the requirements for the degree in Master of Science © Clara A. Stafford 2017
Follow this and additional works at: https://ir.lib.uwo.ca/etd
Part of the Biological Psychology Commons, Cognitive Neuroscience Commons, Nervous System Commons, and the Trauma Commons
Recommended Citation Recommended Citation
Stafford, Clara A., "A Diffusion Tensor Imaging Study of Motor Fibre Path Integrity and Overt
Responsiveness in Disorders of Consciousness" (2017). Electronic Thesis and Dissertation Repository. 4699.
https://ir.lib.uwo.ca/etd/4699
This Dissertation/Thesis is brought to you for free and open access by Scholarship@Western. It has been accepted for inclusion in Electronic Thesis and Dissertation Repository by an authorized administrator of
i
This study investigated the relationship between motor thalamo-cortico-cerebellar fibre path
integrity and overt responsiveness in patients with disorders of consciousness (DOC).
Additionally, we investigated the potential of imaging these motor tracts at ultra-high fields.
Study I and II aimed to map the white matter connections of motor execution fibres in DOC
patients. Our results showed significant reductions in motor fibre path integrity across DOC
diagnostic categories. Study III and IV aimed to develop a 7T MRI Diffusion Tensor
Imaging (DTI) sequence. We optimized this sequence to image motor fibre paths in DOC
patients. We concluded that, in healthy controls, probabilistic tractography of these tracts at
ultra-high fields was superior to tractography at lower magnetic fields. Further investigation
is needed to determine the advantages of imaging these motor tracts at ultra-high fields in
patients with disorders of consciousness.
Keywords
Disorders of consciousness, Vegetative state, Minimally conscious state, Diffusion tensor
imaging, Magnetic resonance imaging, 7T MRI, Magnetic resonance imaging at ultra-high
ii
Acknowledgments
I would like to thank my supervisor, Dr. Adrian Owen, for his expertise, guidance and the
many opportunities he has afforded me to share my research abroad and learn from the
scientific community outside Western University. I would also like to thank my
co-supervisor, Dr. Davinia Fernández-Espejo, for her unwavering support, patience for my
constant questions and encouragement throughout my degree. She is a brilliant scientist who
listened to my ideas (regardless of how good they were), pushed me to think critically and
fueled my passion for science. Without Dr. Owen and Dr. Fernández-Espejo, I would not
have enjoyed sharing the work I have accomplished and I am eternally grateful for their trust,
candor and knowledge.
I would also like to thank Dawn Pavich and Haitao Yang. Without their help, I would not
have had access to the technical tools required to complete my research. Acquiring and
processing my thesis data would have been much more difficult and time consuming if not
for their dedication and resourcefulness. I am also grateful to Joe Gati and Trevor Szekeres
from Robarts Research Institute, who helped in the development of the diffusion tensor
imaging sequences used in my thesis as well as acquired the structural images for my study.
No matter the start time or length of my scanning sessions, Joe and Trevor were always
positive, accommodating, and ever so patient with me when I was still learning about MR
imaging and pestered them with questions and concerns. Without them, I would not have a
thesis to share and I will be eternally grateful for all I have learned from their expertise.
Finally, I would like to thank my family: my mother Lynn Mailloux, my sister Ella Stafford
and my step-father Jean-Guy Simonato. This degree belongs to them, as I would not be
completing my master’s without their support. From the start, they believed I could
accomplish anything I set my mind to, and each in their own way raised my ambitions
beyond my imagination. I would not be the scientist I am today if they had not ignited my
dedication and aspirations. Special thanks to Kabir Daljeet for his emotional support
iii
Table of Contents
Abstract ... i
Acknowledgments ... ii
Table of Contents ... iii
List of Tables... vii
List of Figures ... viii
List of Appendices ... xi
Chapter 1 ... 1
1. Introduction ... 1
1.1 Consciousness ... 1
1.2 Disorders of consciousness ... 1
1.2.1 Coma ... 2
1.2.2 The vegetative state... 3
1.2.3 The minimally conscious state ... 3
1.3 Diagnosing disorders of consciousness ... 4
1.3.1 Diagnostic challenges in DOC ... 6
1.3.2 Covert Awareness ... 8
1.4 Diffusion Tensor Imaging in DOC patients ... 10
1.4.1 What is Diffusion Tensor Imaging? ... 10
1.4.2 Diffusion imaging in the context of severe brain injury ... 12
1.5 Diffusion tensor imaging at ultra-high magnetic field strengths ... 14
1.6 The present study ... 15
1.6.1 Rationale ... 15
1.6.2 Objectives and Hypotheses ... 18
iv
2. Generic Methods ... 20
2.1.1 DTI Data Analysis ... 20
2.1.2 Mask Generation ... 20
2.1.3 Probabilistic Fibre Tracking ... 24
Chapter 3 ... 26
3. Study I – Investigating the relationship between overt behavioural responses and fibre integrity of VL-M1 tracts in patients with disorders of consciousness. ... 26
3.1 Materials and Methods ... 27
3.1.1 Participants ... 27
3.1.2 MRI Acquisition ... 28
3.1.3 Statistical Analyses ... 29
3.2 Results ... 30
3.2.1 Normality testing ... 30
3.2.2 Difference between DOC patients and healthy controls ... 30
3.2.3 Differences within DOC patients ... 31
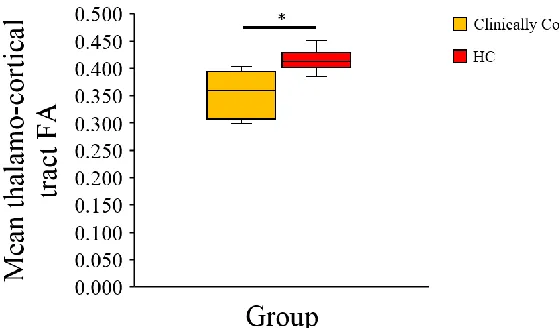
3.2.4 Difference between clinically conscious and clinically unconscious patients ... 32
3.2.5 Differences between clinically conscious patients and healthy controls .. 32
3.2.6 Differences between clinically unconscious patients and healthy controls ... 33
3.2.7 Differences between behaviourally responsive and non-responsive patients ... 34
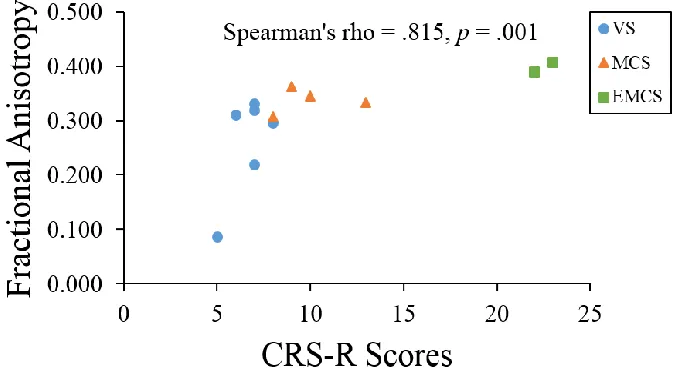
3.2.8 Correlation between fibre tract FA values and CRS-R scores ... 34
3.3 Discussion ... 35
Chapter 4 ... 38
4. Study II – Investigating the relationship between overt behavioural responses and motor loop fibre integrity in patients with disorders of consciousness. ... 38
v
4.1.1 Participants ... 39
4.1.2 Clinical Descriptions ... 39
4.1.3 MRI Acquisition ... 43
4.1.4 Statistical Analyses ... 43
4.2 Results ... 45
4.2.1 Differences between VS patients and healthy controls ... 45
4.2.2 Differences between MCS/EMCS patients and healthy controls ... 45
4.2.3 Correlation between fibre tract FA values and CRS-R scores ... 47
4.3 Discussion ... 49
Chapter 5 ... 54
5. Study III - Assessment of different diffusion tensor acquisition protocols at ultra-high fields... 54
5.1 Materials and Methods ... 57
5.1.1 Participants ... 57
5.1.2 MRI Acquisitions ... 57
5.2 Results ... 58
5.2.1 VL-M1 streamlines ... 58
5.2.2 M1-DN streamlines ... 59
5.2.3 VL-DN streamlines ... 61
5.3 Discussion ... 62
Chapter 6 ... 64
6. Study IV – Comparison of DTI streamlines and metrics at 3T and 7T MRI... 64
6.1 Materials and Methods ... 64
6.1.1 Participants ... 64
6.1.2 MRI Acquisitions ... 65
vi
6.2 Results ... 66
6.2.1 Probabilistic tractography of motor tracts of interest ... 66
6.2.2 Differences in fractional anisotropy ... 67
6.2.3 Differences in mean diffusivity ... 70
6.2.4 Differences in volume ... 71
6.2.5 Percentage overlap in ROI placement ... 72
6.2.6 Percentage overlap in reconstructed fibre tracts ... 73
6.3 Discussion ... 74
Chapter 7 ... 80
7. General Discussion ... 80
References ... 84
Appendices ... 104
vii
List of Tables
Table 1: CRS-R subscales, behavioural items and diagnostic criteria ... 6
Table 2: Description of pairs of tractography ROIs ... 25
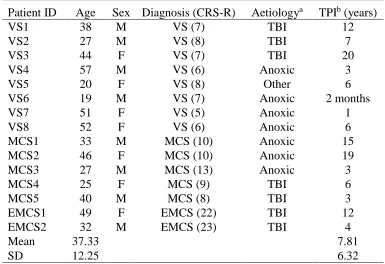
Table 3: Patient demographic and clinical information ... 28
Table 4: Patient demographic and clinical information ... 40
Table 5: Patient behavioural features from the CRS-R ... 42
Table 6: Healthy controls’ fibre tracts FA means and standard deviations and individual patient's fibre tract FA values ... 44
Table 7: P-values, point estimates and effect sizes of patient FA values ... 46
Table 8: Paired sample t-tests of mean fibre tract and global FA between scanners (raw scores) ... 68
Table 9: Paired sample t-tests of mean fibre tract and global FA between scanners (ratios) . 69 Table 10: Paired sample t-tests of mean fibre tract MD between scanners ... 70
viii
List of Figures
Figure 1: Adapted from Laureys (2005). Figure illustrating the linear and positive
relationship between awareness and arousal during sleep stages (purple) with extremes cases
of coma illustrated in orange and dissociated states of consciousness in red. ... 2
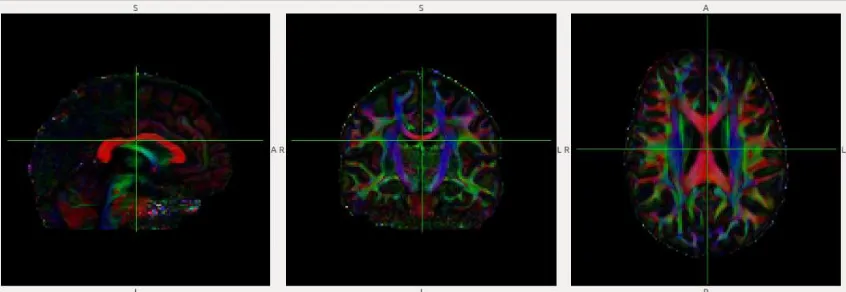
Figure 2: Principal eigenvector colour map (from pilot participant in Study III). Leftmost
panel: sagittal view; Middle panel: Coronal view; Rightmost panel: axial view. Red: WM
fibre from left-right; Green: WM fibres from rostral-caudal; Blue: WM fibres from
superior-inferior... 11
Figure 3: Axial view of cortical center voxels (blue) and spherical primary motor cortex
masks (yellow) in standard MNI152 space (Panel A); Axial view of unwarped primary motor
cortex masks in native space of a healthy control (Panel B). Central sulci are outlined in red.
... 21
Figure 4: Axial view of anterior commissure circled in Panel A; axial view of thalamic center
voxels (blue) and ventrolateral thalamic nuclei masks (yellow) placed dorsal to the anterior
commissure (Panel B). ... 22
Figure 5: Axial view of Vermis X of the cerebellum protruding into the fourth ventricle
circled in red in Panel A; axial view of cerebellar center voxels (blue) and cerebellar dentate
nuclei masks (yellow; Panel B)... 23
Figure 6: Graphic representation of medians, maximum, minimums and quartiles (25th &
75th) of DOC patients and healthy controls. ... 31
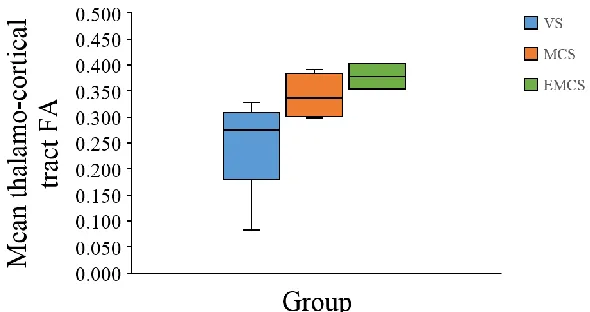
Figure 7: Graphic representation of medians, maximums, minimums and quartiles (25th &
75th) of VS, MCS and EMCS patients. ... 31
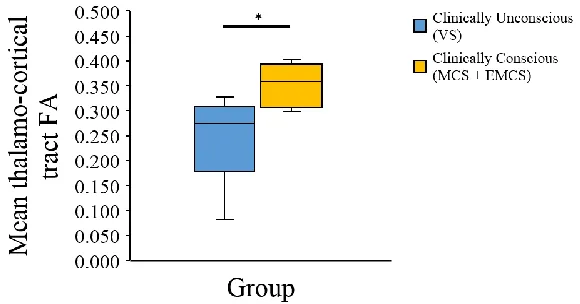
Figure 8: Graphic representation of medians, maximums, minimums and quartiles (25th &
75th) of clinically conscious and clinically unconscious patients. ... 32
Figure 9: Graphic representation of medians, maximums, minimums and quartiles (25th &
ix
Figure 10: Graphic representation of medians, maximums, minimums and quartiles (25th &
75th) of clinically unconscious patients and healthy controls. ... 33
Figure 11: Graphic representation of medians, maximums, minimums and quartiles (25th &
75th) of behaviourally non-responsive and behaviourally responsive patients. ... 34
Figure 12: Spearman correlation between the left VL-M1 tract fractional anisotropy values
and CRS-R scores in 12 DOC patients. ... 35
Figure 13: Spearman correlation between the right VL-M1 tract fractional anisotropy values
and CRS-R scores in 12 DOC patients. ... 35
Figure 14: Raw fractional anisotropy score of each DOC patient and controls for each motor
fibre path. ... 47
Figure 15: Significant spearman correlations of CRS-R scores and fibre tract FA values for
DOC patients. Panel A: left M1 tract, n = 5; B: left M1-DN tract, n = 5; Panel C: left
VL-DN tract, n = 6. ... 48
Figure 16: Anatomical accuracy of three 7T VL-M1 streamlines. 65 directions protocol in
yellow, 137 directions protocol in light blue and 139 directions protocol in burgundy. Panel
A: internal capsule (z = 38); Panel B: anterior thalamic radiations (z = 45); Panel C: corona
radiata (z = 55); Panel D: primary motor cortices (z = 69) with central sulci in orange. ... 59
Figure 17: VL-M1 streamline reconstructions in MNI152 standard space, anterior view.
Panel A: 65 directions protocol; Panel B: 137 directions protocol; Panel C: 139 directions
protocol. Streamlines in blue, target masks in red. ... 59
Figure 18: Anatomical accuracy of three 7T M1-DN streamlines. 65 directions protocol in
yellow, 137 directions protocol in light blue and 139 directions protocol in burgundy. Panel
A: dentate nuclei (z = 16); Panel B: where 139 directions crosses through corpus callosum (z
= 44); Panel C: corona radiata (z = 55); Panel D: primary motor cortices (z = 69) with central
x
Figure 19: M1-DN streamline reconstructions in MNI152 standard space, posterior view.
Panel A: 65 directions protocol; Panel B: 137 directions protocol; Panel C: 139 directions
protocol. Streamlines in blue, target mask in red. ... 61
Figure 20: Anatomical accuracy of three 7T VL-DN streamlines. 65 directions protocol in yellow, 137 directions protocol in light blue and 139 directions protocol in burgundy. Panel A: ventrolateral thalamic nucleus (z = 33); Panel B: crossing into superior cerebellar peduncle (z = 22); Panel C: dentate nucleus. ... 61
Figure 21: VL-DN 7T streamline reconstructions in MNI152 standard space, posterior view. Panel A: 65 directions protocol; Panel B: 137 directions protocol; Panel C: 139 directions protocol. Streamlines in blue, target mask in red. ... 62
Figure 22: Average fibre tract FA value at 3T and 7T. *p < .05. ... 68
Figure 23: Average fibre tract FA ratio at 3T and 7T. *p < .05... 69
Figure 24: Average fibre tract MD value at 3T and 7T. *p < .05. ... 70
Figure 25: Average fibre tract volume at 3T and 7T, *p < .05. ... 71
Figure 26: Average ROI overlap (%) across scanners in T1 anatomical space. VL: ventrolateral nuclei; M1: primary motor cortices; DN: dentate nuclei. ... 72
Figure 27: Average ROI overlap (%) across scanners in MNI152 standard space. VL: ventrolateral nuclei; M1: primary motor cortices; DN: dentate nuclei. ... 73
Figure 28: Average streamline overlap (%) across scanners in T1 anatomical space. VL: ventrolateral nuclei; M1: primary motor cortices; DN: dentate nuclei. ... 73
Figure 29: Average streamline overlap (%) across scanners in MNI152 standard space. VL: ventrolateral nuclei; M1: primary motor cortices; DN: dentate nuclei. ... 74
xi
List of Appendices
Appendix A: 3T diffusion tensor imaging protocols in healthy participants... 104
Appendix B: 7T diffusion tensor imaging protocols in healthy participants ... 110
Appendix C: Ethics approval notice for data collection in patients with disorders of consciousness ... 113
Appendix D: Ethics approval notice for 3T data collection in healthy participants ... 114
Appendix E: Ethics approval notice for 7T data collection in healthy participants ... 115
Appendix F: Letter of information for 3T data collection in healthy participants ... 116
Chapter 1
1. Introduction
1.1
Consciousness
Consciousness is a multifaceted concept that scientists and philosophers alike have tried to
disentangle and define for years. In the scientific literature, it is defined by two main pillars:
arousal and awareness (Laureys, Owen & Schiff, 2004). Arousal is defined as the level of
wakefulness, usually indicated by eye opening and sleep-wake patterns. Sleeping is a state
of low arousal (closed eyes) whilst being awake is a state of high arousal. Arousal is
supported by the brainstem and reticular activating system (Laureys, Boly, Moonen &
Maquet, 2009). Awareness is defined as being cognizant of one’s self, and having the ability to respond to one’s environment (Laureys et al., 2004). The exact cortical systems
supporting awareness are still unknown, however it has been suggested that this pillar of
consciousness depends on the integrity of the cortex and its subcortical projections
(Laureys, 2009). Multiple theories suggest that thalamocortical (Laureys et al., 2000;
Schiff, 2008; Fernández-Espejo et al., 2012) and fronto-parietal mechanisms (Noirhomme
et al. 2010; Jin & Chung 2012; Fernández-Espejo et al. 2012) generate the conscious
experience.
1.2
Disorders of consciousness
In most states, individuals show equal levels of arousal and awareness. For example, in
healthy individuals, the relationship between these two components is positively
correlated across sleep stages (dream activity during REM-sleep being the exception)
from deep sleep to conscious wakefulness. Comatose patients are an extreme version of
this linear and positive relationship: they are unaware because they cannot be awakened.
The logic then follows that one must be awake to be aware (Laureys, 2005). In a few rare
cases, however, wakefulness and arousal can be dissociated. This disconnection appears
in the form of prolonged disorders of consciousness (PDOC), a spectrum of disorders
including the vegetative state (VS) and the minimally conscious state (MCS), where
caused by acute traumatic (e.g. motor vehicle accident) or non-traumatic brain injuries
(e.g. stroke, cardiac arrest) and in rarer cases by degenerative brain disorders or
congenital malformations of the nervous system (Multi-Society Task Force on PVS,
1994).
1.2.1
Coma
The comatose state is characterized by an absence of arousal and an absence of
awareness. These patients lie with their eyes closed and show no volitional or reflexive
behaviours, even after deep noxious stimuli (Posner, Saper, Schiff, & Plum, 2007). To be
diagnosed as comatose, patients must be in this state for at least 60 minutes. Coma is
typically a time-limited condition: after two to four weeks, patients either slowly recover
arousal and awareness, progress into the vegetative state or are diagnosed as brain dead.
In some cases, some patients do not recover arousal or awareness but also do not show
signs of brain death, as they fall into a state of chronic coma. This, however, is an
extremely rare condition (Di Perri et al., 2014; Monti, 2012; Schnakers, Majerus, &
Laureys, 2004). Positron emission tomography (PET) scans reveal that global grey REM Sleep Deep Sleep Light Sleep Drowsiness Conscious Awareness Coma General Anesthesia
Sleepwalking; Complex partial & absence seizures; Vegetative
state A w ar ene ss Wakefulness
Figure 1: Adapted from Laureys (2005). Figure illustrating the linear and positive relationship between
awareness and arousal during sleep stages (purple) with extremes cases of coma illustrated in orange and
matter glucose metoblism is reduced by 50-70% in coma patients who suffered a
traumatic or ischemic brain injury. In patients who suffered anoxic injuries, their global
glucose metabolism can be reduced up to 75% of the normal range. (Laureys et al., 2004;
Schnakers et al., 2004; Laureys et al., 2009).
1.2.2
The vegetative state
The vegetative state, also sometimes referred to as “unresponsive wakefulness state”
(UWS), was first described by Jennett and Plum in 1972. This state is characterized by a
normal circadian rhythm and the presence of sleep-wake cycles indicated by spontaneous
periods of eye-opening and closing. Behaviourally, these patients show reflexive trunk
and limb movements and may respond to noxious stimuli with flexor withdrawal or
grimacing (Jennett & Plum, 1972; Jennett, 2002) however they show no sustained signs
of awareness. In other words, none of their behaviours are volitional or consistently
generated by/directed towards their environment. The VS is declared as permanent
contingent on two factors: i) the type of acute injury sustained and ii) the length of the
VS. For individuals who sustained a traumatic brain injury (TBI), the VS is declared
permanent after 12 months. For non-traumatic brain injuries (anoxic or hypoxic), the VS
is declared permanent after 3 months (Multi-Society Task Force on PVS, 1994; Giacino,
2004). PET scans of VS patients reveal a reduction of approximately 40% of global
cortical metabolism. Although this metabolic reduction is similar to the reduction seen in
coma patients, VS patients show close to normal metabolic function in the brainstem,
which explains their preserved basic nervous functions (i.e. sleep-wake cycles,
thermoregulation, respiration) (Laureys, Faymonville, & Maquet, 2002; Laureys, 2009;
Monti, 2012).
1.2.3
The minimally conscious state
The minimally conscious state is characterized again by normal levels of arousal but
contrary to the VS, MCS patients show reproducible signs of awareness. Behaviourally
this is usually presented in the form of visual pursuit, low-level responses with gestures
and verbalizations or even simple command-following (Giacino et al., 2002; Schnakers et
although they are able to demonstrate reproducible signs of awareness, these behaviours
fluctuate greatly and are often followed by prolonged periods of unresponsiveness. The
criteria for an MCS diagnosis requires that these behaviours be contingent on
environmental triggers, for example crying in response to a noxious stimulus or object
reaching (Giacino et al., 2002; Schnakers, Giacino, & Laureys, 2010). One of the earliest
signs of progression into the MCS and recovery of consciousness is visual pursuit
(Giacino & Kalmar, 2005; Vanhaudenhuyse et al., 2007). PET scans of MCS patients
show a reduction of cortical metabolism of 20-40% (Schnakers et al., 2004). Despite
prognosis being more favourable for MCS patients, some of these patients can remain in
the minimally conscious state for prolonged periods of time, without fully recovering
(Giacino & Kalmar, 1997; Schnakers & Majerus, 2012).
1.3
Diagnosing disorders of consciousness
Determining if patients with disorders of consciousness are awake is quite simple. VS
and MCS patients have preserved reticular activating systems and thus display
behavioural sleep-wake patterns through periods of eye-opening and closing. A valid
assumption would be that if one’s eyes are open, they are awake. Another way of
detecting arousal in these patients is with electroencephalography (EEG). Different stages
of arousal are marked by different cortical electrical patterns, which can easily be
detected using this technique. EEG has been shown to be able to detect sleep-like patterns
in these patients (Cologan & Schabus, 2012; de Biase et al., 2014). Across the spectrum,
DOC patients show similar levels of arousal but differ on their level of awareness. In
other words, patients higher on the DOC spectrum show more signs of awareness through
reproducible, volitional behaviours. One way to measure these behaviours, and thus
having a measure of the patient’s level of awareness, is to ask these patients to produce
observable responses to certain stimuli.
Command following is considered a reliable measure for differentiating VS and MCS
patients because it is expected that a patient who retains awareness has the volition to
respond to these commands (such as an MCS patient) whereas a patient who does not
respond to command retains no awareness. A patient’s level of awareness cannot yet be
about levels of awareness based on the presence or absence of behaviours. Many bedside
behavioural systems have been developed to quantify and standardize the assessment of
awareness in DOC patients (Majerus, Gill-Thwaites, Andrews & Laureys, 2005;
Schnakers et al., 2008). Some scales have been developed to assess consciousness within
the first few hours of the injury, whilst others are more sensitive to changes in
consciousness over time. One thing they do have in common is that these scales will be
composed of subscales, which assess different behaviours from different modalities,
ranging from low-level reflexive movements to high-level command following and
communication.
The Coma Recovery Scale – Revised (CRS-R; Giacino, Kalmar & Whyte, 2004) is often
considered the gold-standard for behavioural assessments of DOC patients because it
does not require formal training from the authors, it is free and it encompasses multiple
facets of behaviours for these patients (Giacino & al., 2004). The assessment is
comprised of six subscales: Auditory Function Scale, Visual Function Scale, Motor
Function Scale, Oromotor/Verbal Function Scale, Communication Scale and the Arousal
Scale. In total, there are 23 items to measure these six facets of behavior; these items are
organized in a hierarchical manner where the lowest items indicate reflexive movements
and high items denote cognitively-mediated behaviours (Kalmar & Giacino, 2005). The
total score on the CRS-R dictates diagnosis. However, there are certain items (i.e.
behaviours) that determine diagnosis regardless of the patient’s performance in other
categories. The CRS-R is usually the tool of choice because although it is a bit more time
consuming than other assessments, the CRS-R has demonstrated high agreement between
raters and in the same rater over time, showing that raters are able to accurately
distinguish between VS, MCS and emergence from MCS (EMCS; Giacino et al., 2004;
Kalmar & Giacino, 2005). The increased sensitivity of this scale to detecting MCS
patients makes it the most efficient behavioural tool to date for differential diagnosis
(Kalmar & Giacino, 2005). The CRS-R subscales and items are outlined in Table 1, along
Table 1: CRS-R subscales, behavioural items and diagnostic criteria
Scale Score Diagnosis
Auditory Function Scale
Consistent Movement to Command 4 MCS
Reproducible Movement to Command 3 MCS
Localization to Sound 2 VS
Auditory Startle 1 VS
None 0 VS
Visual Function Scale
Object Recognition 5 MCS
Object Localization: Reaching 4 MCS
Visual Pursuit 3 MCS
Fixation 2 MCS
Visual Startle 1 VS
None 0 VS
Motor Function Scale
Functional Object Use 6 EMCS
Automatic Motor Response 5 MCS
Object Manipulation 4 MCS
Localization to Noxious Stimulation 3 MCS
Flexion Withdrawal 2 VS
Abnormal Posturing 1 VS
None/Flaccid 0 VS
Oromotor/Verbal Function Scale
Intelligible Verbalization 3 MCS
Vocalization/Oral Movement 2 VS
Oral Reflexive Movement 1 VS
None 0 VS
Communication Scale
Functional: Accurate 2 EMCS
Non-Functional: Intentional 1 MCS
None 0 VS
Arousal Scale
Attention 3 MCS
Eye opening w/o Stimulation 2 VS
Eye opening w/ Stimulation 1 VS
Unarousable 0 VS
Adapted from Giacino et al., 2004; Kalmar & Giacino, 2005. VS = vegetative state; MCS = minimally conscious state; EMCS = Emergence from MCS
1.3.1
Diagnostic challenges in DOC
As previously discussed, differential diagnosis of vegetative state and minimally
awareness. Behavioural scales, like the CRS-R, are the tools of choice for clinicians,
however, there are many challenges associated with their sensitivity and specificity.
Retrospective studies have identified several cases of misdiagnosed VS patients, after
using behavioural tests. In 1993, Childs et al., found that 37% of their DOC sample (18
out of 44 VS patients) were diagnosed as VS after clinical consensus when in fact they
were MCS (Childs, Mercer & Childs, 1993). Similar findings were reported by Andrews
et al. (1996) where 43% of their patient group (17 out 40 patients) were misdiagnosed
with standard behavioural assessments (Andrews et al., 1996). A more recent study, by
Schnakers et al. (2009), used the CRS-R as their diagnostic tool and reported a
misdiagnosis rate of 41% (18 out of 44 patients).
Often not considered during these assessments are the external factors that may affect
these bedside tests. As previously mentioned, patients in the VS often display an array of
spontaneous and reflexive movements. The subjective nature of classifying a vocalization
or an eyeblink as reflexive or intentional can affect the final diagnosis (Guldenmund et
al., 2012). Furthermore, any comorbid impairments resulting from the aetiology of the
injury (e.g. blindness/deafness, motor impairments, seizures) can directly affect a
patient’s performance while under behavioural assessment (Guldenmund et al., 2012). The rapid and unpredictable shifts in patients’ levels of arousal and awareness may also
mislead the assessment of true levels of awareness. These behavioural assessments only
capture a fraction of a patient’s day. As such, if the assessment co-occurs with a period of
fatigue or low awareness, misinterpretation of the patient’s true capabilities can skew the
scores (Guldenmund et al., 2012).
These issues of misdiagnosis, and the confounding variables associated with them, have
important implications for this clinical population. The final diagnosis will often
determine a patient’s prognosis, future care and legal rights. Accuracy in differential
diagnosis is paramount, particularly for VS patients, as the diagnosis may serve to help
1.3.2
Covert Awareness
Behavioural assessments of consciousness are useful for differential diagnosis, prognosis
and decisions about patient treatment plan. However, an inherent flaw in these tests is
that they only tell one side of the consciousness story: the observer’s side. To gain a full
perspective on the disconnection between arousal and awareness, we also need to tell the
experiencer’s story. Studies using neuroimaging techniques such as functional magnetic
resonance imaging (fMRI) and EEG have contested the assumption that patients who
exhibit no overt behavioural signs of command following should be classified as unaware
(Fernández-Espejo & Owen, 2013; Owen et al., 2006). A subgroup of patients has been
shown to demonstrate no behavioural evidence of consciousness (i.e. are behaviourally
indistinguishable from VS patients) however, when they are subject to neuroimaging
paradigms, they show signs of retained or residual awareness. These patients are often
referred to as ‘covertly aware’. (Fernández-Espejo & Owen, 2013). This subgroup of
patients was first identified by Owen et al. (2006), when they used fMRI to study a
patient behaviourally diagnosed as VS. They used two mental imagery tasks to assess if
she had any pockets of preserved awareness. The first task, a motor imagery task,
required the patient to imagine herself playing tennis (i.e. moving her arm back and forth
as if hitting the ball) and the second task required the patient to perform spatial
navigation on command. That is to say, the patient was required to imagine herself
walking around her home. These two imagery tasks recruit different areas of the cortex
that are distinguishable in fMRI. The motor imagery task recruits mainly the
supplementary motor area (SMA), whilst spatial navigation recruits primarily the
parahippocampal gyrus and posterior parietal cortex. In both tasks, the behaviourally VS
patient produced neural activity that was not significantly different from the activity
recorded in healthy controls. These results show that despite showing behavioural signs
of unawareness, it is possible for certain patients to have retained the ability to
understand spoken commands and to modulate their neural activity in response to these
commands (Owen & al., 2006). Since this study, the prevalence rate of covertly aware
patients has been estimated at around one in five patients (20%) as more and more studies
use mental imagery tasks to detect evidence of residual cognition. (Fernández-Espejo &
neuroimaging modality, EEG. Cruse et al. (2011) assessed 16 VS patients and asked them
to imagine moving their right-hand (in a squeezing movement) or to imagine moving
their toes (in a wiggling movement). These movements produce discernible patterns of
electrical cortical activity in EEG. They found that three of the 16 VS patients (19%)
were able to consistently imagine these two behaviours on command across trials.
Motor execution and motor imagery have been well documented in terms of their
functional and structural connectivity (Jeannerod, 1995; Roland et al., 1980). Motor
execution primarily recruits white matter fibres that connect the ventrolateral nuclei of
the thalamus to the primary motor cortex (M1) and motor imagery will primarily recruit
white matter fibres that extend from the ventrolateral nuclei of the thalamus to the SMA.
Due to the similar functional and structural connectivity of these two processes, they have
often been thought to be concurrent. Covertly aware patients however, challenge this
assumption and support the idea that these two motor processes are independent. This is
the main hypothesis explaining why these patients are able to perform motor imagery
tasks but remain behaviourally unresponsive.
A recent study by Fernández-Espejo, Rossit & Owen (2015) sought to elucidate the
mechanisms behind this dissociation. They studied two patients with DOCs and described
both the functional and structural connectivity of these patients along with their clinical
profiles. The patients performed the tennis motor imagery task described above and its
motor execution counterpart. Their functional and structural results were compared to a
group of healthy controls. When studying the patterns of activity across the thalamus, M1
and SMA, they found increased activation in the thalamus and M1 during motor
execution as compared to motor imagery. Specifically, they identified an excitatory
coupling between the thalamus and M1, suggesting excitatory signals from the thalamus
to M1 are crucial for motor execution. Additionally, when assessing the integrity of these
two white matter paths using diffusion tensor imaging (DTI), they found a significant
dissociation in these two paths in a patient who could not overtly respond to commands
but showed strong evidence of covert awareness. The path between the thalamus and M1
(motor execution) showed significantly more damage than the path between the thalamus
in a patient who could behaviourally follow commands and communicate with gestures.
This study suggests that the connection between the thalamus and M1 is crucial for motor
execution and that damage to this specific tract could explain why covertly aware patients
cannot overtly respond to commands.
1.4
Diffusion Tensor Imaging in DOC patients
The neuroimaging techniques discussed above such as fMRI and EEG have been useful
in characterizing different DOC diagnostic categories based on brain activity during
certain tasks and have been especially useful in the discovery of covertly aware patients.
However, these tasks rely on patient participation and run the risk of false negatives if the
patient cannot perform the scheduled tasks due to exhaustion or a period of unawareness.
Task-free imaging techniques such as FDG-PET, resting state fMRI or even structural
imaging allow researchers to identify patterns of activity or structure across diagnostic
groups that can help to classify a patient’s level of awareness. The main advantage of
these task-free techniques is their independence from a patient’s ability to perform any
task and therefore can be conducted regardless of the patient’s state of arousal. The
structural imaging technique of interest for this study is Diffusion Tensor Imaging
(Basser et al., 1994; Basser et al., 1994).
1.4.1
What is Diffusion Tensor Imaging?
This technique is a model of Diffusion Weighted Imaging (DWI; Le Bihan & Breton,
1985; Merboldt, Hanicke & Frahm, 1985; Taylor & Bushell, 1985; Le Bihan et al., 1986),
which is a type of Magnetic Resonance Imaging (MRI). DTI characterizes the boundaries
of structures and tissue based on the diffusion rate of water molecules (i.e. whether they
diffuse isotropically or anisotropically). In the cortex, white matter (WM) has been found
to be highly anisotropic, grey matter (GM) is usually expected to be less anisotropic and
cerebrospinal fluid is characterized by unrestricted diffusion (isotropic diffusion;
(Pierpaoli et al., 1996; Song et al., 2002; Hagmann et al., 2006). DTI models the principal
diffusion direction of each voxel in the 3D image by colour-coding the main eigenvector:
voxels with a principal eigenvector along the x-axis (left – right) are coloured red, voxels
voxels with a principal eigenvector along the z-axis (superior-inferior) are coloured blue
(see Figure 2).
There are two types of measure one can use to quantitatively describe diffusion in tissue.
These measures can quantify diffusion across the cortex or diffusion in specific WM
tracts of interests.
Measures of diffusion magnitude. Mean diffusivity, also sometimes referred to as the
apparent diffusion coefficient (ADC), is a measure of diffusion magnitude. MD refers to
the amount of diffusion in a single voxel and/or all voxels in a tract of interest, and
provides information about the molecular diffusion rate. In the context of pathology,
when the MD of a WM fibre tract is low, this indicates low diffusivity in the tract of
interest which could signify increased cell restriction due to an obstruction such as a solid
tumour. Conversely, when the MD or trace of a pathway of interest is high, this means
there is high diffusivity in this tract (i.e. increased free diffusion) and this could indicate
damaged tissue due to axonal atrophy for example (Soares et al., 2013; Stieltjes et al.,
2013).
Measures of diffusion anisotropy. Measures of diffusion anisotropy are used to quantify
the shape of diffusion in a voxel and across all voxels in a tract of interest. The most
common measure of this kind is fractional anisotropy (FA), because it measures the
fraction of the diffusion that is anisotropic in the voxel(s) of interest. In other words, it
Figure 2: Principal eigenvector colour map (from pilot participant in Study III). Leftmost panel: sagittal view; Middle
panel: Coronal view; Rightmost panel: axial view. Red: WM fibre from left-right; Green: WM fibres from
measures the magnitude of directionality of anisotropic diffusion. When studying clinical
populations, FA is a popular measure to use as it is considered a measure of WM
integrity: low FA indicates low anisotropy, hence a damaged fibre tract whereas high FA
indicates high anisotropy, illustrating a more intact fibre tract (Alexander et al, 2007;
Stieltjes et al., 2013).
1.4.2
Diffusion imaging in the context of severe brain injury
Post-mortem studies conducted on DOC patients’ brains have described the
neuropathology behind this chronic state of unawareness in some detail. For example,
Adams et al. (1999) studied 35 traumatic brain injury patients who, at the time of their
death, met diagnostic criteria for the vegetative state. The most common structural
abnormalities identified at post-mortem were found to be thalamic damage, diffuse
axonal injury (DAI), ischemic damage and brainstem damage. A follow-up study by the
same authors, added 14 non-traumatic VS cases. In this aetiological subgroup, diffuse
ischemic damage was common to most non-traumatic patients (64%) whilst damage in
the thalamus was present in all non-traumatic patients (Adams et al., 2000). Jennett et al.
(2001) used a similar methodology in a severely disabled group of patients (due to acute
head injury), most of whom met criteria for the minimally conscious state before death.
When comparing the post-mortem findings of this MCS group to the VS groups reported
by Adams et al. (1999) and Adams et al., (2000), the authors reported that diffuse axonal
injury and thalamic damage, the most common abnormalities in VS patients, were not as
prominent in the MCS group. Brainstem damage, however, was equally present in both
groups. Jennett et al. (2001), along with a review by Graham et al. (2005), concluded that
although diffuse axonal injury, global white matter and thalamic damage are common to
both VS and MCS patients, it is in fact the magnitude of the damage that distinguishes
these two conditions, not the location of the damage.
The main advantage of diffusion tensor imaging, especially for clinical populations like
brain injury patients, is that appraisal of the structural damage to cortical tissue can be
done invivo rather than post-mortem. To this effect, several DTI studies in DOC patients
have confirmed the above findings. Notably, Newcombe et al. (2010) compared patients
reported significant decreases in FA and increases in MD in global brain white matter
between these two aetiological groups. They also reported that both patient groups had
significantly higher MD in thalamic regions as compared to controls but the aetiological
subgroups showed no significant differences in these regions. In a follow-up study,
Newcombe et al., 2011 compared the FA and MD parameters in preselected regions of
interest (ROIs) and demonstrated similar results: patients in the VS had lower FA and
MD in all regions of interest compared to other brain injury groups (Newcombe et al.,
2011).
Although both studies support the notion that DTI can be used as a measure to
characterize and differentiate WM organization in VS patients and controls, these two
DTI studies did not include the full spectrum of DOC diagnoses. They did not include
MCS or EMCS patients and therefore could not investigate these WM changes as
potential biomarkers for differential diagnosis. Additionally, because they used global
white matter ROIs, they could only characterize WM integrity across the cortex, rather
than characterize integrity of specific WM paths. This lack of specificity precludes the
possibility of identifying the location of the damage potentially responsible for the
chronic state of these patients. It could be argued that any differences observed between
patients and controls could be attributed to general damage sustained after the original
insult.
Another study performed probabilistic tractography in VS, MCS and EMCS patients and
investigated the structural connectivity of the default mode network in comparison to
healthy controls (Fernández-Espejo et al., 2012). They noted impairment in
cortico-cortical connections as well as in thalamo-cortico-cortical connections in DOC patients compared
to controls. They also reported a main effect of diagnostic category in both tracts, with a
more consistent trend of FA decrease as clinical severity increased in the thalamo-cortical
tract. The FA values of these tracts significantly correlated with patient CRS-R scores.
Fernández-Espejo et al. (2011) investigated more precise regions of interest than
Newcombe et al. (2010, 2011): subcortical white matter, thalamic nuclei and the
MD peak height in DOC patients and controls and across diagnostic categories. They
identified changes in subcortical WM and thalamic regions which could predict patient
diagnosis with 95% accuracy. These results opened the possibility of using DTI as a
diagnostic tool when used alongside functional imaging and behavioural assessments.
This study also identified potential biomarkers (subcortical and thalamic white matter)
that could explain the chronic dissociation between arousal and awareness in these
patients.
These studies demonstrate that DTI is capable of measuring and quantifying damage,
specifically in WM tracts, displayed in DOC patients when comparing them to controls.
As of yet, it is unclear what specialized WM tracts, if any, can explain the chronic state of
these patients. However, results from the studies presented above point towards
mechanisms found in subcortical and thalamic regions. These imaging studies also
demonstrate the potential of DTI, when used alongside behavioural assessments, to help
identify structural diagnostic biomarkers which could aid in differential diagnosis.
1.5
Diffusion tensor imaging at ultra-high magnetic field
strengths
Theoretically, if DTI metrics such as FA and MD are accurately estimating the true
anisotropy and diffusion rate of water molecules in tissue, these measures should not vary
when changing the field strength of the MRI scanner(Shaw et al., 2016). However, when
increasing the magnetic field strength, such as going from 3T MRI to 7T MRI, several
confounding factors are introduced along with the inherent increase in signal-to-noise
ratio (SNR). For example, 7T MRI brings an increase in SNR thus allowing for reduced
scan times, increased spatial resolution and in the case of DTI, increased diffusion
weighting (Polders et al., 2011). This field strength however, will also introduce artifacts
such as eddy-current distortions, magnetic susceptibility gradients and inhomogeneities in
the static (B0) magnetic field. These artifacts may offset any advantages incurred by the
jump in SNR (Choi et al., 2011; Zhan et al., 2013). Many have tried to describe how DTI
metrics are affected by the increase in SNR and by the artifacts that accompany imaging
Polders et al. (2010; 2011) investigated the differences in FA and MD between 1.5T, 3T
and 7T magnetic fields across the same participants. They reported an increase in SNR as
the magnetic field strength increased as well as a decrease in uncertainty of FA and MD
calculations as magnetic field strength increased. These decreases in uncertainty, the
authors suggest, improve their usability in white matter fibre tracking in single subject
and group-level analyses by effectively increasing their reliability. Multiple computer
simulation studies have also reported similar results: as the SNR decreases, uncertainty in
DTI metrics increases; specifically, they concluded that in acquisition protocols with low
SNR and low diffusion weighting (around 1000s/mm2), FA calculations are
overestimated (Pierpaoli et al. 1996; Jones & Basser, 2004). These studies concluded that
to estimate the true anisotropy in an ROI or WM path of interest, SNR and diffusion
weighting should be increased when possible. Interestingly, a handful of studies have
investigated the effects of increased magnetic field strength on FA and have found that
raw FA values increased as the field strength increased (Polders et al., 2009; Huisman et
al., 2006; Qin et al., 2009). The authors of these studies could not elucidate these
contradictive results and stated that more work in healthy individuals, clinical populations
and computational models must be conducted to clarify the effects of higher SNR on DTI
metrics.
One important detail to note about these studies and simulations is that the measures of
SNR, FA, and MD were all calculated using the basic hardware settings and requirements
of each MRI scanner. Although multiple ROIs were involved in these estimations, the
diffusion acquisition protocols were not optimized to image the preselected ROIs.
Therefore, it remains to be determined how increasing the magnetic field strength affects
DTI metrics when the acquisition protocol is optimized to image specific a priori ROIs.
1.6
The present study
1.6.1
Rationale
Motor outputs are the most straightforward modality through which patients can follow
commands, communicate and show signs of awareness. However, with the discovery of
indication of a patient’s true levels of retained consciousness. One hypothesis to explain
this dichotomy is that the fibres connecting the thalamus to the primary motor cortex
(M1) are disrupted. Recent DTI work has shown that the integrity of this fibre path is
compromised in patients who cannot overtly respond to commands (Fernández-Espejo et
al., 2015). Previous animal studies have shown that the ventrolateral nucleus of the
thalamus primarily projects to the primary motor cortex (Rispal-Padel, Massion &
Grangetto, 1973; Rausell & Avendaño, 1985; Zheng et al., 1986) however connections
from this specific thalamic nucleus have yet to be tested in vivo in DOC patients.
Previous studies have shown that the dorsomedial (DM) nucleus of the thalamus sustains
much of the damage in VS patients (Fernández-Espejo et al., 2011; Fernández-Espejo et
al., 2010; Maxwell et al., 2006; Maxwell et al., 2004). The authors propose a model to
describe the relationship between damage to the dorsomedial thalamic nuclei and
disorders of consciousness: downregulation of frontoparietal systems via suppression
from the DM nuclei can lead to absence of awareness in the vegetative state. Conversely,
metabolism in thalamo-cortical systems is relatively preserved (Fridman & Schiff, 2014;
Schiff, 2010). This model, the mesocircuit hypothesis, postulates that when the central
thalamus sustains damage, its excitatory connections with frontoparietal systems become
inhibitory therefore precluding these mechanisms from supporting forebrain arousal
systems (Fridman & Schiff, 2014; Schiff, 2008; Schiff, 2010). Schiff (2008) suggests
certain frontoparietal regions are involved in this circuit, including the frontal eye fields
(FEF), supplementary motor area (SMA), anterior cingulate cortex (ACC) and posterior
parietal cortex (PPC). The central thalamus has been shown to activate during tasks
requiring short-term shifts of attention and during tasks requiring high levels of alertness
over extended periods of time (Schiff, 2008). It is then easy to see how selective damage
to the central thalamus could impair a patient’s overall ability for cognitively mediated
tasks or, depending on the extent of the damage, how it could affect the length of time a
patient can sustain their attention to complete behavioural or neuroimaging tasks.
Lant et al. (2015) investigated the structural integrity of this circuit in DOC patients and
healthy controls. They used diffusion tensor imaging to track the cortico-cortical,
mode network. Their cortical ROIs included the precuneus, temporoparietal junction,
frontal medial cortex and dorsolateral prefrontal cortex; their subcortical ROIs included
the thalamus, globus pallidus, putamen and caudate nucleus. They found that DOC
patients showed significantly lower FA in cortico-cortical and subcortico-cortical
connections when compared to controls. They reported similar results when comparing
these two tracts in clinically conscious (MCS+EMCS) and clinically unconscious patients
(VS). Clinically unconscious patients showed significantly lower FA than clinically
conscious patients in both paths. None of the groups showed significant differences in the
subcortico-subcortical tracts.
It is clear that to truly understand external responsiveness in DOC patients, the integrity
of the thalamic motor system and thalamic awareness system must be dissociated within
patients. Identifying the specific thalamic nuclei involved in these systems, however,
poses a challenge. Most of what we know about thalamic parcellation is based on ex vivo
studies, including animal studies and post-mortem studies (Lambert et al. 2016). These
mainly characterize the chemoarchitecture and cytoarchitecture of the various cellular
populations in the thalamus, to delineate specialized nuclei (Lambert, 2016; Morel,
2007). In vivo, low resolution (i.e. 1.5T/3T MRI) human resting state and task-dependent
fMRI studies have not been able to establish the role of specific thalamic nuclei due to
their small size and the poor spatial resolution of lower magnetic fields (Behrens et al.,
2003b; Metzger et al., 2013). In these studies, the thalamus as a whole is used as a region
of interest, which oversimplifies the specialized role of each nuclei in various facets of
behavior. Furthermore, studies using diffusion weighted imaging have been able to
parcellate the thalamus based on it cortical connections, however, these studies used a
top-down approach to parcellation. That is to say, they placed their seeds in major
cortical areas and identified clusters of thalamic voxels based on the cortical area with
which they showed the highest connection probability (Behrens et al., 2003b;
Johansen-Berg et al., 2005). This approach, although a viable starting point to map thalamic
connectivity in vivo, provides artificial boundaries between thalamic nuclei as they are
based on gross anatomy and do not account for gradual architectural features between the
nuclei (Lambert et al., 2016). As such, ultra-high magnetic fields (i.e. 7T MRI) have been
2012; Metzger et al., 2013). Indeed, several studies have been able to segment the
thalamus, and surrounding regions such as the basal ganglia, using multimodal imaging at
ultra-high fields (Calamante et al., 2012; Calamante et al., 2013; Lenglet et al., 2012;
Xiao et al., 2016). In the context of disorders of consciousness, multimodal imaging at
ultra-high fields in these patients would allow for the thalamic nuclei involved in the
mesocircuit and motor execution loops, thus allowing the dissociation of these two
systems within patients.
1.6.2
Objectives and Hypotheses
Study I. Using DTI, we aimed to determine if the disruption in the fibres between the
thalamus and M1 reported by Fernández-Espejo et al. (2015) could be replicated in a
larger sample of DOC patients and we sought to identify if any trends in damage to this
tract correlate with patient diagnosis. This would help determine if damage to this
particular path explains overt behavioural performance in a specific diagnostic group or if
the damage explains motoric output performance across all diagnoses. We hypothesized
that as clinical severity increased, so would the impairment in the thalamus-M1 fibre
paths. We expected a direct relationship between overt signs of consciousness and
impairment to the thalamus-M1 fibre paths. This would imply that all patients across the
board are more conscious than they appear from behavioural assessments, and
differentiating covertly aware patients from true VS patients is not possible based on
observations from this VL-M1 fibre alone.
Study II. We wanted to investigate if impairment in motor execution in these patients is
due to selective damage to the thalamus-M1 path, or if damage to other motor paths could
be responsible for a lack of overt responsiveness during assessments. The motor paths of
interest in this study were: the connections between the thalamus and M1, M1 and the
cerebellum and the thalamus and the cerebellum. Similar to Study I, we expected
diagnostic categories to differ in the magnitude of abnormality to the motor tracts of
interest not in the location. Additionally, we hypothesized that regardless of diagnosis,
our sample of DOC patients would not show impairment in the fibres connecting the
thalamus and cerebellum as DOC patients show damage primarily in supratentorial
conclusions by Graham et al. (2005), we expected diagnostic categories to differ in the
magnitude of their impairment to these tracts, not in the location of the impairment.
Study III. We sought to develop 7T DTI acquisition sequences with a variety of
acquisition parameters, and compare their success at reconstructing the motor fibre paths
from Studies I and II. Three DTI acquisition sequences were compared, differing in terms
of their gradient sampling directions and phase encoding directions. We hypothesized
that acquisition sequences with more diffusion gradient sampling directions would be
more successful at probabilistic tractography than the sequences with less sampling
directions. Additionally, we hypothesized that acquisition sequences using two bipolar
phase encoding directions would require less target masks to help the reconstruction of
tractography streamlines.
Study IV. In this study, we compared the reconstructions of motor paths at 7T and 3T in
a group of healthy controls. We used the optimized 7T from Study III and its 3T
counterpart, for both qualitative and quantitative comparison. Given the current state of
the literature and what we know about the benefits and pitfalls of imaging at ultra-high
fields, we cannot not predict the directionality of the DTI results from the optimized 7T
Chapter 2
2.
Generic Methods
All studies in this thesis used the regions of interest and exclusion and termination masks
described below.
2.1.1
DTI Data Analysis
Data preprocessing and analysis was performed using the FSL Diffusion Toolbox
(http://fsl.fmrib.ox.ac.uk/fsl/fslwiki/), following a similar pipeline as Fernandez-Espejo et
al. (2012), Fernandez-Espejo et al. (2015) and Lant et al. (2015). There are four main
steps to preprocessing DTI data: eddy-current correction, brain extraction tool (BET),
dtifit and finally BEDPOSTX. Eddy-current corrections (Andersson & Sotiropoulos,
2016) is used to correct subject movements and correct distortions induced by eddy
currents. The BET (Smith, 2002) is used to strip non-brain tissue from a whole-head
image. Dtifit is then run to fit the diffusion model (dictated by the protocol parameters) to
each voxel. The main output from this step generates the fractional anisotropy (FA) map
and the maps for the three eigenvectors (V1, V2 and V3 maps) which are used to analyze
the diffusion data. The final step in diffusion data preprocessing is Bayesian Estimation
of Diffusion Parameters using Sampling Techniques (BEDPOSTX; Behrens et al., 2003b;
Behrens et al., 2007). BEDPOSTX uses Monte Carlo Markov Chain sampling to build a
posterior distribution on diffusion parameters at each voxel. That is to say, BEDPOSTX
uses MCMC to build a distribution by calculating every possible orientation of the
principal eigenvector in a given voxel. Additionally, this feature determines the number
of crossing fibres per voxel. BEDPOSTX creates all the files necessary to run
probabilistic tractography.
2.1.2
Mask Generation
Primary motor cortex masks. The primary motor cortex masks (M1) were first created
in the standard template MNI152 2mm brain in FSL. The center voxel for the left
hemisphere mask was placed at x y z coordinates -27, -13, 64 and the center voxel for the
Fernández-Espejo et al. (2015). Around these center voxels, spheres with a radius of
6mm were created (Figure 3, panel A). Participant b=0 images were registered to the
MNI152 2mm template image using FSL’s FLIRT (Jenkinson & Smith, 2001; Jenkinson
et al., 2002). The resulting transformation matrix was inversed, and applied to each
standard mask to unwarp them into each participant’s native diffusion space (Figure 3,
panel B).
Thalamic masks. The most dorsal edge of the anterior commissure was visually
identified on the axial plane of each participant’s dataset (Figure 4, panel A). The center
voxels of the masks were created three slices dorsal to the anterior commissure in the left
and right ventrolateral nuclei (VL) of the thalamus (Figure 4, panel B). The anterior
commissure was chosen as a reference landmark to help identify the ventrolateral nucleus
based on the stereotactic atlas of the human thalamus by Morel (2007). These center
coordinates were used to generate spherical masks, which had a radius of 4mm and were
created in native space for each participant. We can confirm the position of the
ventrolateral thalamic masks by looking at the principal eigenvector colour map (V1
Figure 3: Axial view of cortical center voxels (blue) and spherical primary motor cortex masks (yellow) in standard
MNI152 space (Panel A); Axial view of unwarped primary motor cortex masks in native space of a healthy control
(Panel B). Central sulci are outlined in red.
map). In the V1 colour map, two main thalamic nuclei can be differentiated: the
ventrolateral nuclei and the dorsomedial nuclei. The ventrolateral nuclei appear in purple
(as in Figure 4, Panel B) as their M1 projections fall on the z-axis and the dorsomedial
nuclei appear in green as their projections to the frontal lobe fall on the y-axis.
Cerebellar masks. The cerebellar masks were generated using the SUIT atlas template
of the human cerebellum and brainstem (Diedrichsen, 2006). The preprocessed masks of
the left and right dentate nucleus (DN) from the SUIT atlas were used as a visual
reference. The center voxels were placed in the participants’ native space region
corresponding to the section when Vermis X start to protrude into the 4th ventricle
(Figure 5, Panel B). Spherical masks with a radius of 6mm were generated.
Exclusion and Termination masks. An exclusion mask discards any pathway that enters
the mask. A termination mask terminates a pathway once it enters the mask. A
termination mask was used to help guide the reconstruction of the pathway between the
ventrolateral nuclei and the primary motor cortices (ipsilateral connections). In Study I
and Study II, a mask was created along the entire hemispheric fissure, to separate both
hemispheres. This was done to prevent the reconstruction from crossing into the
Figure 4: Axial view of anterior commissure circled in Panel A; axial view of thalamic center voxels (blue) and
ventrolateral thalamic nuclei masks (yellow) placed dorsal to the anterior commissure (Panel B).
contralateral hemisphere (henceforth called hemispheric mask). A second mask was
created on the slice right after the most ventral part of the ventrolateral nuclei masks. This
was done to prevent probtrackX from reconstructing a pathway that traveled into the
brain stem (henceforth called brainstem mask). The hemispheric and brainstem masks
were combined to create one mask using fslmaths and this so-called combination mask
was used as a termination mask in the reconstruction of the VL-M1 tracts. Furthermore,
superior cerebellar peduncle mask spanning over four slices were created in each
hemisphere. These were used as exclusion masks when reconstructing VL-DN tracts.
These exclusions masks would exclude any fibres crossing into the opposing cerebellar
hemisphere. Additionally, we used a termination mask immediately above the most
dorsal slice of the thalamic masks – this stopped probtrackX from reconstructing fibres
that entered cortical areas. Finally, when tracking M1-DN tracts, an exclusion mask was
used to accurately reconstruct the pathway. Finally, a supratentorial mask was created
along the hemispheric fissure, extending from the tentorium to the top of the cortex. This
would then allow fibres from crossing into the opposing hemisphere through the middle
cerebellar peduncles, the anatomically correct crossing point, rather than through the
corpus callosum. This supratentorial mask was combined into one mask with the superior
Figure 5: Axial view of Vermis X of the cerebellum protruding into the fourth ventricle circled in red in Panel A; axial
view of cerebellar center voxels (blue) and cerebellar dentate nuclei masks (yellow; Panel B).
cerebellar peduncle masks described above. All cortical masks, exclusion masks and
termination masks were binarized using fslmaths before tractography. Probabilistic
tractography can only be run from voxels with a non-zero value. Binarizing the masks
used in this study ensures that all voxels in these masks have a value of one and that
voxels not included in the masks have a value of zero.
In DOC patients, cortical areas are mostly preserved whilst subcortical areas sustain
substantial damage and atrophy. It is often difficult to visually identify subcortical areas
in patients, therefore unwarping masks from standard space becomes an unreliable
practice. However, this is not a problem with healthy participants, accordingly, it is
theoretically possible to unwarp subcortical and cerebellar masks into native space. That
being said, to remain consistent across all participants, only the cortical masks were
generated in MNI152 standard space and the thalamic and cerebellar masks were
manually created in native diffusion space.
2.1.3
Probabilistic Fibre Tracking
Fibre tracking was estimated in native diffusion space for each participant between pairs
of regions of interest (ROIs) using probtrackX (Behrens, 2003a; Behrens, 2007).
probtrackX repeatedly samples from the distributions built up from BEDPOSTX. At each
sample, pobtrackX calculates a streamline (i.e. path) between the seed voxels and all
other regions/voxels in the brain. After a large number of samples, it can calculate a
dominant streamline stemming from the seed voxels, as well as the probability of each
brain voxel belonging to this streamline. Each voxel will receive a value, represented by
the number of probtrackX samples that have passed through the voxel. Most brain voxels
will have a value of zero (i.e. zero probability of belonging to the dominant streamline).
The higher the value in a voxel, the more samples have passed through, implying high
connectivity between the voxel and seed voxels. In Study I, the seeds include the
ventrolateral thalamic nuclei (VL), the primary motor cortices (M1) while in Studies II,
III and IV, the seeds include the VL, M1 and the dentate cerebellar nuclei (DN) Tracking
was done in both directions between each ROI and the two probability paths resulting
from each tracking pair were averaged and then thresholded. In Study I and II, the fibres
connecting the primary motor cortices to the dentate nuclei, were thesholded to removed
pathways that had a probability distribution of less than 2%. For the fibres connecting the
ventrolateral thalamic nuclei and the dentate nuclei, pathways with a probability
distribution of less than 5% were removed. In Study III and IV, all reconstructed
streamlines were thresholded at 2%. There is currently no convention about a precise
thresholding percentage, however, thresholds between 2-5% have previously proven
successful in both healthy and pathological populations (Behrens et al., 2007;
Fernández-Espejo et al., 2012; Kinoshita et al., 2015; Sala-Llonch et al., 2010). See Table 2 for
tracking pairs. The fibres between VL and M1, VL and DN, M1 and DN will henceforth
be referred to as VL-M1 tracts, VL-DN tracts and M1-DN tracts respectively. The
resulting fibre tracts were visually inspected for correspondence with known anatomy
and to ensure our approach did not remove anatomically viable fibres. We used the White
Matter Atlas by Hermoye et al. (http://www.dtiatlas.org/) as a visual reference.
Table 2: Description of pairs of tractography ROIs
Pairs ROIsa Connection
1 Left VL - Left M1 Ipsilateral
Right VL - Right M1 Ipsilateral
2 Left VL - Right DN Contralateral
Right VL - Left DN Contralateral
3 Left M1- Right DN Contralateral
Right M1 - Left DN Contralateral