Analysis of Cropping Pattern by Using
Soilwater Assessment Tool
Surabhi Gaidhani1, R.V. Shetkar2
Department of Civil Engineering, Govt. College of Engineering, Aurangabad, Maharashtra, India1
ABSTRACT: In analysis of cropping pattern, availability of irrigation water is great challenge. The procedures are used to overcome this challenges and for determining the cropping pattern on basis of land and water constraints. To simulate the climate-soil-plant relationship, soil and water assessment tool (SWAT) simulation approach is used.SWAT model splits up the total watershed area into small subbasin area on basis of topography. Each subbasin area is called hydrologic response units (HRU), which are separated by unique soil and land use characteristics. SWAT can run for two executions viz. daily and monthly. In this study we are setting parameters for monthly execution for 30 years from 1983 to 2013 by keeping 3 warm up year duration.The average depth of the irrigation is consider constant as 50–60 mm. Monthly gridded observed climate data, such as temperature, solar, wind, precipitation relative humidity be associated with the nearest rain-gauge station for 30 years is used. Considering all this information, yield of the cropping pattern of region is determined.
KEYWORDS: Multiple cropping, SWAT, crop yield, soil water assessment tool.
I.INTRODUCTION
Increasing population and economic developments will be prime reason for increasing competition for water constraints. Now a day irrigation sector is facing challenges for more yield in less water. That’s why a new phenomenon is introduced is per drop more crop. Therefore, increasing crop yield and irrigation efficacy is essential to take the challenge. However, to development agricultural events water constraint is major issue and it affects crop yield. To overcome this, researches on optimal cropping pattern and water distribution catches more concerned in current years. To look into the efficacy of irrigation practices on crop yield simulation, the SWAT is used for the study. SWAT can predict the effects of changes in climate and management conditions on area. The model is subdivided into smaller hydrological response units (HRUs) founded on management practices, cropping pattern and soil type. The minimum required data to execute the SWAT model simulations is climate data, soil layer, a land use layer, and topographic layer, and some other data input or their combinations can be used to modify the simulations. Objectives of study is to determine crop potential of study area with the SWAT tool and what alternative crop should be suggested for maximisation of yield. Limited water resources to make the maximum economic benefit and to optimise the profit depends upon the total usable land and water limitations. And to identify the best suitable crop or cropping pattern for the region which gives economically more yield.
2.1 SWAT: The Agronomic Simulation Model
SWAT is a basin scale continuous time model was developed to analyse the impact of land management practices on crop, water, sediments and nutrient loads in large watershed with variation in soils, landuse, and management practices. SWAT can simulate the plant growth parameter. SWAT model is executed by splitting the watershed into subbasins on topographic basis. Water and nutrient transformations and losses are determined separately for each HRU. In SWAT water, temp, phosphorous and nitrogen stress factors can affect the potential crop growth and yield of a crops. The multiplication of the actual above ground biomass (bioact) and the actual harvest index (HIact) is called as actual yield. All management is affected by bioact, stress factors (fertilizer, water and temp.) while actual yield is affected by the water-stress factor. To complete the certain water – stress limited yield calculation is done with the tool. User-specified or automatic are two options for application of the irrigation water and timing of fertilization. The fertilization rate is specified by the user during growing season. In the SWAT model geographic layers are prepared in three layers. i.e. 1. A land use layer, 2. A topographical information, 3. A soil information.
2.2 SWAT Fundamentals
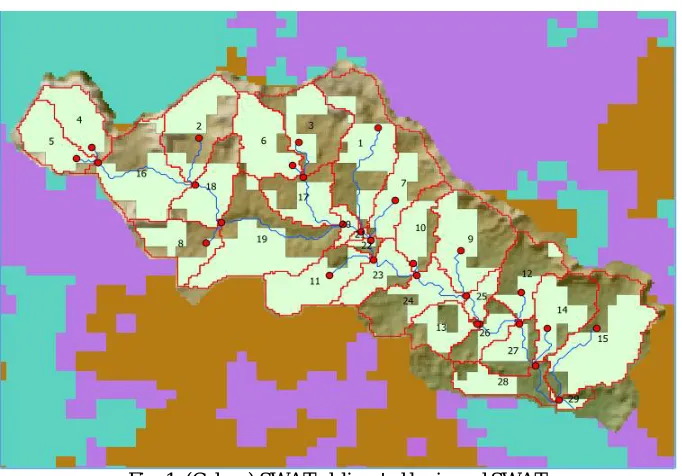
Some inputs and the topographical information is fed to SWAT and the basin boundaries and SWAT subbasins which divided from basin itself are fixed. Default Subbasin delineations is flexible with user acceptance by SWAT and provide facility to manipulate the subbasins characterisation. The Subbasin boundaries are made by SWAT in form of geographic layer and the basin was divided into 29 subbasins while delineation. After the delineation process, the 3rd menu subbasins are further divided into small HRUs. HRUs are most spatially resolved and fundamental computational component of the SWAT model.
2.3 SWAT HRU Analysis
Fig. 1. (Colour) SWAT-delineated basin and SWAT
2.4 Completing the SWAT Model Setup
Climatic data is combined and writing of the basic primary SWAT files is done, and changes were made to the parameters using and setting the combination of parameters.to predict the effects of excessive fertilization on quality of water, crops, crop rotations is assigned to a management schedule like providing planting date, fertilisation rate, kill and harvest date, and irrigation scheduling for the crops. Practically, the same management were applied to the each crop from the model, since the crop operations were altered, the land operation parameters is differ accordingly. Firstly to create a operation field for every crop (i.e., soybean, lentils, winter wheat, corn).To each crop same amount of fertilizer applied every year. The fertilization rate of the year for each crop is decided on basis of last year application if the fertilizers and it is decided by the farmers at their own. The certain values of fertilisers are fixed which is applied to per hectare of land, such as for corn 224kg/ha is nitrogen is applied.
2.5 Calibration
The location in SWAT model is selected such as the whole water from the area is drained into a single outlet point. The estimated inflows of lake was flow of model at the end of SWAT basin. The model was calibrated by changing to the SWAT subbasin parameters and model watershed parameters. SWAT model is designed for ungauged basins including gauged station data is considered critical for calibration. In this study SWAT parameters are most needful for the yield calibrations.
III.METHODOLOGY
temperature, solar, relative humidity be associated with the nearest rain-gauge station for 30 years from 1983 to 2013 were used.
Fig. 2 The average precipitation during the years of simulation.
Soil and land use maps were produced from the global weather data website www.globalweather.tamu.edu which is a custom-made site by SWAT. The soil characteristics values were extracted from the Indian soil data from
www.nbss.maharashtra/eusoils. The SWAT modelling was executed on QSWAT for QGIS desktop 2.6.1 was used. 3.1 Study area
The study area is located near Ajintha Taluka Sillod and Dist. Aurangabad. Latitude and longitude are 75.44-75.72, 20.37-20.52 respectively. Area of study area is approx. 17033.31 hectares. Total subbasins count by SWAT are 29 and the total HRU count is also 29.the distribution of the study area on basis of lands is given below
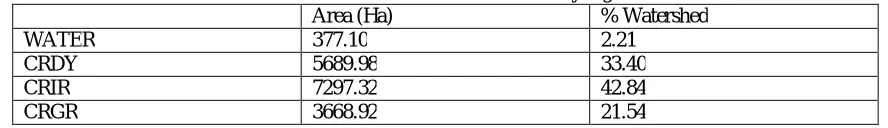
Table.1 land use distribution of the study region
Area (Ha) % Watershed
WATER 377.10 2.21
CRDY 5689.98 33.40
CRIR 7297.32 42.84
CRGR 3668.92 21.54
SWAT also provides us information this detailed information of lands for each HRU also. Procedure to run the model:
Firstly we using QGIS 2.6.1 desktop for the entire study and QSWAT interface to calibrate the results ,raster data of 30*30 is used to clip the study area from given dem data from globalweather data of landuse and soil.as mention in literature the steps are followed to run the SWAT model. And the model is run for 30 year meteorological data with 3 warm up years. The wgnweather files are generated using Wgn generator with the help of excel. The output of Wgn generator is fed to the database created by SWAT model. And hereafter the SWAT model is run to further calibrations. 3.2 The model gives us changes over the years of
The land use
Precipitation in mm
0 50 100 150 200
p
re
ci
p
it
at
io
n
(m
m
)
Years
PRECIP
Ground water recharge in mm
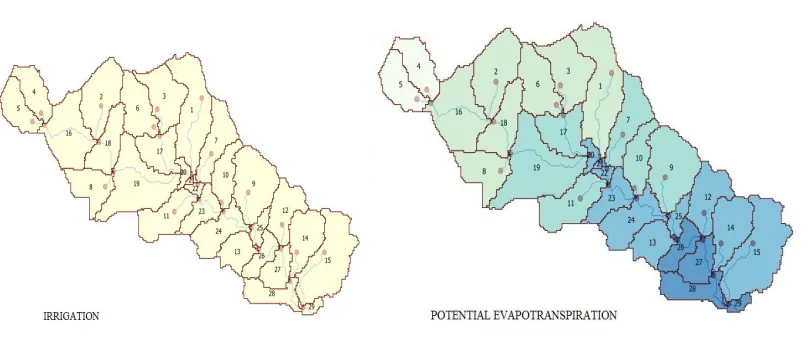
evapotranspiration of areas in mm
PET values in mm
Irrigation in mm
Fig. 3. Evapotranspiration over the entire study area
source of irrigation and no of repetitions with the aid of which the yield is calibrated. According to our knowledge and iteration, we can find the cropping pattern for the area which will give us more crop yield as well as economic benefits.
Fig.5. irrigation scheduling into subbasin data
The general parameters are PET method penman/Monteith is used. This should be update in general watershed parameters from watershed data. And after editing all the crops and remaining data required the we have to rewrite the input table .Mgt and run SWAT again and we are able to get the yield of each crop separately as shown in the results.
IV.EXPERIMENTAL RESULTS
The average plant values calculated by SWAT are mentioned below in the table below and the expected values of respective crop are as given below in table
Table.2 The crop yield values of crops calculated by SWAT Average Plant Value(kg/ha)
15 CORN 146.9 974.8 16 COTP 154.7 976.7 17 COTP 156.9 990.3 18 COTP 154.8 977.7 19 COTP 156.1 985.4 20 SOYB 708.0 5607.7 21 LENT 3466.1 7350.5 22 SOYB 707.5 5606.7 23 LENT 3466.1 7303.5 24 CORN 147.6 979.5 25 CORN 148.9 988.8 26 CORN 216.2 1456.8 27 CORN 218.1 1469.2 28 CORN 150.0 995.7 29 CORN 146.0 969.3
The HRU’s having same crop shows a similar variety of yield because there is no such any kind of climatic geographic and topographic difference between the HRU’s and they are too small area to record any variation in soil characteristics. The calculated average crop yield of wheat is 95.2, cotton = 156.9, corn=147, tur daal (Lentils) =3466.1 and soyabean =708.0.
Table.3 values provided by agricultural department Sr.no Crop Average Crop yield by
Agricultural department
Crop yield obtained by SWAT Model
1 Wheat 728 95.2
2 Corn 940 147
3 Cotton 250 157
4 Tur daal(Lentil) 2078 3466
5 Soyabean 1353 708
The comparison between average yield values of plant calibrated by SWAT and values provided by agricultural department of sillod taluka are shown in figure below
728 940
250
2078
1353
95.2 147 157
3466 708 0 1000 2000 3000 4000
Wheat Corn Cotton Tur daal(Lentil) Soyabean
ye
ild
The comparison of both average annual yield calculated by SWAT and obtained are compared to the expected yield given by the agricultural department itself.
Fig.6. comparison between average crop yield, obtained yield and expected yield
SWAT also provides the additional information than this, with the aid of which we can correlate data to the cropping pattern and variation between actual time data and forecast data can be affirmed.
V.CONCLUSION
To explore the most economical cropping pattern along with land and water limits, the optimal cropping pattern and water resource distribution is examined by SWAT model performance.
The availability of water in the scenario was kept constant.
With the help of SWAT we can predict the best suitable cropping pattern for the area by keeping the same or different irrigation depth.
In study area the LENTIL’s shows more yield than other crops so its greater cultivation is more beneficial, and similar way WHEAT shows less yield .so it can be cultivate with the farmers need/choice.
With the help of SWAT we can find out the optimised cropping pattern with some iterations by considering the needs of the region.
REFERENCES
1. Arnold, J. G., Srinivasan, R., Muttiah, R. S., and Williams, J. R. “Large area hydrologic modeling and assessment—Part 1: Model development.” J. Am. Water Resour. Assoc., 34 (1), 73–89, 1998.
2. Daggupati, P., Douglas-Mankin, K. R., Sheshukov, A. Y., Barnes, P. L., and Devlin, D. L. “Field level targeting using SWAT: Mapping output from HRUs to fields and assessing limitations of GIS input data.” Trans. Am. Soc. Agric. Biol. Eng., 54 (2), 501–514,2011.
3. De Fraiture, C., Cai, X., Rosegrant, M., Molden, D., and Amarasinghe, U. “Addressing the unanswered questions in global water policy:A methodology framework.” Irrig. Drain., 52 (1), 21–30, 2003.
4. Gorantiwar, S. D., and Smout, I. K. “Performance assessment of irrigation water management of heterogeneous irrigation schemes: A framework for evaluation.” Irrig. Drain. Syst., 19 (1), 1–36, 2005.
5. Horizon Systems. (2012). “National Hydrography Dataset Plus.” Mississippi (Hydrologic Regions 05, 06, 07, 08, 10, 11). 〈http: //www.horizon-systems.com/NHDPlus/NHDPlusV1_MS.php〉(Sep. 9, 2012).
6. Kijne, J.W., Barker, R., and Molden, D. Water productivity in agriculture, 2003.
7. Molden, D. “Accounting for water use and productivity.” International Irrigation Management Institute, Colombo, Sri Lanka, 1997.
0 1000 2000 3000 4000 5000 6000 7000
Wheat Corn Cotton Tur daal(Lentil) Soyabean
1 2 3 4 5
AV E R AH E Y IE LD CROPS
average crop yeild
8. Neitsch, S. L., Arnold, J. G., Kiniry, J. R., Williams, J. R., and King, K. W. “Soil and water assessment tool.” TWRITR-191, Texas Water Resources Institute, College Station, TX, 2002.
9. Rabie, Z., Honar, T., and Kazemi, A. R.. “Optimal, simultaneous land and water allocation under resource limitation conditions, using soil water balance (case study of Doroudzan dam irrigation and drainage network).” J. Irrig. Drain., 2 (7), 159–166, 2013.
10. Seckler, D., Molden, D., and Barker, R. “Water scarcity in the twenty-first century.” IWMI water brief 1, International Water Management Institute, Colombo, Sri Lanka, 1998.
11. Singh, A. “Simulation-optimization modeling for conjunctive water use management.” Agric. Water Manage., 141, 23–29, 2014.
12. Shangguan, Z., Shao, M., Horton, H., Lei, T., Qin, L., and Ma, J. “A model for regional optimal allocation of irrigation water resources under deficit irrigation and its applications.” Agric. Water Manage.,52 (2), 139–154, 2002.
13. Srinivasan, R., Zhang, X., and Arnold, J. (2010). “SWAT ungauged: Hydrological budget and crop yield predictions in the Upper Mississippi River Basin.” Trans. Am. Soc. Agric. Biol. Eng., 53(5), 1533–1546. SWAT Literature Database. (2012). “SWAT literature database for peerreviewedjournal articles.” 〈https://www.card.iastate.edu/swat_articles/〉(Sep. 9, 2012).
14. SWAT Model Download Website. (2012). “SWAT model software.” 〈http://swatmodel.tamu.edu/software/swat-model/〉(Sep. 2, 2012). 15. SWAT Software Web Site. (2012). “SWAT software.” 〈http://swat.tamu.edu/software/〉(Sep. 9, 2012).
16. USDA National Agricultural Statistics Service. (2012). “CropScape.” Cropland Data Layer. 〈http://nassgeodata.gmu.edu/CropScape/〉(Sep. 9, 2012).
17. USDA Natural Resources Conservation Service. (2012). “Description of soil survey geographic (SSURGO) database.” Soil survey. 〈http://soils.usda.gov/survey/geography/ssurgo/description.html〉(May 11, 2012).