DOI: 10.1534/genetics.108.090019
Clonal Interference, Multiple Mutations and Adaptation in Large
Asexual Populations
Craig A. Fogle,* James L. Nagle* and Michael M. Desai
†,1*Department of Physics, University of Colorado, Boulder, Colorado 80309 and†Lewis–Sigler Institute for Integrative Genomics, Princeton University, Princeton, New Jersey 08544
Manuscript received April 6, 2008 Accepted for publication September 19, 2008
ABSTRACT
Two important problems affect the ability of asexual populations to accumulate beneficial mutations and hence to adapt. First, clonal interference causes some beneficial mutations to be outcompeted by more-fit mutations that occur in the same genetic background. Second, multiple mutations occur in some individuals, so even mutations of large effect can be outcompeted unless they occur in a good genetic background that contains other beneficial mutations. In this article, we use a Monte Carlo simulation to study how these two factors influence the adaptation of asexual populations. We find that the results depend qualitatively on the shape of the distribution of the fitness effects of possible beneficial mutations. When this distribution falls off slower than exponentially, clonal interference alone reasonably describes which mutations dominate the adaptation, although it gives a misleading picture of the evolutionary dynamics. When the distribution falls off faster than exponentially, an analysis based on multiple mutations is more appropriate. Using our simulations, we are able to explore the limits of validity of both of these approaches, and we explore the complex dynamics in the regimes where neither one is fully applicable.
T
HE accumulation of beneficial mutations drives adaptation and evolutionary innovation. Yet de-spite its central importance, the evolutionary dynamics by which a population accumulates such mutations are poorly understood. To better understand adaptation in any particular system, we must ask two questions. First, what is the range of beneficial mutations that are possible given the particular environmental challenge and genetic state of the population? Second, given this set of possibilities, what will actually happen probabi-listically?The first of these questions is fundamentally empirical, although Orr and Gillespie have argued on general the-oretical grounds that the distribution of fitness effects of beneficial mutations should be exponential (Gillespie 1983, 1984, 1991; Orr2002, 2003). A variety of recent experimental studies are roughly consistent with this ex-ponential expectation (Imhofand Schlotterer2001; Rozenet al.2002; Sanjuanet al. 2004; Depristo et al. 2005; Lunzeret al.2005; Rokytaet al.2005; Kassenand Bataillon2006). However, beneficial mutations are rare and their fitness effects are difficult to measure precisely, so these experimental studies are generally based on relatively few total mutations and have correspondingly limited resolution. The tail of the distribution, which refers to the rare mutations that confer a very large fitness
benefit, is particularly hard to measure. Further, the spe-ctrum of beneficial mutations available to a population is likely to vary with genetic background, history, and the environment, so it is unclear how far we can gen-eralize from individual experimental studies. Thus it is still unknown whether in general the distribution of mutant effects, particularly of large-effect mutations, is exponential.
Even if we knew the precise distribution of mutational possibilities, it is not clear how a population would evolve. Because mutations are random events, there will inevitably be some randomness in how a given popula-tion adapts. What we want to understand is the statistics of which beneficial mutations are more or less likely to contribute to adaptation and the dynamics by which they do so. That is, given a set of things that are possible, what is the probability that any given one of them will actually occur and contribute to the adaptation of the population? What is the evolutionary dynamics by which they do so? In this article, we focus on how the distribution of mutations that actually occur and spread through the entire population (i.e., fix),rf(s), depends
on the distribution of mutations that are possible,r(s), wheresis the fitness benefit from a single mutation. We explore these features as a function of the population size N and the overall mutation rate U. Besides its importance in understanding adaptation, this question is relevant in practical attempts to measure the distri-bution of possible mutations, sincerf(s) is much easier
to measure experimentally thanr(s). We also examine 1Corresponding author:Lewis-Sigler Institute for Integrative Genomics,
Princeton University, Princeton, NJ 08544. E-mail: [email protected]
some aspects of the dynamics by which the mutations that fix do so.
There are a number of effects that make the distri-bution of mutations that fix different from the distribu-tion of all possible mutadistribu-tions. First, most beneficial mutations that occur are lost rapidly by random genetic drift. If a beneficial mutation is particularly lucky, it will avoid this stochastic loss and reach a high enough frequency that thereafter its dynamics become domi-nated by selection rather than by drift. We refer to this process as theestablishment of the beneficial mutation. Mutations of larger effect are more likely to survive random drift—they have a higher establishment prob-ability—so this will tend to bias the distribution of mutations that actually fix toward larger-effect muta-tions, relative to the distribution of mutations that are possible (Haldane1927; Rozenet al.2002).
Once a mutation has become established, it will fix provided that nothing else interferes. However, this fixation takes time, and other beneficial mutations can become established in individuals without the original mutation before the original mutation can fix. In an asexual population, if one or more of these other mutations has a larger fitness benefit than the original mutation, the original mutation will eventually be out-competed and driven to extinction. This process is known asclonal interference(Gerrishand Lenski1998; Gerrish 2001; Wilke 2004). The same process also operates in a sexual population, where it is referred to as the Hill–Robertson effect, but is mitigated because the two competing mutations can potentially recombine onto the same genome and fix together (Hill and Robertson1966). In this article, we focus exclusively on asexual populations, where this effect is strongest.
In a small population with a small to modest mutation rate, the establishment of a beneficial mutation is an extremely rare event. Thus clonal interference is unlikely to occur, and the distribution of mutations that fix is simply the distribution of mutations that establish. In a larger population, or one with a higher mutation rate, however, clonal interference can be extremely common. This is true whenever the population size times the beneficial mutation rate is large compared to one (the precise condition is actually slightly weaker than this), so clonal interference is likely common in a wide range of microbial and viral populations, especially in light of recent studies showing that beneficial mutation rates in bacteria and yeast are relatively high ( Josephand Hall 2004; Perfeito et al. 2007). Because small-effect muta-tions are more likely to be interfered with than large-effect mutations, clonal interference biases the distribution of mutations that fix toward those of large effect. This bias has been analyzed in detail both theoretically (Gerrish and Lenski1998; Wilke2004) and experimentally (De Visseret al.1999; DeVisserand Rozen2005).
These analyses of clonal interference consider only mutations that occur in the wild-type population; they
assume that the largest such mutation is the one that fixes. The possibility of double mutations in a single organism is neglected. But, in fact, even if a more-fit mutation B occurs before an earlier but less-fit mutation A fixes, A may still survive, because an individual with mutation A can get another mutation C such that the A-C double mutant is more fit than B. Recently, Desai and Fisher (2007) showed that whenever clonal in-terference is important, these multiple mutations are also at least of comparable importance—and, in fact, many large asexual populations will often routinely have triple or quadruple mutations (Desai et al. 2007). Because small-effect mutations are more common than mutations of larger effect, they are more likely to form double mutants. Thus the possibility of multiple muta-tions biases the distribution of mutamuta-tions that fix back toward those of smaller effect. In short, it will often be the case that getting two small-effect mutations is more common than getting a single (rarer) large-effect mutation. This effect depends on the shape of the dis-tribution of mutational effects: the rarer large-effect mu-tations are compared to small-effect ones, the stronger the multiple-mutation effect should be. The importance of this effect also depends on population size and mu-tation rate, though in a somewhat different way than clonal interference does.
In addition to affecting the distribution of mutations that fix, multiple mutations also have an important impact on the evolutionary dynamics. Different individ-uals have different numbers and strengths of beneficial mutations, so a large population can maintain sub-stantial variation in fitness. It is only those mutations that occur in the most-fit individuals that have the best chance of surviving and contributing to the long-term adaptation of the population. Thus the dynamics of adaptation are slowed down, limited by the rate at which good mutations occur in good backgrounds.
aspects of rf(s) when large-effect mutations are
suffi-ciently common relative to small-effect ones. When large-effect mutations are more rare, we find that an approximation focusing on multiple-mutation ef-fects, proposed by Desai and Fisher (2007), is more appropriate.
We next turn to the evolutionary dynamics by which beneficial mutations fix. Using our Monte Carlo ap-proach, we simulate the evolutionary dynamics. We show that multiple-mutation dynamics involving muta-tions within a narrow range of fitness effects describe the evolution. We describe how this range of fitness effects depends onr(s) and the other parameters and how the mutations within this range accumulate.
MODEL AND SIMULATION METHODS
We consider an asexual population of N haploid individuals with an overall mutation rate Ub toward
beneficial mutations. Our model also applies to asexual diploids, where the fitness effects of mutations refer to their effects in the individual in which they occur (i.e., if the mutation creates a heterozygote the relevant fitness effect is given by the difference in fitness between the original state and the newly mutated heterozygote, and analogously if the mutation creates a homozygote). Given that a beneficial mutation occurs, we assume that its fitness effect is betweensands1ds(i.e., the fitness of the organism increases by a factor betweenesand
es1ds)
with probability
rðsÞds¼ e
ðs=sÞb
sGð111=bÞds; ð1Þ
where the two parameters s and b characterize the shape of the distribution andGis the Gamma function. This form forr(s) allows us to explore the importance of the shape of the tail of the distribution of mutant effects—that is, the relative rareness of large-effect mutations compared to small-effect ones. Whenb¼1, the distribution of mutant effects is exponential with means. Whenb.1, the distribution of mutant effects falls off faster than exponentially (i.e., large-effect
mutations are more rare), and when b , 1 the
distribution of mutation effects falls off more slowly than exponentially (large-effect mutations are more common). Note that this distribution is normalized to 1, so beneficial mutations with effect betweensands1ds
occur at a rateUbr(s)ds. The average fitness effect of a
beneficial mutation,s, is
s¼sGð2=bÞ
Gð1=bÞ; ð2Þ
sosis exactly equal to the average effect only forb¼1. We assume that there is no epistasis, so that an individual with two mutations of effect s1 and s2 has
fitness es11s2 (or more generally for n mutations, the fitness isQni¼1esi).
We neglect deleterious mutations, as Rouzine et al. (2003) and Desai and Fisher (2007) have shown theoretically that they are not expected to qualitatively affect the rate or dynamics by which a large asexual pop-ulation adapts when beneficial mutations are relatively common, which is the situation we study here (Rouzine
et al. 2003 verified this expectation with simulations). When deleterious mutations become extremely com-mon, beneficial mutations are sufficiently rare, or the population sizes are small enough that Muller’s ratchet becomes important, this approximation breaks down. We do not study any of these situations here, but several other authors have analyzed them using both theoret-ical and simulation approaches (Orr 2000; Johnson and Barton2002; Rouzineet al.2003; Camposand De Oliveira2004).
We assume dynamics with discrete generations. In each generation, we first randomly select which individ-uals will survive to the next generation, weighted by each individual’s fitness. The overall survival probabil-ities are normalized so that on average half of the population will survive to the next generation. Each surviving individual then duplicates to create two iden-tical individuals in the next generation. Finally, each of these individuals in the next generation has a probabil-ityUbof acquiring a new beneficial mutation. We then
repeat this algorithm for the subsequent generation. We record all the information about the genetic state of the population at each step. All simulations were checked to ensure that the results were extracted after a steady state had been achieved. Note that this algorithm does not enforce an exact population size N at each step, but rather keeps the average population size equal toN.
that a deleterious mutation occurs, we assume that it has a fitness cost drawn at random from an exponential distribution. The results from these simulations are nearly identical to those from simulations that neglect them, justifying our assumption, with a few minor differences that are noted in theresultssection.
PREVIOUS THEORY
In large asexual populations, the effects of clonal interference and multiple mutations interact in a subtle way. As noted in the Introduction, analytic results are difficult to obtain in this complex situation, and no complete theory yet exists. Instead, two different theo-retical approaches have been proposed. The first fo-cuses exclusively on the clonal interference effect, while the second focuses on multiple mutation dynamics. In this section, we briefly summarize the relevant theoretical predictions given by each of these two ap-proaches, as well as our expectations for small popula-tions where neither effect matters. We then compare these predictions to our simulations in subsequent sections.
Definitions and small populations: We begin by
considering populations that are sufficiently small that neither clonal interference nor multiple mutations will occur [this requiresNUb>1=ln½Ns(Desaiand Fisher
2007)]. In these populations, the distribution of muta-tions that fix,rf(s), equals the distribution of mutations
that establish. We expect
rfðsÞ ¼pðsÞrðsÞ; ð3Þ
valid for smallNandUb, wherep(s) is the establishment
probability. Note that by convention we assumerf(s) is
notnormalized; this makes various calculations much more transparent. In our model, for N?1 this estab-lishment probability is given by
pðsÞ ¼ 1e
2s
1e2Ns; ð4Þ
where s is the fitness advantage relative to the back-ground population. Note that despite slightly different stochastic dynamics, this establishment probability is identical to that of the Wright–Fisher model. When
Ns>1, we havepðsÞ 1=N, while forNs?1 buts>1 we have p(s) 2s. This small-population limit of rf(s),
which is the distribution of mutations that establish, is sometimes called the distribution of contending muta-tions (Rozenet al.2002). We denote it byrc(s).
To determine how beneficial mutations of different effects contribute to the overall adaptation of the population, we need to weight mutations by their fitness effects. That is, a single fixed mutation with effect 2s
contributes the same amount to the adaptation of the population as two mutations with effect s. Thus we
defineR(s)[ srf(s) as the distribution of the relative
contributions to the overall adaptation as a function ofs. The integral ofR(s) froms1tos2is the total contribution
of mutations of size betweens1ands2to the adaptation.
Using R(s), we can study which mutations are most important. We expect that mutations of very small effect will not contribute substantially to adaptation, because they confer such a small advantage (and in larger populations they are also strongly suppressed by clonal interference). On the other hand, mutations of very large effect will be too rare to contribute substantially (and in larger populations may be impeded by multiple smaller mutations). Thus we expect that typicallyR(s) will have a peak at some intermediate value of s, with some range of mutations around this that contribute substantially to adaptation. This is indeed what we find. We characterizeR(s) by its mean, which we call˜s[to be precise, we define ˜s[Ð0‘sRðsÞ=Ð0‘RðsÞ]. We estimate the width of the range of mutations around the mean that contribute substantially to the evolution by the standard deviation ofR(s) around˜s, which we call SD(s). Fromrf(s), we can easily calculate theR(s), and hence
also the˜sand SD(s), relevant for populations so small that neither clonal interference nor multiple mutations occur.
As beneficial mutations accumulate, the population adapts. We define the rate of adaptation,v, to be the rate at which the average fitness of the population increases. In the small-population limit, v is simply the rate at which mutations destined to establish occur times the fitness effect of these mutations.
Clonal interference analysis: We now turn to a de-scription of the first theoretical approach to the adapta-tion of large populaadapta-tions, which focuses on clonal interference and neglects the possibility of multiple mutations (Gerrishand Lenski1998; Wilke2004). In this analysis the probability that a beneficial mutation fixes is the probability that it establishes and then fixes before another more-fit mutation establishes. Gerrish and Lenski(1998) found that given that a mutation of effectshas established, the expected number of more-fit mutations establishing before the original mutation fixes is roughly
lðsÞ NUb s lnN
ð‘
‘
pðxÞrðxÞdx; ð5Þ
assuming that all mutations arise in the wild-type population. Thus the distribution of mutations that fix is
rfðsÞ ¼pðsÞelðsÞrðsÞ: ð 6Þ
The average rate at which mutations fix equals the rate at which those destined to fix occur. Thus clonal interference analysis predicts that the average fixation rateÆkæis
Ækæ¼NUb
ð‘
0
rfðsÞds: ð7Þ
This means that the rate of adaptationvis
v¼Ækæ Æsæ; ð8Þ
whereÆsæis the average fitness of mutations that fix. Multiple-mutations analysis: We now turn to a de-scription of the second theoretical framework, pro-posed by Desai and Fisher (2007), which focuses primarily on multiple-mutation effects. These and other authors studied a model where all beneficial mutations have thesamefitness advantages(Ridgwayet al.1998; Rouzine et al. 2003, 2008; Desai and Fisher 2007). They calculated the rate at which these mutations ac-cumulate, v(s), as a function of population size and mutation rate. We do not go through this calculation here, but note that in this idealized single-smodel, we can describe the state of the population as a distribution of the number of mutations each individual has. Some lucky most-fit individuals have more than the average number of mutations, and it is only additional muta-tions within this small subpopulation that will contrib-ute to the long-term evolution of the population; others will eventually go extinct because they are handicapped by their relatively poor genetic background. The mul-tiple-mutations analysis focuses on the rate at which new mutations occur in this small highly fit subpopulation and how this subpopulation evolves relative to the rest of the population. We define thelead,q, to be the number of beneficial mutations the most-fit individual possesses in excess of that of the average individual (more pre-cisely,q1 is defined to be the difference in number of mutations between the most-fit class of established in-dividuals and the mean individual). By definition, mul-tiple mutations are important whenq.1.
In a more general situation where beneficial mutations have a range of fitness effects, Desaiand Fisher(2007) argued that under many conditions SD(s) should be small compared to˜s, so that mutations within a narrow range of fitness effects dominate the evolution. If this is true, it is natural to expect that multiple mutations of effect of order˜smay routinely appear and that their accumulation can be described roughly by the single-smodel, provided one chooses that singlesto be˜sand chooses the beneficial mutation rate to these mutations, U˜b, to be the total
mutation rate to all mutations within6SD(s) of˜s. This approximation should be valid as long as SD(s) is re-latively narrow—at most of order˜s. As we will see for large populations and mutation rates, our simulations show that this is indeed the case, as do recent experimental studies in Saccharomyces cerevisiae and Escherichia coli
(Hegrenesset al.2006; Desaiet al.2007). Note that we can define the leadqin this more complex situation as the fitness of the most-fit individual minus the fitness of the mean individual, divided by˜s(more precisely, q1 is defined to be the difference in the fitness of the most-fit class of established individuals and the mean individual, divided by˜s). That is, qis the number of extra ˜s-sized mutations that the most-fit individual has compared to the average individual.
Of course, the appropriate values of˜sandU˜bdepend
on r(s), N, and the overall mutation rate. A full understanding of this depends in a subtle way on both clonal interference and multiple-mutation effects, but Desai and Fisher (2007) proposed a simple approxi-mation. They first calculatev(s) for each possible value of s, assuming that only mutations of this size are possible. To do this, one must specify an appropriate mutation rate to mutations of this size, U˜b. Desaiand
Fisher (2007) made the ad hoc assumption that U˜b should be the total mutation rate to mutations of orders
(i.e., within roughly a factor of 2 of s). They then calculatedv(s). Thisv(s) expresses the contribution of mutations of effect sto the overall evolution and thus should equalR(s), up to normalization. From thisR(s), they calculate˜s. They find
˜s¼s ‘
b1
1=b
; ð9Þ
where‘is related to the overall mutation rate by
‘¼ ln Ub sGð111=bÞ
: ð10Þ
This expression for ˜s is valid only for b . 1; for distributions of mutational effects that fall off exponen-tially or slower the behavior is more complicated and the analysis breaks down. These results were derived using a continuous-time version of our model; see Desai and Fisher(2007) for details. Note that this analysis makes no precise prediction forrf(s), but does imply thatR(s)
will be a narrow distribution centered around˜s. Using Equation 9 and their analysis of the single-s
model, Desaiand Fisher(2007) calculated how the rate of adaptationvand the leadqshould depend onNandUb
and the shape of the distribution of mutational effects by plugging in the appropriate values of˜sandU˜b. They found
q2 ln½Nsðb1Þ
‘b ; ð11Þ
and
v2Cbs2 ln½Ns
‘22=b ; whereCb[
ðb1Þ22=b
b2 : ð12Þ
RESULTS
We now describe the results of our Monte Carlo simulations for the evolutionary dynamics in large populations when both clonal interference and multi-ple mutations are present and compare these results to the theoretical predictions described above.
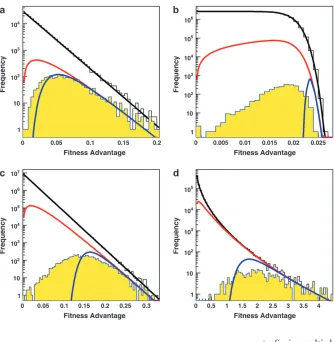
The distribution of mutations that fix: We begin in Figure 1 by showing several examples of the distribution of mutations that fix,rf(s), as compared to the
distri-bution of possible and contending mutations,r(s) and rc(s), respectively. The predictions of clonal
interfer-ence analysis, Equation 6, are also shown.
In small populations, we have seen that neither clonal interference nor multiple mutations will occur. Thus we expect the distribution of mutations that fix to equal the distribution of mutations that establish, rf(s)¼rc(s).
This is indeed the case (Figure 1a), except for extremely small s (these s are so small that clonal interference prevents them from fixing even in these small popula-tions). We find similar results for small populations regardless ofb(data not shown).
In larger populations, the behavior depends onb. In all cases, small-effect mutations are suppressed quite dramatically by clonal interference effects (Figure 1, b–d). Note, however, that clonal interference analysis predicts that this suppression of small-effect mutations should be even stronger than we observe. This is because some of these small-effect mutations are able
to fix in multiple-mutation combinations with those of larger effect. As we would expect, this effect is more dramatic for largerb, where multiple mutations play a larger role.
For large-effect mutations, clonal interference analy-sis predicts thatrf(s) should equalrc(s), regardless ofb,
since clonal interference cannot suppress the fixation of the largest-effect mutations. This is indeed the case for small b(Figure 1, c and d). However, for large b the largest-effect mutations are also suppressed (Figure 1b). This is consistent with the multiple-mutations approach of Desaiand Fisher(2007), who suggest that whenever b . 1 multiple small-s mutations can suppress the fixation of large-smutations, exactly as we observe.
We have also studied the distribution of mutations that fix using a model that includes deleterious muta-tions (seemodel and simulation methods section). We find that the distributions of beneficial mutations that fix, rf(s), are nearly identical to those shown in
Figure 1, even in the presence of deleterious mutations (data not shown). In addition to these beneficial mu-tations, a few deleterious mutations also fix. This occurs when a small-effect deleterious mutation occurs in an individual with a large beneficial mutation. However, even for deleterious mutation rates 1000-fold higher than the beneficial mutation rate, the number of delete-rious mutations that fix is a tiny fraction of the number of beneficial mutations that fix, and these deleterious mutations have a fitness cost that is small compared to Figure1.—Examples of the
distribu-tion of possible mutadistribu-tions r(s) (black line), the distribution of contending mutationsrc(s) (red line), and the
distri-bution of fixed mutationsrf(s) from our
simulations (yellow histogram). Also shown is the distribution of mutations that occurred in the simulations (white histogram). Additionally the distribu-tion of predicted fixed mutadistribu-tions rf(s) from a clonal interference calculation is shown (blue line). Note the logarith-mic scale. In all examples, s ¼ 0.02. (a) A small population, where rf(s) ¼ rc(s) except for the smallest-effect muta-tions. HereN¼33104,U
b¼105, and
b¼1.0. (b) A large population withb¼ 10. HereN ¼107 andU
b¼ 105. Note
that small-effect mutations are sup-pressed by clonal interference effects, while large-effect mutations are sup-pressed by multiple-mutation effects. (c) A large population withb¼1. Here N¼107andU
b¼105. Note that
small-effect mutations are suppressed by clonal interference effects, but less strongly than clonal interference analysis alone pre-dicts. (d) A large population with b ¼ 0.5. HereN¼13107andU
the average fitness advantage of the beneficial muta-tions that fix.
Which mutations contribute to adaptation: To ana-lyze our results across a broad range of parameters, we shift to considering the distribution of mutations that fix weighted by their contributions to adaptation,R(s). Above we have claimed thatR(s) will have a peak at some intermediate value ˜s, with some range of mutations around this that contribute substantially to adaptation. This is indeed what we find. In Figure 2, we show how˜sin our simulated populations depends on N and Ub for
several different values ofb. We compare these simu-lated results to the predictions of clonal interference analysis alone and, for b . 1, to multiple-mutations analysis. Note that clonal interference provides accurate estimates of˜sforb #1, but breaks down for largerNand
Ub, especially when b . 1. The multiple-mutations
analysis, on the other hand, more accurately predicts˜s
whenNandUbare large andb.1, but does not provide
a prediction for the caseb #1.
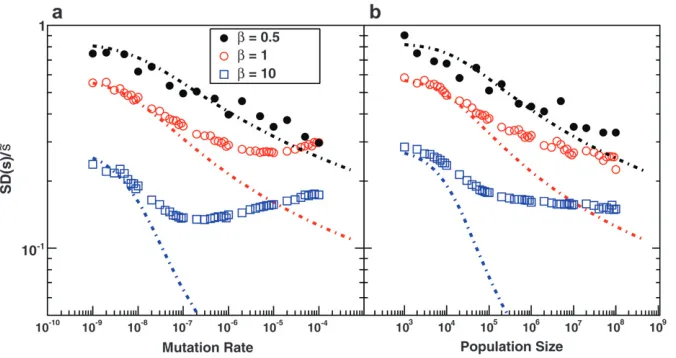
In Figure 3, we show SDðsÞ=˜sas a function ofNandUb,
again for several values of b, compared to the predic-tions of clonal interference analysis. Note that SDðsÞ=˜s>1 corresponds to the case where a narrow range of mutations around ˜sdominate the evolution. We see that this is typically the case, regardless of whether the distribution of mutational effects falls off faster or more slowly than exponentially, except for smallNorUb. However, SD(s) is not nearly as small as
clonal interference analysis predicts forb. 1. This is due to multiple-mutation effects and has consequences for the predictions of the clonal interference approach, as we describe in thediscussion.
Note that although for clarity we only show one case whereb.1 (namely,b¼10) in all the figures, we have also simulated the case b ¼ 2, and the results are qualitatively the same as those shown forb¼10.
The dynamics of adaptation: We now turn to the
dynamics by which these important mutations
accumu-late. We have seen that multiple mutations are impor-tant in determining˜sforb.1, but not so important for b #1. Despite this, mutations of effect around˜s, which dominate the overall adaptation of the population, may accumulate via multiple-mutations dynamics even when b # 1, although mutations of much larger effect fix whenever they establish. As we have seen, this will be true whenever the leadq.1.
In Figure 4, we show howqdepends onNandUbfor
several different values ofb. We see that even forb #1, these multiple mutations are important to the dynamics (where values ofq¼3–5 are reached). Forb¼10, we also show the predictions of the multiple-mutations analysis. Note that clonal interference analysis implicitly assumes no multiple mutations. Thus it implies thatqis between 1 and 2, depending on whether an established mutant group is sweeping to fixation.
As beneficial mutations accumulate, the population adapts. In Figure 5, we show how the rate at which the average fitness of the population increases,v, depends onNandUb, again for several values ofb. We compare
this to the predictions of clonal interference theory alone and to the multiple-mutations analysis of Desai and Fisher(2007).
As for Figures 2 and 3, we have also carried out simulations for the caseb¼2, and the results forqandv
are qualitatively similar to those forb¼10. In addition, we have performed a limited set of simulations that include deleterious mutations. Our results forv andq
are the same as those shown in Figures 4 and 5 for the model that excludes deleterious mutations, even when the deleterious mutation rate is orders of magnitude larger than the beneficial mutation rate.
DISCUSSION
Our Monte Carlo simulation approach allows us to study the evolutionary dynamics of adaptation in large asexual populations, where both clonal interference Figure2.—The average scaled fitness
effect of mutations that fix,˜s. In all cases s¼0.02. (a) Simulation results for˜sfor N¼107as a function ofU
bforb¼0.5
(solid black circles), b ¼ 1 (open red circles), and b ¼ 10 (open blue squares). Predictions of clonal interfer-ence analysis are shown as dotted lines, and the predictions of the multiple-mu-tation analysis (forb¼10) are shown as a solid line. Note that forb¼10,˜s de-creases withUbfor largeUb. (b)
Simula-tion results for ˜s for Ub ¼ 105 as a
and multiple mutations are important. We have de-scribed two theoretical approaches that each focus on one of these two effects. Using our simulations, we can now assess the usefulness and generality of these methods.
In its original form, which neglects the possibility of multiple mutations, clonal interference analysis pre-dicts the distribution of mutations that contribute to adaptation,rf(s), according to Equation 6. From this we can also calculate clonal interference analysis predic-tions for˜sand SD(s). Because clonal interference be-comes more likely as either population size or mutation rate increases, increasing either of these parameters is expected to increase˜s. These predictions are shown in Figures 2 and 3. Finally, we have seen that the rate of adaptation,v, predicted by clonal interference analysis is given in Equation 8. This prediction is shown in Figure 5.
Forb¼0.5 andb¼1, we see from Figure 2 that clonal interference yields reasonable estimates of˜s. This makes sense, as in this regime multiple mutations do not suppress the fixation of larger-effect mutations. Forb¼
10, clonal interference systematically overestimates˜s, by an amount that increases with the population size and mutation rate. This also makes sense, as in large populations for b ¼ 10 multiple mutations in fact suppress the fixation of large-effect mutations.
Although clonal interference accurately predicts˜sfor smallb, we can see from Figure 4 that for all values ofb,
q . 2 when N and Ub are large, pointing to the
importance of multiple mutations in the dynamics. Clonal interference analysis, by contrast, assumes that all mutations occur and fix in the wild-type population, which implies q between 1 and 2. This underlies the calculation of the fixation rate in Equation 7, which assumes that mutations in any individual can contribute to adaptation, when in fact for q . 1 it is only the mutations in the relatively rare individuals that already have other beneficial mutations that contribute. Thus we expect that neglecting the importance of multiple
mutations should lead clonal interference analysis to overestimate the rate of adaptationv, for allb. This is indeed what we find forb¼0.5, but we see from Figure 5 that clonal interference analysis accurately predictsvfor b¼1 and actually underestimates the rate of adaptation forb¼10.
The reason for this discrepancy is apparent from Figure 3, which shows that forb¼1 andb¼10, clonal interference tends to underestimate SD(s). This prob-lem gets worse asNandUbincrease. The reason for this
underestimate is that clonal interference analysis as-sumes that the largest mutation that occurs before any other fixes goes to fixation by itself. This strongly suppresses the fixation of mutations that have a sub-stantially smaller fitness effect and leads to a prediction of a very small SD(s). But in fact, mutations with a variety of smaller effects will sometimes happen to occur in individuals that have this larger-effect mutation, and these will sweep to fixation together. This broadens the distributions of mutations that fix and hence increases the actual SD(s), as is apparent in Figure 3 and in the distributions shown in Figure 1, b and c. This means that clonal interference assumes that only mutations within a much narrower range of fitness effects contribute to adaptation than is actually the case, which should lead to underestimates of the rate of adaptation. In other words, although only mutations that happen in very fit individuals can contribute (which slows adaptation), many mutations of various effects occur in these fit individuals and can all fix together (speeding adapta-tion). The underestimate ofvfrom this latter effect is more severe for largerb, because largerbcorresponds to a larger underestimate of SD(s). We see from Figure 5 that forb¼1, this underestimate ofvroughly cancels the overestimate of v caused by the assumption that mutations in any individual can contribute to adapta-tion. For b ¼ 0.5, the underestimate of SD(s) is less severe, so it only partially cancels the overestimate, and in sum clonal interference overestimates the rate of adaptation. Forb¼10, the reverse is true.
Figure 3.—The scaled width of the
weighted distribution of mutations that fix, SDðsÞ=˜s. In all cases s ¼ 0.02. (a) Simulation results for SDðsÞ=˜s for N ¼ 107 as a function of U
b for b ¼ 0.5,
b¼1, andb¼10. Predictions of clonal interference analysis are shown as dotted lines. (b) Simulation results for SDðsÞ=˜s for Ub ¼ 105 as a function of N for
Together, these results allow us to study the parameter regimes in which different aspects of clonal interfer-ence analysis are accurate. The key parameter isb. For b.1, clonal interference analysis does not accurately predict either ˜s or the shape of the distribution of mutations that fix, or the dynamics of adaptation in large populations. Forb¼1 it correctly estimates˜s, but still misunderstands the distribution of mutations that fix. Forb,1, clonal interference fares best, accurately estimating both˜sand the distribution of mutations that fix. However, even here it still does not give an accurate analysis of all quantities of interest—it wrongly asserts
q,2 and overestimates the rate of adaptation.
It should be noted that for small populations, where
NUb>1=ln½Ns, clonal interference gives an accurate
picture of all aspects of the evolution of the populations, regardless of the value ofb. This is largely because this is the regime where the small-population analysis is correct for the mutations of interest—that is, clonal interference analysis is accurate because it correctly predicts that clonal interference will not occur, except possibly among extremely small-effect mutations.
We have described above an alternative theoretical approach, focusing primarily on multiple-mutation ef-fects, which we expect to be valid when SD(s) is small compared to˜s, so that mutations within a narrow range of fitness effects dominate the evolution. We can see from our simulations that this is indeed the case (Figure 3). Desai and Fisher (2007) calculated ˜s using this ap-proach, finding Equation 9 whenb.1; the approxima-tion broke down forb #1. Using this˜s, and assuming that the mutation rate relevant tov(s) is the total mutation rate to mutations of orders, Desaiand Fisher(2007) also calculated the lead q and the rate of adaptation v, Equation 11 and Equation 12, respectively, forb.1.
We compare these theoretical predictions to our simulation results in Figures 2, 4, and 5. We see that for this b . 1 case, and large N and Ub, they give
qualitatively the correct behavior for˜s, the leadq, and the rate of adaptationv, though they do systematically
overestimatevand underestimateq(see below). In this regime, these results are more accurate than those given by clonal interference analysis. We see from Figure 4 that indeedqcan become.2, indicating that multiple mutations are often important to the dynamics. For smallN andUb, corresponding toq#2, the
multiple-mutations results are less accurate, as expected because the above results are valid only whenq*2 (Desaiand Fisher2007).
The theoretical predictions forqandv, Equations 11 and 12, rely on the ad hocassumption that the appro-priate mutation rateU˜bto the mutations around˜sthat dominate the dynamics is the total mutation rate to mutations of order˜s(i.e., within roughly a factor of 2 of
˜s). As we have found here, SD(s) is often much smaller than˜s(Figure 3), so the range of mutational effects that contributes substantially to the evolution is much smaller than assumed. This means that the intuitive picture behind the multiple-mutations model of the dynamics is correct: there is indeed a narrow range of mutations that contribute to the evolution, and their accumulation is well described by a corresponding single-smodel of the dynamics. However, the estimate of the appropriate mutation rate U˜b is too large, since a
narrower range contributes than was assumed. In addition to this, the estimate of˜sin Equation 9 is also slightly too large (Figure 2). Both of these effects mean that the prediction for vin Equation 12 should be an overestimate, as we observe in Figure 5. On the other hand, while its overestimate of U˜b should mean that
theory overestimates q, its overestimate of ˜sleads to a compensating underestimate ofq(becauseqis defined in terms of˜s). The net result of these two effects is that the theory underestimatesq(Figure 4). To correct these problems, we need to understand what determines SD(s). Unfortunately neither clonal interference anal-ysis nor the multiple-mutations approach does this well; it remains an important topic for future analytical work. Another feature of our simulation results is particu-larly striking. Both the multiple-mutations and the Figure 4.—The effective lead q. (a)
Simulation results for q as a function ofUbfor b ¼0.5, b ¼1, and b ¼ 10.
clonal interference analyses predict that ˜s should in-crease withN, because increasing the population size increases the probability of clonal interference but does not dramatically change the relative importance of large-effect mutations compared to multiple smaller-effect ones. However, for largeb, there is a qualitative difference between the predictions of the two ap-proaches for the relationship between˜sandUb. Clonal
interference analysis alone predicts that˜sincreases with
Ub, because higher mutation rates make clonal
inter-ference more common. However, higher mutation rates also increase the importance of multiple small-effect mutations relative to large-effect ones. From Equation 9 we see that forb.1 this should mean that˜sactually
decreases with Ub for large Ub. Although the effect is
small, we do in fact observe this decrease in our simulations (Figure 2a). For smallb, on the other hand, we expect that multiple-mutation effects typically do not impede the fixation of large-effect mutations. Thus clonal interference analysis gives a qualitatively accurate picture of how˜sdepends onNandUb, as observed.
While the clonal interference and the multiple-mutations approximations together help us to form a more complete understanding of the dynamics, both leave much to be desired. Clonal interference processes appear to be the main determinant of˜swhenb #1, as demonstrated by Figure 2. But even for these smallb, we see thatq is often.2, and hence clonal interference analysis gives the wrong picture for the dynamics. Further, it misses the possibility of smaller-effect muta-tions fixing together with those of effect˜sand hence drastically underestimates SD(s) even forb¼1. On the other hand, while the multiple-mutations analysis pro-vides the right picture of the dynamics forb. 1, and accurately predicts ˜s, q, and v, it provides no way to estimate SD(s) nor any specific predictions whenb #1. The simulation approach we have taken in this article sheds some light on where and why these two different approaches work and has highlighted the regimes where neither one provides a satisfactory picture. A
more detailed understanding will require analysis of a general model that explicitly incorporates both clonal interference and multiple mutations, to produce a theory that has the correct picture of the dynamics in these difficult regimes. Given that both of these effects appear likely to be widespread in microbial and viral populations (Bollbackand Huelsenbeck2007; Desai
et al. 2007; Pepin and Wichman 2008), this is an important topic for future work.
An interesting result of our simulations is that the general shape of the distribution of the mutations that contribute to adaptation,R(s), is rather universal.R(s) is always a relatively narrow distribution with a clear peak at some˜s. The distribution of mutations that fix,rf(s),
has a similar shape with a sharp peak near˜s. This means that if we do a single experiment at a given population size and mutation rate, the observed rf(s) will not
provide much information about the underlyingr(s). This lack of sensitivity of experimental adaptation to the distribution of mutational effects has been noted in a related context by Hegreness et al. (2006). However, our simulations also show that the scaling of various aspects ofrf(s) (such as˜s) with population size and mu-tation ratedoesdepend strongly onr(s). Most important is the shape of the tail ofr(s); as we have seen, the way in which˜sdepends onNandUbis strongly dependent on
b. Thus careful experiments that are carried out at a range of population sizes or mutation rates may make it possible to infer important aspects ofr(s) from meas-urements ofrf(s) or the rate of adaptationv.
As our simulations make clear, the actual values ofb applicable to natural asexual populations are of central importance to the dynamics by which these populations adapt. The values ofbfound in natural populations may also tell us something about the evolutionary history of these populations. Orr and Gillespie have argued that if an individual is at a random high-fitness genotype, the distribution of more-fit genotypes is exponential, so we should expectb¼1 (Gillespie1983, 1984, 1991; Orr 2002, 2003). However, as a population adapts it is Figure5.—The average rate of
adapta-tion,v. (a) Simulation results forvas a function of Ubforb¼ 0.5,b¼ 1, and
natural to expect r(s) to change. For example, a population may face a static challenge and gradually deplete the available beneficial mutations as it adapts. If the population were small enough thatrf(s)¼2sr(s),
the distributionr(s) should converge to an exponential as this adaptation progresses. But if clonal interference and multiple-mutation effects cause large-effect muta-tions to be depleted much faster than small-effect ones, we expect thatb should increase as the available mu-tations become depleted. Thus large observed values of bmay be indicative of this type of adaptation. Of course, this increase inbcould be avoided if the accumulation of beneficial mutations tends to open up new possibil-ities for further adaptation. In other words, the struc-ture of fitness landscapes has an important role in determining typical values ofband how these change as populations adapt. Given these values ofb, our simu-lations provide a way to understand, in a statistical sense, which mutations will tend to contribute to adaptation and the dynamics by which they will do so.
J.L.N. and C.F. acknowledge support from the University of Colorado and the Undergraduate Research Opportunity Program at the University of Colorado. M.M.D. acknowledges support from Center grant P50GM071508 from the National Institute of General Medical Science to the Lewis-Sigler Institute.
LITERATURE CITED
Bollback, J. P., and J. P. Huelsenbeck, 2007 Clonal interference is
alleviated by high mutation rates in large populations. Mol. Biol. Evol.24:1397–1406.
Campos, P. R. A., and V. M.deOliveira, 2004 Mutational effects on
the clonal interference phenomenon. Evolution58:932–937. DePristo, M. A., D. M. Weinreichand D. Hartl, 2005 Missense
meanderings in sequence space: a biophysical view of protein evolution. Nat. Rev. Genet.6:678–687.
deVisser, J. A. G. M., and D. E. Rozen, 2005 Limits to adaptation in
asexual populations. J. Evol. Biol.18:779–788.
deVisser, J., C. W. Zeyl, P. J. Gerrish, J. L. Blanchardand R. E.
Lenski, 1999 Diminishing returns from mutation supply rate
in asexual populations. Science283:404–406.
Desai, M. M., and D. S. Fisher, 2007 Beneficial mutation-selection
balance and the effect of linkage on positive selection. Genetics
176:1759–1798.
Desai, M. M., D. S. Fisherand A. W. Murray, 2007 The speed of
evolution and maintenance of variation in asexual populations. Curr. Biol.17:385–394.
Gerrish, P., 2001 The rhythm of microbial adaptation. Nature413:
299–302.
Gerrish, P., and R. Lenski, 1998 The fate of competing beneficial
mutations in an asexual population. Genetica102/103:127–144. Gillespie, J. H., 1983 A simple stochastic gene substitution model.
Theor. Popul. Biol.23:202–215.
Gillespie, J. H., 1984 Molecular evolution over the mutational
land-scape. Evolution38:1116–1129.
Gillespie, J. H., 1991 The Causes of Molecular Evolution.Oxford
Uni-versity Press, Oxford.
Haldane, J. B. S., 1927 The mathematical theory of natural and
ar-tificial selection, part v: selection and mutation. Proc. Camb. Philos. Soc.23:838–844.
Hegreness, M., N. Shoresh, D. Hartland R. Kishony, 2006 An
equivalence principle for the incorporation of favorable muta-tions in asexual populamuta-tions. Science311:1615–1617.
Hill, W. G., and A. Robertson, 1966 Effect of linkage on limits to
artificial selection. Genet. Res.8:269–294.
Imhof, M., and C. Schlotterer, 2001 Fitness effects of
advanta-geous mutations in evolving Escherichia coli populations. Proc. Natl. Acad. Sci. USA98:1113–1117.
Johnson, T., and N. H. Barton, 2002 The effect of deleterious
al-leles on adaptation in asexual organisms. Genetics162:395–411. Joseph, S. B., and D. W. Hall, 2004 Spontaneous mutations in
dip-loidSaccharomyces cerevisiae: more beneficial than expected. Ge-netics168:1817–1825.
Kassen, R., and T. Bataillon, 2006 Distribution of fitness effects
among beneficial mutations before selection in experimental populations of bacteria. Nat. Genet.38:484–488.
Kim, Y., and H. A. Orr, 2005 Adaptation in sexuals vs.asexuals:
clonal interference and the Fisher–Muller model. Genetics
171:1377–1386.
Lunzer, M., S. P. Miller, R. Felsheimand A. M. Dean, 2005 The
biochemical architecture of an ancient adaptive landscape. Sci-ence310:499–501.
Orr, H. A., 2000 The rate of adaptation in asexuals. Genetics155:
961–968.
Orr, H. A., 2002 The population genetics of adaptation: the
adap-tation of DNA sequences. Evolution56:1317–1330.
Orr, H. A., 2003 The distribution of fitness effects among beneficial
mutations. Genetics163:1519–1526.
Park, S., and J. Krug, 2007 Clonal interference in large
popula-tions. Proc. Natl. Acad. Sci. USA104:18135–18140.
Pepin, K. M., and H. A. Wichman, 2008 Experimental evolution and
genome sequencing reveal variation in levels of clonal interfer-ence in large populations of bacteriophagefx174. BMC Evol. Biol.8:85–98.
Perfeito, L., L. Fernandes, C. Motaand I. Gordo, 2007 Adaptive
mu-tations in bacteria: high rate and small effects. Science317:813–815. Ridgway, D., H. Levine and D. Kessler, 1998 Evolution on a
smooth landscape: the role of bias. J. Stat. Phys.90:191. Rokyta, D. R., P. Joyce, S. B. Caudleand H. A. Wichman, 2005 An
empirical test of the mutational landscape model of adaptation using a single-stranded DNA virus. Nat. Genet.37:441–444. Rouzine, I., J. Wakeleyand J. M. Coffin, 2003 The solitary wave of
asexual evolution. Proc. Natl. Acad. Sci. USA100:587–592. Rouzine, I., E. Brunetand C. O. Wilke, 2008 The traveling-wave
approach to asexual evolution: Muller’s ratchet and speed of adaptation. Theor. Popul. Biol.73:24–46.
Rozen, D. E., J.deVisserand P. J. Gerrish, 2002 Fitness effects of
fixed beneficial mutations in microbial populations. Curr. Biol.
12:1040–1045.
Sanjuan, R., A. Moyaand S. F. Elena, 2004 The distribution of
fit-ness effects caused by single-nucleotide substitutions in an RNA virus. Proc. Natl. Acad. Sci. USA101:8396–8401.
Wilke, C. O., 2004 The speed of adaptation in large asexual
popu-lations. Genetics167:2045–2053.