Estimation of Glass-Forming Ability and
Glass Stability of Lithium-Borosilicate Glasses
D.B.Thombre
Associate professor, Dept of Physics, Jagdamba Mahavidyalaya, Achalpur city, India
ABSTRACT: The structural theory of Glass Forming Ability was proposed with three new conditions;
Electronegativity, Hardness, Softness and Orbital potential energy difference. Glass forming ability (GFA) and glass
stability (GS) parameters are analyzed from Lithium-borosilicate ternary glass system. Amorphousness was investigated by Differential Scanning Calorimetry (DSC) and X-ray diffractometry (XRD). Differential Scanning Calorimetry was used to study the parameters KH, Kw, KLL, KT, K2, K3 and parameters like β , δ , γ and γm, are one of the most reliable and applicable GFA parameter has been established. The glass stability parameter γm shows an excellent correlation with Glass Forming Ability. Parameters are formulated by different combinations of temperatures.
The dependence of characteristic temperatures (Tg), onset crystallization temperatures (Tx) and mid point temperatures
(Tm). Good correlations between parameters are found implying a low frequency of homogeneous nucleation in the
thermally stable glasses. Statistical correlation factor R2 = 0.999. The results presented herein demonstrate that GS and
GFA are indeed related concepts.
KEYWORDS: Glass-forming ability parameter, bulk metallic glasses, Criterion;Thermal analysis, Glass stability; Sensitivity; Super cooled region; Reduced glass transition temperature.
I. INTRODUCTION
The ability of substances to vitrify on cooling from the melt is known as glass-forming ability (GFA) and is the object of theoretical and experimental investigations. Structural and kinetic methods have been proposed to understand GFA. The first structural methods were proposed in the 1920s. Latter on the proposed theories:
(1) Tamman [1] according to kinetic concepts, glasses are formed when the nucleation rate versus temperature.
(2) Goldschmidt [2], Zachariasen [3], explains the ratio of ionic radii for glass forming oxides.
(3) Zachariasen-Warren [4] claimed, glasses are easily forms polyhedral groups.
(4) Dietzel , Stanworth [5-8], included the influence of the interaction of forces between cations and anions by
introducing the term field strength F.
(5) Smekal Stanworth [9], explains the bonding in ExOyoxide.
(6) Sun’s [10], according to him in the glass forming oxides having single bond strength greater than 90 Kcalmol-1 and
modifiers have bond-strength less than 60Kcal mole-1.
(7) Viscosity, the viscosity of the glass melt can be as high as 1023 Poise. Generally, viscosity of the glass forming element must lie in the range 105 to 107 poise.
(8) Dietzel and Wiekert [11], considered stability against crystallization and how this depends on the crystal growth rate. (9) Turnbull and Cohen [12], they proposed their approach implies an infinitely fast growth rate.
(10) Gutzow [13] , studied the related glass stability (GS) to the non-steady-state time lag, τ.
(11) Uhlmann [14], A kinetic criterion for vitrification; and then extended the kinetic theory of glass formation to include non-steady state effects and heterogeneous nucleation.
(12) Weinberg [15,16,17] , He found that both GFA and GS increased with an increase of DSm and T0; however, GFA and GS moved in opposite directions (decrease of GFA and increase of GS) with an increase of E From results, Weinberg concluded that GFA and GS are ill-related concepts and Recently
[13] D.B.Thombre [18],
I
ntroducing three atomistic conditions on the basic of the current study which correlate to,three conditions can help in having better insight of the process of glass formation. These atomistic conditions are explained as below:
(I)The electronegativity:
(i) The electronegativity of glass forming elements lie in the range 1.916 to 2.253.All other elements in periodic table
have either smaller or larger values than these and so they do not fall in the category of glass formers; electronegativity difference with respect to oxygen lie in the range 1.357 to 1.694 in Pauling units respectively. (ii) The electronegativity
of glass modifier elements lies in the range 0.706 to 0.912. All other elements in periodic table have electro negativity
above 1. Hence, they are not glass modifiers; and electronegativity difference with respect to oxygen lies in the range 2.698 to 2.904 in Pauling units respectively.
(II)The absolute hardness & absolute softness:
(i) The absolute hardness and absolute softness of the glass former element lie between 3.107 to 4.869 eV & 0.205 to 0.321 eV respectively. (ii) The absolute hardness and absolute softness of the glass modifier element lie between 1.845 to 2.387 eV & 0.419 to 0.542 eV respectively. When glass formers having smaller softness value combine with modifiers having larger hardness value then only bond between them break and amorphous material is formed, which possess electrical conductivity. Lithium modifier has least softness value, than sodium and potassium are therefore, no larger breaking of bonds is possible. This way the conductivity of its alloys increases as compared to alloys that are made up of either sodium or potassium and;
(III) Orbital potential energy difference:
Orbital potential energy difference in glass forming element with oxides are lie between, 5.75 to 9.19 eV. Where as in conditional glass former lie between 5.34 to 10.55 eV. The aim of this article is, therefore, to investigate a possible correlation between GFA and GS. GFA and GS are investigated in systems that undergo homogeneous and heterogeneous nucleation. From this discussion it evident those in addition to the till date existing conditions of glass former as the outcome of the present work.
II. GLASS STABILITY PARAMETERS
There are several parameters regarding glass stability on heating. Turnbull [19] proposed a classical parameter based on the nucleation theory and used KT as a criterion for glass formation as the avoidance of a single nucleation event which is the ratio of reduced glass transition temperature Tg to the melting point temperature or mid temperature Tm.
K T T T
g m
T rg (1)
it is also called as reduced glass transition temperature (Trg).A high value of reduced glass transition temperature would result in a high viscosity in the under-cooled liquid state and consequently lead to a low critical cooling rate (Rc). According to Zanotto[20] glass having reduced glass transition temperature (Trg) higher than or in the range0.58-0.60 display only heterogeneous crystallization, where as lying below the range 0.58-0.60 display homogeneous nucleation. Earlier, Kauzmann [21] had also mentioned the significance of this same ratio. On the basis of thermal stability associated with the glass transition temperature (Tg), and onset (Tx) crystallization temperature Inoue et.al.[22,23] gave a another glass-forming ability indificator.
2
K T T T
x x g
(2)
The temperature difference Tx–Tg is a good indication of thermal stability because the higher the value of this difference, more the delay in the nucleation process [24]. It is also denoted by ΔTx. Latter on Weinberg
[25]
was introducing another parameter, know as Weinberg parameter Kw or also denoted by
.
KW T T Tm
x g
(3)
where, Tx is onset temperature and Tm is melting point temperature or mid temperature. Hruby [26]suggested a Glass-forming ability parameter as (KH = Kgl) is also used as a measure of glass-forming tendency given by,
K K T T T T
K T T T
x g m
LL (5)
which was analyzed for 49 metallic glasses, 23 oxide glasses and 25 cry protective aqueous solutions, showing reasonable, but not excellent, correlations with the respective critical cooling rates obtained by different methods and several authors, it is also called as γ parameter. Larger values of KH, Kw and KLL parameters imply higher stability of glass in respect to devitrification. Glass Stability Parameters proposed by Nascimento et al. [31] are
1
K T T
m g
(6)
3
K Tx Tm
(7)
Angell [32]was the first to suggest that K2 (ΔTx) is a good indicator of GS. Drexhage et al. [33], Almeida and Mackenzie
[34], Cooper and Angell [35]also reached similar conclusions. With the GFA of various glass formers among the
parameters suggested so far are,
α- Parameter: α- parameter can be expressed as:
T T x m
OR
T T T T T T T T T K K GS GFA
x m g m x g m g m W T
(8)
i.e. α includes glass stability and glass forming ability.
β- Parameter: β- Parameter is expressed as:
(T /T ) (T /T )
x g g m
(9)
γm- Parameter: γm- Parameter is expressed as:
2T T
Tx g m
m
(10)
γm and KH has the same trends as that of GFA i.e. as ΔTx and that of Trg
δ- Parameter: δ- Parameter is defined as,
Tx Tm Tg
(11)
III.1 EXPERIMENTAL
Table III.1 showing compoion in mol %
IV.1 EXPERIMENTAL RESULT AND DISCUSSIONS
IV.1.1 XRD INVESTTIGATIONS
The glass samples of system examined by XRD are shown in Figure IV.1.1
Figure IV.1.1 A typical plots of XRD of sample LBS 1.1.
Figure IV.1.1 shows a broad halo which characteristic of the amorphous structure at around diffraction angle (2θ) ≈ 20o to be fully amorphous indicating that these glass samples are composed of glassy phase. This indicates the absence of long range of atomic arrangement and also the periodicity of the three-dimensional network in the quenched materials.
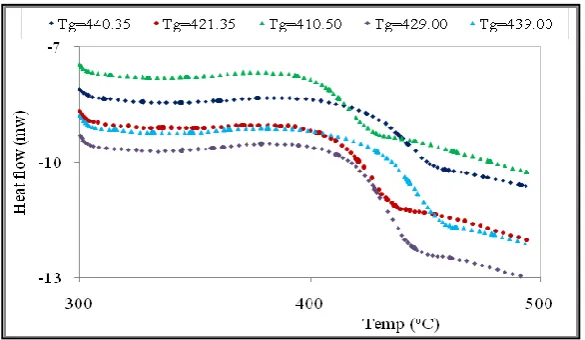
IV.2 DIFFERENTIAL SCANNING CALORIMETERY
Figure IV.2.1 Thermogram patterns of DSC
System LBS Li2O B2O3 SiO2
LBS I.1 42.5 57.5 0
LBS I.2 42.5 52.5 5
LBS I.3 42.5 47.5 10
LBS I.4 42.5 37.5 20
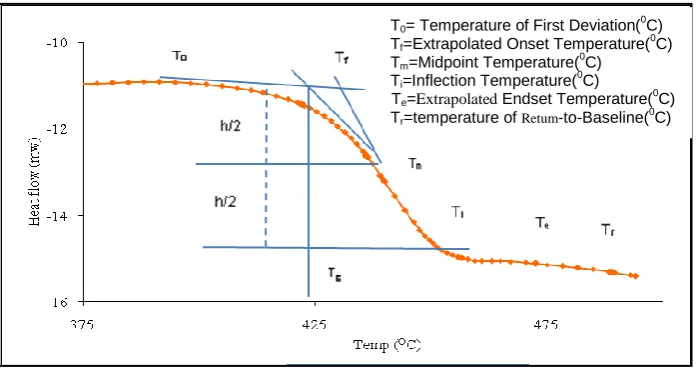
Figure IV.2.1, shows the thermograms of system and it is observed that there are no maximum or minimum peaks which represent the absence of crystallization and heat of fusion temperatures. A typical thermogram for determine the values of different temperatures is shown in Figure IV.2.2 as below;
Figure IV.2.2 Determination of To, Tf , Tm , Ti ,Te ,Tr from DSC thermogram Plot.
The temperature of first derivative (To), Extrapolated onset temeperature (Tf=Tx), Midpoint temperature (Tm), midpoint temperature Tm founds to be higher than glass transition Tg temperature. This indicates that after annealing glass molecules are stable, which proves that these are strong glass forming systems. Inflection temperature (Ti), Extrapolated endset temperature (Te), Teperature of return- to- Base line (Tr) are noted from the DSC thermogram plot as shown in Figure IV.2.2. The glass transition temperature is a temperature taken to represent the temperature range over which the glass transition taked place. Therefore, in the present case for the further work measurrements are recorded in the temperature range To-Tm in for each system. From the above values glass stabiltiy (GS) parameters are determined.The values of Tx,Tm,Tg are determined from DSC thermogram and listed in Table IV.2.2.
Table IV.2.2. Temperatures in oC of T
x,Tm and Tg .
Table IV.2.2.Shows the values of Temperatures in oC of Tx,Tm and Tg determined from DSC termogram.
System LBS Tx oC Tg oC Tm oC
LBS I.1 437.00 430.50 441.57
LBS I.2 429.45 422.19 434.29
LBS I.3 435.56 430.52 441.57
LBS I.4 410.41 402.78 414.24
LBS I.5 437.87 430.10 442.22
T0= Temperature of First Deviation(0C)
Tf=Extrapolated Onset Temperature(0C)
Tm=Midpoint Temperature(0C)
Ti=Inflection Temperature( 0
C)
Te=Extrapolated Endset Temperature(
0
C) Tr=temperature of Retum-to-Baseline(
0
Table IV.2.3: Values of KH, KW, KLL, K2, and K3.
System LBS Kw =
KH = Kgl KLL= γ K3= α K2= ΔxLBS I.1 0.014720203 1.4223195 0.5011066 0.9896506 6.50
LBS I.2 0.01671694 1.5 0.5014128 0.9888554 7.26
LBS I.3 0.011413819 0.8386023 0.4994439 0.9863895 5.04
LBS I.4 0.018419274 1.9921671 0.5023255 0.9907542 7.77
LBS I.5 0.01757044 1.7862069 0.5019603 0.9901633 7.63
Table IV.2.3.Shows the values of KH, KW, KLL, K2, and K3 determine by using above standered equations.
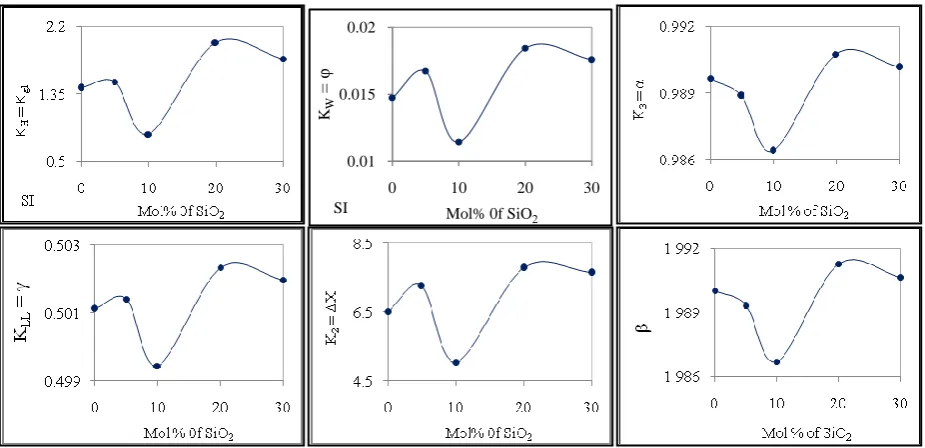
Figure IV.2.3: variation of KH, KW, KLL, K2, K3 and β with mol % of SiO2.
From Table IV.2.3 and Figure IV.2.3 it is observed that the variation of KH, KW, KLL, K2, K3 and β are alike with their good correlations. It is observed that the values of KH, KW, KLL, K2, K3 and β are increases with increasing the mol % of SiO2, Indicating increase of GS and GFA. At 10 mol % of SiO2 the values of these parameters is minimum indicating the decrease in GS and GFA. At 20 mol % these parameters have maximum values indicating the increases in GS and GFA; out of these parameters maximum value of the KH (=1.992) K2 (=ΔX=7.77) and β (1.991), indicates the greater stability of the glass against devitrification on heating, and can be used to estimate the glass-forming ability (GFA) on cooling. So, a strong correlation between GS and GFA parameter is concluded. Hence the KH, KW, KLL, K2, K3 and β parameter assess GS and GFA.
0.01 0.015 0.02
0 10 20 30
KW
=
φ
Mol% 0f SiO2
Table IV.2.4: The values of α, β, δ, γmwith mol % of SiO2.
System
LBS β δ γm
LBS I.1 1.990029 0.53270953 0.9838
LBS I.2 1.989334 0.558845507 0.9805
LBS I.3 1.986682 0.535655724 0.9757
LBS I.4 1.991278 0.540427407 0.9817
LBS I.5 1.990658 0.539893617 0.9839
Table IV.2.3.Shows the values of β, δ, γm determine by using above standered equations.
Figure III.2.4: variation of α, β, γ and γm with mol % of SiO2.
From Table IV.2.4 and Figure IV.2.4 it is observed that the variation of δ and γ are alike with their good correlations then increases, at 5 mol % gives maximum value. The α and γm parameters are minimum at 10 mol% of SiO2. Increasing, decrease the values of δ & γ and α & γm gives rise increasing, decrease the values of GS and GFA; gives a strong correlation between GS and GFA parameter is concluded. Hence the second α, γ, δ, γm parameter assesses GS and GFA. α parameter is the summation of glass stability and glass formation where as, β is the summation of glass forming tendency and thermal stability; shows liner relation between them having R2 value equal to 0.999. Lastly summerise the conclussion of this material by comparing the GS and GFA parameters it gives rise very good nature.
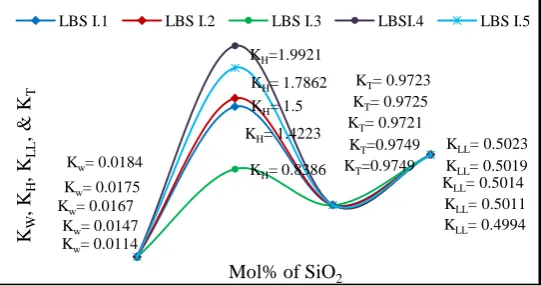
Figure IV.2.5: Comparative study of GS & GFA parameters KW, KH, KT and KLLfor systemLBSI.1 to LBSI.5.
y = 1.048x + 0.953 R² = 0.999
1.98 1.99 2
0.986 0.9885 0.991
β
α
SI
Kw= 0.0147
KH= 1.4223
KLL= 0.5011
KT=0.9749
Kw= 0.0167
KH= 1.5
KLL= 0.5014
KT= 0.9721
Kw= 0.0114
KH= 0.8386
KLL= 0.4994
KT=0.9749
Kw= 0.0184
KH=1.9921
KLL= 0.5023
KT= 0.9723
Kw= 0.0175
KH= 1.7862
KLL= 0.5019
KT= 0.9725
KW
,
KH
, K
LL
,
&
K
T
Mol% of SiO2
Comparative study of GS & GFA parameters KW KH, KT and KLL, of glass system LBS.I.1 to LBS I.5 (Figure IV.2.5).On the variation of mol % of SiO2 the KW values increases slowly KH will have significant maximum values, KT decreases and KLL values slowly increases. The difference is very small therefore, in comparative study they are at a point.
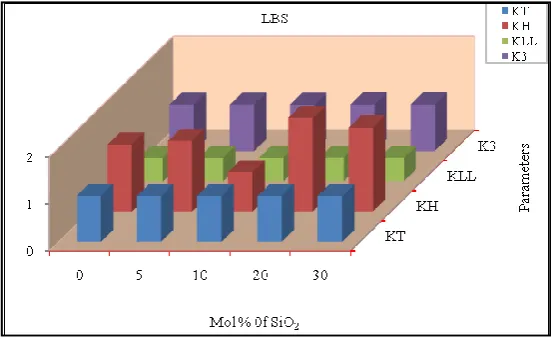
Figure III.2.6: Comparative study of GFA parameters KH, KW, KLL, and K3 for systemLBSI.1 to LBSI.5.
Similarly the comparative study of KH, KT, KLL, and K3 parameters are shown in 3-D so that we can observe the actuual ocation of parameters simantansally.
V.CONCLUSION
It is concluded that there are also the new very good three atomistic conditions we proposed here, which helps for GFA and GS. The parameters KH, KW, KLL, K2, K3and α, β, δ, γ, γm calculated by using the standered equations satifies the very exculant results for the glass forming ability and glass stability. 3-D helps to obser the simaltanious positions of GFA and GS parameters. The γmparameter also reflects the effects of Tg, Tx, and Tlwhich are basically measured upon devitrification of glassy samples, the same as the previous γm parameter. However, the present result shows that the γm parameter exhibits the best correlation with GFA among all parameters suggested so far. This is because the current indicator correctly considers all related factors for the liquid phase stability and the crystallization resistance during glass formation. Since the γmparameter can be calculated simply by data on Tg, Tx, and Tl, the current parameter is a simple and user-friendly indicator. The sample LBS I.4 has very excellent GS and GFA parameter values; this sample also has higher conductivity 7.5318*10-3 SCm-1at 400 OC.
REFERENCES
[1] G. Tamman, Die Aggregatzustaende, Leopold Voss, Leipzig,1922.
[2] V. Goldschmidt, Skrifter Norske Videnskaps. Akad. (Oslo) I, Matematisch-Naturwiss. Klasse 1 (1926) 7.
[2] Goldschmidt V M 1926 Naturwiss 21477
[3] W. Zachariasen, J. Am. Chem. Soc. 54 (1932) 3841.
[4] Zachariasen W H 1932 J. Am. Chem. Soc. 543841
[5] Dietzel A 1941 Naturwiss 29 537
[6] Stanworth J E 1946 J. Soc. Glass Technol. 3054
[7] Stanworth J E 1948 J. Soc. Glass Technol. 32 154,366
[8] Stanworth J E 1952 J. Soc. Glass Technol. 36217
[9] Smekal A 1951 J. Soc. Glass Technol. 35411
[10] Sun K H 1947 J. Am. Ceram. Soc. 30277
[11] A. Dietzel, H. Wiekert, Glastech. Ber. 29 (1956) 1.
[12] D. Turnbull, M. Cohen, in: Mackenzie (Ed.), Modern Aspects of Vitreous State, 1960, p. 38. [13] I. Gutzow, J. Schmelzer, The Vitreous State, Springer, 1995.
[15] M.C. Weinberg, E.D. Zanotto, Phys. Chem. Glasses 30 (1989) 110.
[16] M.C. Weinberg, D.R. Uhlmann, E.D. Zanotto, J. Am.Ceram. Soc. 72 (1989) 2054.
[17] D.R. Uhlmann, B.J.J. Zelinski, E.D. Zanotto, M.C. Weinberg, Sensitivity of critical cooling rate to model and material parameters, Proceedings of the XV International Congress on Glass, Leningrad, USSR, July, 1989, vol. 1A, p. 156.
[18] D.B.Thombre, Ph.D.Thesis on Study of Lithium-borosilicate glassy solid electrolyte based on Molecular Orbital Theory (MOT). [19] [1] D. Turnbull, Contem. Phys. 10 (1969) 473.
[20] E. D. Zanotto and F. A. B. Coutinho, “How Many Non-crystalline Solids Can Be Made From All the Elements of the Periodic Table?”, J.Non-Cryst. Solids 347 [1-3] 285-288 (2004).
[21][2] W. Kauzmann, Chem. Rev. 43 (1948) 219.
[22] A. Inoue, T. Zhang, and T. Masumoto, J. Non-Cryst. Solids 156–158, 473 _1993_.
[23] A. Inoue, B. Shen, A. Takeuchi, Fabrication, properties and applications of bulk glassy alloys in late transition metal- based systems, Materials Science and Engineering A 441 (2006) 18-25.
[24] N.Mehta, R.S.Tiwari, A.Kumar, Mater. Res. Bull., 41, 1664 (2006).
[25]M.C. Weinberg, Phys. Chem. Glasses 35 (1994) 119.
[26]A. Hruby¨, Czech J. Phys. B 22 (1972) 1187.
[27]Z. P. Lu and C. T. Liu, Acta Mater. 50, 3501 _2002_. [28] P. Lu and C. T. Liu, Phys. Rev. Lett. 91, 115505 _2003_. [29] P. Lu and C. T. Liu, Intermetallics 12, 1035 _2004_. [30] P. Lu, H. Bei, and C. T. Liu, Intermetallics _in press_.
[31] M. L. F. Nascimento, L. A. Souza, and E. D. Zanotto, J. Non-Cryst. Solids 351, 3296 _2005_. [32] C.A. Angell, 2nd Int. Symp. Halide Glasses, Troy, New York (1983).
[33] M.G. Drexhage, O.H. El-Bayoumi, H. Lipson, C.T. Moynihan, A.J. Bruce, J. Lucas, G. Fonteneau, J. Non-Cryst. Solids 56 (1983)51. [34] R.M. Almeida, J.D. Mackenzie, Glastechn. Ber. 56K (1983) 850.