Genotyping Error Detection Through Tightly Linked Markers
Guohua Zou, Deyun Pan and Hongyu Zhao
1Department of Epidemiology and Public Health, Yale University School of Medicine, New Haven, Connecticut 06520-8034
Manuscript received May 17, 2002 Accepted for publication March 19, 2003
ABSTRACT
The identification of genotyping errors is an important issue in mapping complex disease genes. Although it is common practice to genotype multiple markers in a candidate region in genetic studies, the potential benefit of jointly analyzing multiple markers to detect genotyping errors has not been investigated. In this article, we discuss genotyping error detections for a set of tightly linked markers in nuclear families, and the objective is to identify families likely to have genotyping errors at one or more markers. We make use of the fact that recombination is a very unlikely event among these markers. We first show that, with family trios, no extra information can be gained by jointly analyzing markers if no phase information is available, and error detection rates are usually low if Mendelian consistency is used as the only standard for checking errors. However, for nuclear families with more than one child, error detection rates can be greatly increased with the consideration of more markers. Error detection rates also increase with the number of children in each family. Because families displaying Mendelian consistency may still have genotyping errors, we calculate the probability that a family displaying Mendelian consistency has correct genotypes. These probabilities can help identify families that, although showing Mendelian consistency, may have genotyping errors. In addition, we examine the benefit of available haplotype frequencies in the general population on genotyping error detections. We show that both error detection rates and the probability that an observed family displaying Mendelian consistency has correct genotypes can be greatly increased when such additional information is available.
T
HE problem of genotyping errors has received and the fact that recombination is an unlikely event much attention in human genetics because of its among these markers. In our analysis, the objective is importance in the analysis and interpretation of genetic to identify families, not individual markers, that likely data from linkage and association studies.Terwilliger have genotyping errors with the hope that these families et al. (1990), Buetow (1991), Shields et al. (1991), will be followed up for error checking.Goldsteinet al. (1997),Gordonet al. (1999), andAkey Mendelian consistency is the most common criterion et al. (2001) investigated the effects of genotyping errors for identifying genotyping errors. Families that fail the on various aspects of genetic data analysis. Lincoln Mendelian-consistency check should be flagged out for and Lander (1992), Ott (1993), Ehm et al. (1996), error checking. In the case of single markers,Gordon Stringhamand Boehnke (1996), Ehm and Wagner et al. (1999, 2000) calculated the probabilities that the (1998), O’ConnellandWeeks(1998),Douglaset al. erroneous trio genotype and quartet and quintet geno-(2000, 2002), andSobelet al. (2002) proposed various types can be detected on the basis of the Mendelian-methods to detect genotyping errors. Broman and consistency criterion. They found that the error
detec-Weber(1998),Go¨ ringandTerwilliger(2000a,b,c,d), tion rates are very low.Douglaset al. (2002) calculated
Gordonand Ott (2001), Gordon et al. (2001), and the error detection rates in nuclear families by assuming
Sobel et al. (2002) developed statistical methods for that there is exactly one genotyping error per family. incorporating genotyping errors in the analysis of geno- However, these studies examined only error detections type data. Although it is common practice to genotype for a single marker, and it is worthwhile to study the multiple tightly linked markers in a candidate region, benefit of considering two or more tightly linked genetic the use of joint information from these markers to de- markers. In the absence of phase information and when tect genotyping errors has not been investigated in the the genotyping error rate is not very high, we show that literature. In this article, we discuss this issue for nuclear there is little to gain from considering multiple tightly families when both parents are available. We call these linked markers for family trios if Mendelian consistency closely spaced markers “multiple tightly linked markers” is the error checking criterion. However, when there is to emphasize their close proximity on a chromosome more than one child, error detection rates can be greatly increased by adding markers and including additional children in each family. Instead of calculating error 1Corresponding author: Department of Epidemiology and Public
detection rates, we also examine the problem of estimat-Health, Yale University School of Medicine, 60 College St., New Haven,
CT 06520-8034. E-mail: [email protected] ing the probability that a family displaying Mendelian
consistency has correct genotypes. These probabilities genotypes show Mendelian consistency, and this set is denoted byS.
may be more relevant than error detection rates as these
We now define Mendelian consistency for two or probability calculations allow the researchers to
priori-more markers. If phase is known in both parents, let tize families if they are willing to confirm genotypes
(HP
1,HP2) denote the two haplotypes in the father, and
through replicate genotypings. We further consider the
(HM
1,HM2) denote the two haplotypes in the mother. For
benefit of having information on population haplotype
tightly linked markers, we say the trio is Mendelian frequencies. We find that both error detection rates
consistent if the child has one of the following geno-and the probability that a family displaying Mendelian
types, (HP
1,HM1), (HP1,HM2), (H2P,HM1), or (HP2,HM2);i.e.,
consistency has correct genotypes may be greatly
in-each parent passes one of the two whole haplotypes creased if such additional information is available.
intact to the offspring. We expect this to be the case, in general, for tightly linked markers as recombinations are unlikely among them.
METHODS
However, phase information is usually unknown. In In this section, we discuss our methods for deriving
this case, genotypes analytical results of error detection rates for two tightly
linked markers and the probability that a family
dis-冢
1 2 12
冣
and冢
1 2 2 1冣
playing Mendelian consistency has correct genotypesfor family trios with one or two markers. We then outline
are not distinguishable. It is important to keep this in our simulation procedures for nuclear families with
mul-mind when we calculate the error detection rate and tiple children, multiple markers, and multiple alleles.
the probability that a family trio displaying Mendelian
Error detection rates for family trios with two
mark-consistency has correct genotypes. For phase-unknown
ers:Consider family trios where each individual is typed
data, there may be multiple haplotype sets in the parents at two biallelic markers. The two markers, denoted by
that are consistent with the observed genotypes across
ᏭandᏮ, have allelesA1/A2andB1/B2, respectively. For
the set of markers. In this case, we say that the trio is simplicity, in the following discussion we denoteA1and
Mendelian consistent if one of the haplotype sets is A2by 1 and 2, respectively, and similarly denoteB1and
Mendelian consistent in the sense defined above for B2by 1 and 2, respectively.
phase-known data. We use 2⫻2 matrices to denote two-marker diploid
For genotyping errors, we assume that errors are in-genotype data, where elements in each column
repre-troduced independently. At markerᏭ, the genotyping sent the two alleles at the same marker. When phase
error rate from true allele 1 to erroneous allele 2 ise1
information is known, elements in the same row
repre-and from true allele 2 to erroneous allele 1 is e2. At
sent the alleles on the same chromosome, and the two
markerᏮ, the genotyping error rates from 1 to 2 and rows are exchangeable. For example, matrices
from 2 to 1 areε1andε2, respectively. This general error
model includes the stochastic error model (e1 ⫽ e2 ⫽
冢
1 2 12
冣
and冢
2 1 21
冣
ε1⫽ε2) and the directed error model (e2⫽ε2⫽0) asspecial cases (Akeyet al. 2001).
both represent an individual with one chromosome car- For each trio genotypeM, 0–12 errors may be intro-rying (11) and one chromosome carintro-rying (22). We duced for two markers in a family trio. We say a family make no distinction between these two matrices in our has undetected errors if the trio is Mendelian consistent. following discussion. In addition, no distinction is made The probability that the errors are not detected via a between parent 1 and parent 2. For example, the trio Mendelian-consistency check, when there is at least one
genotypes error, is
 ⫽
兺
12i⫽1
P(undetected errors|ierrors in trio)P(ierrors in trio|iⱖ1),
冢冢
1 1 1 1冣冢
1 2 2 2冣冢
1 1 12
冣冣
(1)and where the first conditional probability can be calculated as
P(undetected errors|ierrors in trio)
冢冢
1 2 2 2冣冢
1 1 1 1冣冢
1 1 12
冣冣
⫽兺
M僆S
P(undetected errors|ierrors inM)P(M|ierrors in trio)
are regarded as equivalent. For a family with genotype
⫽
兺
M僆S
P(undetected errors|ierrors inM)P(ierrors inM) M, we define the conjugate ofM, denoted byM, as the
genotype with each 1 inMreplaced by 2 and each 2 in
·P(M)/P(ierrors in trio), Mreplaced by 1 (Gordonet al. 2000). For each
individ-ual, 10 distinct matrices correspond to 10 possible haplo- where S is the set of all family trio genotypes. Thus, Equation 1 is simplified to
ble haplotype pairs and (b) if yes, determine possible
 ⫽
兺
12i⫽1M
兺
僆SP(undetected errors|ierrors inM)
haplotype pairs for other children based on this pair. If none of the haplotype pairs for the first child is
·P(ierrors inM)P(M)/[1⫺P(no error in trio)]. (2)
consistent with the parents’ haplotype pairs, then we The calculations of the probabilities thatierrors exist say we have detected genotyping errors. Otherwise, in genotypeMand no error exists in trio in Equation 2 we collect all the possible haplotype pairs for other are discussed inappendix a. Note that for the stochastic children based on the first child and call this setC1. error model, the probabilities that any trio genotype 3. Consider child 2 in the family. If no haplotype pairs hasierrors are the same. In this case, Equation 2 reduces consistent with this child’s genotype belong to C1, to that inGordonet al. (2000). then genotyping errors are detected. Otherwise, dis-In our calculations, we first calculate P(undetected card the haplotype pairs that are not consistent with errors|ierrors in M) for 1 ⱕ iⱕ 6, and for the cases the second child’s genotype and call the remaining of 7ⱕiⱕ12, we can obtain the probabilities through setC2.
the conjugate genotype M and the following lemma. 4. Repeat steps 2 and 3 until thenth child (assuming Results similar to Lemma 1(i) were derived byGordon this family has n children) is checked and we end
et al. (1999, 2000). The values of the probabilityP(M) up with a setC
n. IfCnis empty, the errors are detected.
and the conditional probability P(undetected errors|i Otherwise, the whole family is consistent with Mende-errors inM) (1ⱕiⱕ6) are available from the authors lian inheritance.
upon request.
To estimate error detection rates, we base our results
Lemma1. (i)For any trio genotype M and for any i,0ⱕ on 100,000 simulations for single markers, 10,000 simu-iⱕ 12, we have(a)P(undetected errors|i errors in M)⫽ lations when the number of markers is two or three, and P(undetected errors|i errors in M) and (b) P(undetected 5000 simulations when there are four markers. Different errors|i errors in M)⫽ P(undetected errors|12 ⫺ i errors numbers of simulations are used because the true error in M). detection rates vary according to the number of mark-(ii)If P(M) ⫽ f(p11, p12, p21, p22), where f is a function of ers, with lower detection rates for smaller numbers of
p11, p12, p21, and p22; and pij is the frequency of haplotype markers. Therefore, a larger number of simulations are
ij, where i, j ⫽1, 2; then
necessary when the number of markers is smaller.
Probability that a family trio displaying Mendelian
P(M)⫽f(p22,p21,p12,p11).
consistency has correct genotypes:In addition to
calcu-Error detection rates for nuclear families with more
lating error detection rates, another quantity that is
than one child and more than two markers: For the
of relevance is the probability that an observed trio general case of multiple children, multiple markers, and
displaying Mendelian consistency has correct geno-multiple alleles, we conduct simulation studies to obtain
types. We first discuss the single-marker case. There are error detection rates as follows:
a total of nine trio genotypes with one marker, which is denoted byS0. We use similar notation on trio
geno-1. We generate the genotypes of the parents according
types as in the two-marker case. For example, the follow-to a set of haplotype frequenciespi1...ik(i1 ⫽ 1, . . . ,
ing trio genotypes are considered equivalent: I1; . . . ; ik ⫽ 1, . . . , Ik), where k is the number of
tightly linked markers, andIjis the number of alleles
at markerj. On the basis of parental haplotypes, we
冢冢
1 1冣冢
1 2
冣冢
1
2
冣冣
and冢冢
1 2冣冢
1 1
冣冢
1 2
冣冣
. simulate haplotype pairs in the children by randomlyassigning one of the two haplotypes in each parent to
With similar genotyping error models, we can derive each child. Then we introduce errors independently
the probability thati errors are introduced in the trio into the alleles of parents and children according to
in the one-marker case. Note that “an observed trio a given error model. On the basis of the resulting
has correct genotypes” is not equivalent to “there is genotypes for the parents in the nuclear family, we
no genotyping error in the trio.” For example, for an obtain all haplotype pairs that are consistent with
individual with genotype 12 at one marker, there may the genotypes of the parents.
be two errors with 1→2 and 2→1, but the observed 2. We number the children in the family by the number
genotype is true. of homozygous sites; e.g., after numbering, child 1
For an observed genotypeMthat is Mendelian consis-in the family has the largest number of markers with
tent, the probability that it is the true genotype is given two identical copies of an allele. For the first child,
by we consider all possible haplotype pairs that are
con-sistent with this child’s genotype. For each haplotype
P(T⫽M|O⫽M)⫽P(O⫽M|T⫽M)P(T⫽M)
P(O⫽M) , (3)
pair in the consistent haplotype pair set, we use the procedure described in appendix bto (a) identify
genotype is M, and P(O ⫽ M) is the probability that ε2). Then P(T⫽ M0|O ⫽ M0)⫽ h(p22, p21, p12, p11, e2,
the observed trio genotype isM, which is e1,ε2,ε1).
P(O⫽M)⫽
兺
M⬘僆S0P(O⫽M|T⫽M⬘)P(T⫽M⬘), (4)
RESULTS
where the set ofS0was defined above. An example for
Error detection rates for family trios:Let the frequen-calculating the conditional probability P(T ⫽ M|O ⫽
cies of alleles 1 and 2 at markerᏭ be p1⫹ andp2⫹ (⫽
M) is provided inappendix c.
1⫺ p1⫹), respectively. Similarly, we denote the marker
In general, in addition to calculating P(T⫽ M|O ⫽
allele frequencies at marker Ꮾ byp⫹1 andp⫹2,
respec-M) for a given genotype, we can also calculate theoverall
tively. The haplotype frequencies are denoted byp11,p12,
probability that a Mendelian-consistent family trio has
p21, andp22, respectively. For different sets of haplotype
correct genotypes by summing over all possible
geno-frequencies, we summarize the results in Table 1 when types:
the error rates are assumed to be the same. The results
P(true|a Mendelian-consistent trio)⫽兺M僆S0P(T⫽M,O⫽M)
兺M僆S0P(O⫽M)
are qualitatively similar when the error rates differ (data not shown). In addition, we considered the following three cases in more detail.
⫽兺M僆S0P(T⫽M|O⫽M)P(O⫽M)
兺M僆S0P(O⫽M)
.
(5) 1. Linkage equilibrium: In this case,p11⫽p1⫹p⫹1,p12⫽ p1⫹p⫹2,p21⫽p2⫹p⫹1, andp22⫽p2⫹p⫹2.
It is readily seen that Equation 5 can also be expressed as
2. Perfect linkage disequilibrium (equal allele frequen-cies): In this case, only two of the four possible
haplo-P(true|a Mendelian-consistent trio)⫽兺M僆S0P(O⫽M|T⫽M)P(T⫽M)
兺M僆S0P(O⫽M)
.
types are present in the population. Without loss of generality, we assume that p11⫽p1⫹⫽ p⫹1,p12⫽ 0,
In deriving the probabilities, we use the following
p21⫽0, and p22⫽ p2⫹⫽ p⫹2.
lemma for the one-marker case.
3. Complete linkage disequilibrium (unequal allele
fre-Lemma2. (i)Let P(O⫽M0|T⫽M)⫽u(e1, e2). Then(a) quencies): In this case, three of the four haplotypes
P(O⫽M0|T⫽M)⫽u(1⫺e1, 1⫺e2)and(b)P(O⫽ are present in the population. Without loss of
gener-M0|T⫽M)⫽u(1 ⫺e2, 1⫺e1). ality, we assume haplotypes 11, 12, and 21 are
(ii) Let P(T ⫽ M0|O ⫽ M0)⫽ v(p, e1, e2). Then P(T ⫽ present.
M0|O ⫽ M0) ⫽ v(q, e2, e1), where p is the frequency of
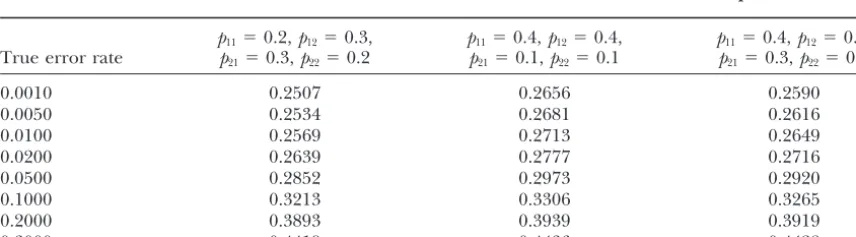
allele1and q⫽1⫺p. Table 1 and the results for the above three special cases (data not shown) indicate that the error detection For the case of two markers, 125 distinct trio genotypes
rates are generally low when the error rates are low if display Mendelian consistency in the absence of phase
Mendelian consistency is the criterion for error check-information. The general results (3) and (4) still hold.
ing. When the error rates are high (⬎20%), the error In the calculation of terms in (3) and (4), using the
detection rates based on two markers can be signifi-same genotyping error model discussed before, we have
cantly higher than those based on single markers, even higher than those for the case of quartet considered by
Lemma3. (i) Let P(O ⫽ M0|T⫽ M)⫽ g(e1, e2, ε1, ε2).
Gordonet al. (2000). However, such high error rates Then (a)P(O ⫽M0|T⫽ M)⫽ g(1⫺ e1, 1⫺ e2, 1⫺
are not common in practice. Compared to the results ε1, 1⫺ε2)and(b)P(O⫽M0|T⫽M)⫽g(1⫺e2, 1⫺
for single markers (Gordon et al. 1999), considering e1, 1⫺ε2, 1⫺ε1).
(ii)Let P(T⫽M0|O⫽M0)⫽h(p11, p12, p21, p22, e1, e2,ε1, two markers only slightly increases the error detection
TABLE 1
Error detection rates for trios with two markers whene1,e2,ε1, andε2are all equal
p11⫽0.2,p12⫽0.3, p11⫽0.4,p12⫽0.4, p11⫽0.4,p12⫽0.2,
True error rate p21⫽0.3,p22⫽0.2 p21⫽0.1,p22⫽0.1 p21⫽0.3,p22⫽0.1
0.0010 0.2507 0.2656 0.2590
0.0050 0.2534 0.2681 0.2616
0.0100 0.2569 0.2713 0.2649
0.0200 0.2639 0.2777 0.2716
0.0500 0.2852 0.2973 0.2920
0.1000 0.3213 0.3306 0.3265
0.2000 0.3893 0.3939 0.3919
TABLE 2
Error detection rates for nuclear families withnchildren andkmarkers when the markers are in linkage equilibrium
n k⫽1 (p⫽p1*) k⫽2 (p⫽p2*) k⫽3 (p⫽p3*) k⫽4 (p⫽p4*)
1 0.3059 0.3064 0.3209 0.3217
2 0.4325 0.5076 0.5669 0.5898
3 0.5042 0.5640 0.6381 0.7111
4 0.5510 0.6248 0.6789 0.7379
5 0.5808 0.6254 0.7414 0.7937
6 0.5942 0.7014 0.7546 0.8137
The true error rate is 0.01 and the allele frequencies are unequal.
p1*⫽(0.9, 0.1)
p2*⫽(0.81, 0.09, 0.09, 0.01)
p3*⫽(0.729, 0.081, 0.081, 0.009, 0.081, 0.009, 0.009, 0.001)
p4*⫽(0.6561, 0.0729, 0.0729, 0.0081, 0.0729, 0.0081, 0.0081, 0.0009, 0.0729, 0.0081, 0.0081, 0.0009, 0.0081, 0.0009, 0.0009, 0.0001).
rate when the error rates are low (ⱕ5%). This is not genotypes. It is easy to see that, although the two one-marker quartet genotypes
unexpected as we can show (appendix d) that if trios are Mendelian consistent for each individual marker,
then the trio genotype is Mendelian consistent across
冢冢
1 2冣冢
1 2
冣冢
1 1
冣冢
1
1
冣冣
and冢冢
1 2冣冢
1 2
冣冢
1 2
冣冢
1 1
冣冣
all the markers even with the use of multiple tightlylinked markers. Therefore, error checking through show Mendelian consistency, the two-marker quartet Mendelian consistency offers little more information genotype does not. On the basis of this, it can be ex-for family trios in the absence of additional inex-formation, pected that if we consider two-marker quartet geno-e.g., phase and/or population genotypes. types, the error detection rate will be increased, as
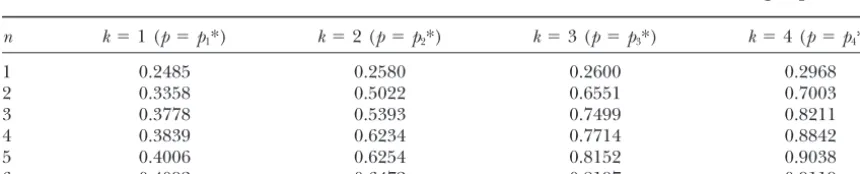
evi-Error detection rates for families with more than one denced from our simulation results shown in Tables 2 child: When additional family members are available, and 3, wheren andkdenote the numbers of children joint consideration of two tightly linked markers offers and markers, respectively, andI
j denotes the number
more information than single markers. For example, of alleles at markerj(j⫽1, . . . ,k).
consider a family with both parents and two children. Our results show that when more than one child is Let the two-marker quartet genotype be in a nuclear family, the error detection rates can be
greatly increased by adding additional markers.
Further-冢冢
12 1 2
冣冢
1 2
1 2
冣冢
1 1
1 2
冣冢
1 1
1
1
冣冣
, more, the error detection rates increase with the num-ber of children. The rate of increase is the greatest from one child to two children, and there is usually not much where the first two matrices denote the parents’geno-types and the last two matrices denote the children’s difference between having five or six children.
TABLE 3
Error detection rates for nuclear families withnchildren andkmarkers when the markers are in linkage equilibrium
n k⫽1 (p⫽p1*) k⫽2 (p⫽p2*) k⫽3 (p⫽p3*) k⫽4 (p⫽p4*)
1 0.2485 0.2580 0.2600 0.2968
2 0.3358 0.5022 0.6551 0.7003
3 0.3778 0.5393 0.7499 0.8211
4 0.3839 0.6234 0.7714 0.8842
5 0.4006 0.6254 0.8152 0.9038
6 0.4092 0.6472 0.8197 0.9119
The true error rate is 0.01 and the allele frequencies are equal.
p1*⫽(0.5, 0.5)
p2*⫽(0.25, 0.25, 0.25, 0.25)
p3*⫽(0.125, 0.125, 0.125, 0.125, 0.125, 0.125, 0.125, 0.125)
TABLE 4
Error detection rates for nuclear families withnchildren and one marker with eight alleles of equal frequency
True error rate n⫽1 n⫽2 n⫽3 n⫽4 n⫽5 n⫽6
0.0100 0.6110 0.7686 0.8504 0.8698 0.8944 0.8992
0.0500 0.7742 0.9266 0.9672 0.9855 0.9928 0.9963
In addition to considering biallelic markers, we also that, whene1⫽ e2, the probability that a trio displaying
consistency has correct genotypes is not much affected consider markers with multiple alleles and the results
are summarized in Table 4. It can be seen that, as ex- by allele frequencies.
In the case of two markers, we consider the cases for pected, the error detection rates are higher for the case
of multiple alleles. Comparing the results of Table 4 p11⫽ p12⫽0.4,p21⫽p22⫽0.1, ande1⫽e2 ⫽ε1⫽ε2⫽
0.005;p11⫽0.4,p12⫽0.2,p21⫽0.3,p22⫽0.1, ande1⫽
with those of the third column of Table 3 is interesting
because Table 4 is for a marker with eight alleles of e2⫽ε1⫽ε2⫽ 0.01; and the three special cases
consid-ered in error detection rates. Our analytical results (data equal frequency and column 3 of Table 3 is for a
haplo-type system with eight haplohaplo-types having equal frequen- not shown) indicate that if the error rates are low (ⱕ0.5%), the probability of an observed genotype being cies. Although there is substantial difference between
error detection rates when there is only one child and true is ⬎95%, which implies that a trio genotype dis-playing consistency is often true. If the error rates are when there are two children, the difference for the case
of multiple children becomes smaller when the number between 0.5 and 2%, then the trio genotypes still tend to be true. However, if the error rates are large (ⱖ10%), of children is larger.
Probability that a family trio displaying Mendelian then the probability is often ⬍40%, which means that a trio genotype displaying consistency is usually not true.
consistency has correct genotypes:In addition to error
detection rates, the probability that a family with Mende- As in the case of one marker, the probability that an observed genotype displaying consistency is correct is lian consistency has correct genotypes may be of more
relevance as these probabilities will help the investiga- only slightly affected by haplotype frequencies under the stochastic error model.
tors to prioritize families for genotyping error checking
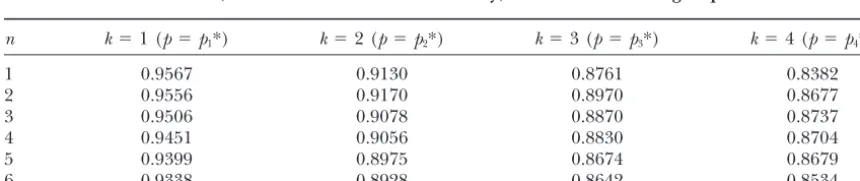
among Mendelian-consistent families. Probability that a nuclear family with more than one child displaying Mendelian consistency has correct
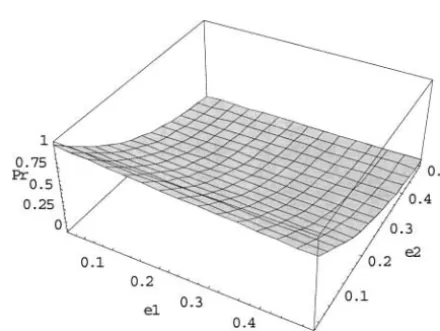
ge-Figure 1 reveals the results of the probability that a
trio with Mendelian consistency has correct genotypes notypes:For the general case of multiple children and multiple markers, we conduct simulation studies to esti-for the case of single markers when the error rates are
the same. It is seen that when the true error rates are mate the probability that a family displaying Mendelian consistency has correct genotypes. The simulation re-low (ⱕ1%), most of the Mendelian-consistent trios have
correct genotypes. On the other hand, when the error sults are presented in Table 5. It can be seen from the table that when the error rate is 0.01, the probability that rates are high (ⱖ20%), most of the
Mendelian-consis-tent trios have incorrect genotypes. A similar observa- a family displaying Mendelian consistency has correct tion can be obtained for different values of e1 and e2 genotypes is high, even though multiple children and
(see Figures 2 and 3). Furthermore, it can be seen from the probability curves for p⫽ 0.1 and 0.5 in Figure 1
Figure1.—The probability that an observed genotype with
one marker is true forp⫽0.1 and 0.5 whene1⫽e2⫽e(the Figure2.—The probability that an observed genotype with one marker is true whenp⫽0.1.
TABLE 6
Error detection rates for trios whene1,e2,ε1, and ε2are all
equal in the presence of the information on perfect linkage disequilibrium (LD) with equal allele frequencies
True error rate p1⫹⫽p⫹1⫽0.1 p1⫹⫽p⫹1⫽0.5
0.0010 0.9993 0.9992
0.0050 0.9964 0.9958
0.0100 0.9929 0.9918
0.0200 0.9865 0.9844
0.0500 0.9707 0.9662
0.1000 0.9541 0.9475
0.2000 0.9444 0.9388
0.3000 0.9482 0.9457
Figure3.—The probability that an observed genotype with one marker is true whenp⫽0.5.
lian consistency has correct genotypes. Still consider the above case where two markers are in perfect linkage disequilibrium with equal allele frequency. The condi-multiple markers are considered. Also, except for the
case of only one child, these probabilities are very similar tional probability that a Mendelian-consistent trio is true is presented in Table 7. It is apparent that even when when the number of children differs.
Use of population haplotype information: One way the error rates are as high as 10%, the probability that an observed Mendelian-consistent trio is true is quite to increase error detection rates is to make use of some
other information. Consider the special case of perfect high. linkage disequilibrium with equal allele frequencies. In
this scenario, there are only two possible haplotypes in
DISCUSSION
the population, (11) and (22), and there are a total
of 10 possible trio genotypes. Therefore, any patterns In this article, we investigated genotyping error detec-tions through multiple tightly linked markers in nuclear differing from these 10 will be identified as caused by
genotyping errors. The conditional probabilities that a families. Our error detection rate is calculated using families, not markers, as a unit, with the objective of family trio withierrors (1ⱕiⱕ6) will be undetected,
i.e., fall into one of the 10 categories, are available from being able to identify families having genotyping errors. We first calculated the error detection rates for family the authors upon request. Note that we can still use
Lemma 1 to calculate the probabilities wheni is between trios with two markers using an analytical method. We showed that in the absence of phase information, geno-7 and 12. When all the error rates are the same, the
error detection rates are as summarized in Table 6. As typing errors can be detected if and only if there is Mendelian inconsistency at one or more of the markers. expected, the error detection rates are indeed greatly
increased. This means that only the information on each marker is helpful for detecting genotyping errors. Joint consid-Such additional information will also affect the
calcu-lation of the probability that a family displaying Mende- eration of multiple tightly linked markers will not
pro-TABLE 5
The values ofP(true|a Mendelian-consistent family) for markers in linkage equilibrium
n k⫽1 (p⫽p1*) k⫽2 (p⫽p2*) k⫽3 (p⫽p3*) k⫽4 (p⫽p4*)
1 0.9567 0.9130 0.8761 0.8382
2 0.9556 0.9170 0.8970 0.8677
3 0.9506 0.9078 0.8870 0.8737
4 0.9451 0.9056 0.8830 0.8704
5 0.9399 0.8975 0.8674 0.8679
6 0.9338 0.8928 0.8642 0.8534
The true error rate is 0.01.
p1*⫽(0.9, 0.1)
p2*⫽(0.81, 0.09, 0.09, 0.01)
p3*⫽(0.729, 0.081, 0.081, 0.009, 0.081, 0.009, 0.009, 0.001)
TABLE 7
冢冢
1 1 1 1 1 1冣冢
1 1 1 1 1 1冣冢
1 1 1 1 1 1冣冢
1 1 1 1 11
冣冣
(6)The values ofP(true|a Mendelian-consistent trio) whene1,e2,
ε1, andε2are all equal in the presence of the information on
and
perfect LD with equal allele frequencies
冢冢
1 2 1 2 1 2冣冢
1 2 1 2 1 2冣冢
1 2 1 2 1 2冣冢
1 2 1 2 12
冣冣
. (7)True error rate p1⫹⫽p⫹1⫽0.1 p1⫹⫽p⫹1⫽0.5
0.0010 1.0000 1.0000
The first configuration is more likely to occur if the
0.0050 0.9999 0.9999
allele frequencies are 0.9 and 0.1 at each marker, and
0.0100 0.9996 0.9995
the second one is more likely to occur if the allele
0.0200 0.9983 0.9981
frequencies are 0.5 and 0.5 at each marker. If only one
0.0500 0.9885 0.9876
0.1000 0.9495 0.9463 error is introduced into some marker for each person,
0.2000 0.7671 0.7616 say marker 1 for parent 1, marker 2 for parent 2, then
0.3000 0.4622 0.4762 when the genotypes of parents in (6) become
冢
1 21 1 1
1
冣
and冢
1 1 1 21 1
冣
, vide more information. Therefore, the error detectionthe probability that the errors can be detected is 20(1⫺ rates will not be greatly increased when the error rates
ε)10ε2 (where εis the genotyping error rate from true
are low. As a result, the error detection rates are
gener-allele 1 to erroneous gener-allele 2 and from true gener-allele 2 to ally low if Mendelian consistency is used as the unique
erroneous allele 1); and when the genotypes of parents criterion for checking errors. However, when more than
in (7) become one child is in a family, joint consideration of tightly
linked markers can offer more information than single
冢
1 11 2
1
2
冣
and冢
1 2 1 1 1 2冣
markers. In fact, the error detection rates can be greatlyincreased by adding tightly linked markers.
Tables 2 and 3 reveal different properties between
冢
or冢
1 11 2
1
2
冣
and冢
1 22 2
1 2
冣冣
, markers with equal and unequal allele frequencies: Ifthe number of markerskis small (ⱕ2) or only one child
the probability of error detection is 22(1⫺ ε)10ε2. The
is in the family, the error detection rates for markers
difference between the former and the latter is⫺2(1⫺ with unequal allele frequencies are greater than those ε)10ε2. On the other hand, if the family trio is considered
for markers with equal allele frequencies. However, if [i.e., only one child is considered in (6) and (7)], then there are more than two markers and more than one the corresponding difference is 2(1 ⫺ ε)5ε ⫺ 2(1 ⫺
child is in the family, the error detection rates for mark- ε)5ε⫽0. Note that whenkis small, the possibility that
ers with equal allele frequencies are greater. This is also the errors are introduced into each of the genotypes of seen for the case of linkage disequilibrium (data not parents and children is not great. For this case, the shown). An explanation for this phenomenon is as fol- possibility that the haplotypes of parents can be deter-lows. For the case of unequal haplotype (allele) frequen- mined through the first child is small.
cies, the genotype of the first child can often be used We have also examined error detections for multi-to detect the error, but for the case of equal haplotype allelic markers and the error detection rates are greater (allele) frequencies, the genotype of the first child is for equal allele frequencies (see Table 4). This can be often used to determine the haplotypes of parents and readily understood by noting that unlike the case of often cannot be used to detect the error except for the biallelic markers, for the case of multiallelic markers, case ofk⫽ 1. Thus, whenn ⫽ 1, the error detection the errors in the genotypes of parents have greater effect rates for unequal haplotype (allele) frequencies are on error detections. Although haplotypes can be thought greater. Ifkis not small, the errors will often be intro- of as a multiallelic marker, the error detection rates duced into each of the genotypes of parents and chil- are lower for a haplotype system than for a multiallelic dren, and the errors are often easier to detect for the marker with the same allele frequencies as the set of case of equal haplotype (allele) frequencies because haplotype frequencies. However, the difference is smaller whenkbecomes large, more and more alleles at each when a larger number of children are considered in a marker will be heterozygous for the case of unequal nuclear family.
e1 ⫽ 0.005,e2 ⫽ 0.01, and p ⫽ 0.5, we can obtain the After the errors are introduced, if the parents and the
first child show Mendelian consistency and they have error detection rate to be 0.3374.
In addition to error detection rates, we have also correct genotypes, then their genotypes must be calculated the probability that a family displaying
Men-delian consistency has correct genotypes. The calcula-
冢冢
1 2冣冢
1 2
冣冢
1 2
冣冣
. tions of such quantities are useful as they may pointto certain families that, although showing Mendelian If we add one child, then after the errors are introduced consistency, are likely to have genotyping errors. The into the genotype of the second child (see Equation 9), calculations require haplotype frequencies from the P(the resulting quartet genotype is consistent)⫽ 1, and population and estimated error rates. A potential appli- P(the genotype of the second child is true|the resulting cation of calculating these probabilities is to conduct quartet genotype is consistent)⫽1⫺2⫻(1⫺0.01)⫻ transmission/disequilibrium tests in the presence of 0.01⫽ 0.9802. Thus, the ratio of the probabilities that genotyping errors. We showed that when the error rates the genotype is correct and consistent is 0.9802, which are low, the overall probability that a Mendelian-consis- means that conditional on Mendelian consistency, the tent trio has correct genotypes is quite high, and the probability of having correct genotypes becomes smaller overall probability is not very sensitive to haplotype fre- when an additional child is added.
quencies under the stochastic error model. We expect If the phase information is known, errors can be de-that the number of families showing Mendelian consis- tected although each individual marker shows Mende-tency and having correct genotypes decreases with the lian consistency. For example, consider a family whose increase of the number of children in the family and individual marker genotypes are
the number of markers. Our simulation results indeed
show this property (data not shown). On the other hand,
冢冢
1 1冣冢
1 2
冣冢
1
2
冣冣
and冢冢
1 1冣冢
2 1冣冢
1 2冣冣
our simulation results show that conditional on a familyshowing Mendelian consistency, the probability that this
and their haplotypes are family has correct genotypes is not a monotonic
func-tion ofnandk. We offer an explanation by considering
冢冢
1 1 1 1冣冢
1 2 2 1冣冢
1 2 12
冣冣
. (10) two markers with equal allele frequencies:p1⫽p2⫽0.5.Consider the following two-marker genotype,
Although each marker is Mendelian consistent, the joint haplotypes are not, unless we assume there is a
recombi-冢冢
1 2 1 2冣冢
1 2 1 2冣冢
1 2 1 2冣冢
1 2 12
冣冣
, (8) nation event between these two tightly linked markers. Therefore, when phase information is available, error which is the most common family configuration. After detection rates may be improved. However, phase infor-the errors are introduced, if infor-the parents and infor-the first mation may be difficult to obtain except through some child show Mendelian consistency and they have correct molecular techniques. Instead, we have examined the genotypes, then their genotypes must be benefit of perfect linkage disequilibrium information,which can be regarded as partial haplotype information
冢冢
1 2 1 2冣冢
1 2 1 2冣冢
1 2 12
冣冣
. in genotyping error detections. We have considered a situation where only two of the haplotypes are known to exist in a given population. In this case, utilizing this Now we consider the case of adding another child, thatinformation may significantly increase the chance to is, a quartet (see Equation 8). After the errors are
intro-detect errors through tightly linked markers and in-duced into the genotype of the second child, P(the
crease the confidence that a Mendelian-consistent trio resulting quartet genotype is Mendelian consistent)⫽
has correct genotypes, and this line of research is worth 1⫺4⫻(1⫺0.01)3⫻0.01⫺4⫻(1⫺0.01)⫻0.013⫽
pursuing. 0.9612, andP(the genotype of the second child is
cor-In this article, we have considered tightly linked mark-rect|the resulting quartet genotype is consistent)⫽[(1⫺
ers by assuming no recombination events among these 0.01)4 ⫹ 2⫻ (1 ⫺ 0.01)2 ⫻ 0.012 ⫹ 0.014]/0.9612 ⫽
markers. If we allow the occurrence of recombinations, 0.9996. Thus, the ratio of the probabilities that the
geno-there would be little benefit from using a Mendelian-type is true and consistent is 1.04. This shows that
condi-consistency check as the only criterion for identifying tional on Mendelian consistency, the probability of
hav-families with genotyping errors. However, if reliable esti-ing correct genotypes becomes larger when an additional
mates of recombination fractions among these markers child is added.
are available, we can calculate the probability for each For the case of one marker, we consider the following
family, incorporating recombination fraction informa-one-marker genotype:
tion as well as population haplotype frequency informa-tion if it is available. Therefore, although fewer families
冢冢
1 2冣冢
1 2冣冢
1 2冣冢
1more frequent than apparent errors for single nucleotide poly-the basis of Mendelian-consistency check, we are still
morphisms. Hum. Hered.49:65–70.
able to order families by the likelihoods of their geno- Gordon, D., S. M. Leal, S. C. HeathandJ. Ott, 2000 An analytic solution to single nucleotide polymorphism error-detection rates types and pursue those with very small likelihoods to
in nuclear families: implications for study design. Pac. Symp. be observed.
Biocomput.5:663–674.
Gordon, D., S. C. Heath, X. LiuandJ. Ott, 2001 A transmission/ The authors are grateful to the two reviewers for their valuable
disequilibrium test that allows for genotyping errors in the analy-comments and suggestions, which greatly improved the original
manu-sis of single-nucleotide polymorphism data. Am. J. Hum. Genet. script. This work was supported in part by grant GM59507 from the
69:371–380. National Institutes of Health.
Go¨ ring, H. H. H., andJ. D. Terwilliger, 2000a Linkage analysis in the presence of errors I: complex-valued recombination fractions and complex phenotypes. Am. J. Hum. Genet.66:1095–1106.
Go¨ ring, H. H. H., andJ. D. Terwilliger, 2000b Linkage analysis in the presence of errors II: marker-locus genotyping errors
mod-LITERATURE CITED
eled with hypercomplex recombination fractions. Am. J. Hum.
Akey, J. M., K. Zhang, M. Xiong, P. DorisandL. Jin, 2001 The Genet.66:1107–1118.
effect that genotyping errors have on the robustness of common Go¨ ring, H. H. H., andJ. D. Terwilliger, 2000c Linkage analysis in linkage-disequilibrium measures. Am. J. Hum. Genet.68:1447– the presence of errors III: marker loci and their map as nuisance
1456. parameters. Am. J. Hum. Genet.66:1298–1309.
Go¨ ring, H. H. H., andJ. D. Terwilliger, 2000d Linkage analysis
Broman, K. W., andJ. L. Weber, 1998 Estimation of pairwise
rela-in the presence of errors IV: jorela-int pseudomarker analysis of lrela-ink- link-tionships in the presence of genotyping errors. Am. J. Hum.
age and/or linkage disequilibrium on a mixture of pedigrees and Genet.63:1563–1564.
singletons when the mode of inheritance cannot be accurately
Buetow, K. H., 1991 Influence of aberrant observations on
high-specified. Am. J. Hum. Genet.66:1310–1327. resolution linkage analysis outcomes. Am. J. Hum. Genet.49:
Lincoln, S. E., and E. S. Lander, 1992 Systematic detection of 985–994.
errors in genetic linkage data. Genomics14:604–610.
Douglas, J. A., M. Boehnke and K. Lange, 2000 A multipoint
O’Connell, J. R., andD. E. Weeks, 1998 PedCheck: a program for method for detecting genotyping errors and mutations in
sibling-identification of genotype incompatibilities in linkage analysis. pair linkage data. Am. J. Hum. Genet.66:1287–1297.
Am. J. Hum. Genet.63:259–266.
Douglas, J. A., A. D. SkolandM. Boehnke, 2002 Probability of
Ott, J., 1993 Detecting marker inconsistencies in human gene map-detection of genotyping errors and mutations as inheritance
in-ping. Hum. Hered.43:25–30. consistencies in nuclear-family data. Am. J. Hum. Genet.70:487–
Shields, D. C., A. Collins, K. H. BuetowandN. E. Morton, 1991 495.
Error filtration, interference, and the human linkage map. Proc.
Ehm, M. G., M. KimmelandR. W. Cottingham, Jr., 1996 Error
Natl. Acad. Sci. USA88:6501–6505. detection for pedigree data, using likelihood methods. Am. J.
Sobel, E., J. Pappand K. Lange, 2002 Detection of genotyping Hum. Genet.58:225–234.
errors. Am. J. Hum. Genet.70:496–508.
Ehm, M. G., andM. Wagner, 1998 A test statistic to detect errors Stringham, H. M., andM. Boehnke, 1996 Identifying marker typ-in sib-pair relationships. Am. J. Hum. Genet.62:181–188. ing incompatibilities in linkage analysis. Am. J. Hum. Genet.59:
Goldstein, D. R., H. ZhaoandT. P. Speed, 1997 The effects of 946–950.
genotyping errors and interference on estimation of genetic dis- Terwilliger, J. D., D. E. WeeksandJ. Ott, 1990 Laboratory errors tance. Hum. Hered.47:86–100. in the reading of marker alleles cause massive reductions in
Gordon, D., andJ. Ott, 2001 Assessment and management of single lod score and lead to gross overestimates of the recombination nucleotide polymorphism genotype errors in genetic association fraction. Am. J. Hum. Genet.47(Suppl.): A201.
analysis. Pac. Symp. Biocomput.6:18–29.
Gordon, D., S. C. HeathandJ. Ott, 1999 True pedigree errors Communicating editor: Y.-X.Fu
APPENDIX A: THE CALCULATION OFP(iERRORS INM)
For familyM, letMibe the number of errors at markeri, wherei⫽ 1, 2. Then we have
P(ierrors inM)⫽P(M1⫹ M2 ⫽i)⫽
兺
ik⫽0
P(M1⫽ k,M2 ⫽i⫺k). (A1)
LetMijdenote the number of allelej’s errors at markeriinM,i,j⫽1, 2. For example,M12is the number of allele
2’s errors,i.e., from true allele 2 to erroneous allele 1, at marker 1 inM. ThenM1j ⵑBinomial(N1j,ej), andM2jⵑ
Binomial(N2j,εj),j⫽1, 2, whereNijis the number of allelejat markeriinM(i,j⫽1, 2). Note thatMij⫽0 when
Nij⫽0. Then,
P(M1⫽k)⫽P(M11⫹ M12⫽ k)⫽
兺
kj⫽0 jⱕN11,k⫺jⱕN12
P(M11⫽j,M12⫽k⫺j) (A2)
⫽
兺
kj⫽0
冢
N11
j
冣
ej
1(1⫺e1)N11⫺j·
冢
N12
k⫺j
冣
ek⫺j
2 (1⫺ e2)N12⫺(k⫺j).
(Here we define (N
n)⫽0 ifN⬍ n). Similarly,
P(M2⫽ i⫺k)⫽
兺
i⫺kᐉ⫽0
冢
N21
ᐉ
冣
εᐉ1(1 ⫺ε1)N21⫺ᐉ·冢
N22
i⫺k⫺ᐉ
冣
εi⫺k⫺ᐉ
2 (1⫺ε2)N22⫺(i⫺k⫺ᐉ). (A3)
P(ierrors inM)⫽
兺
i
k⫽0
冤
兺
kj⫽0
冢
N11
j
冣
ej
1(1⫺ e1)N11⫺j·
冢
N12
k⫺j
冣
ek⫺j
2 (1⫺ e2)N12⫺(k⫺j)
冥
·
冤
兺
i⫺k
ᐉ⫽0
冢
N21
ᐉ
冣
εᐉ1(1 ⫺ε1)N21⫺ᐉ·冢
N22
i⫺k⫺ᐉ
冣
εi⫺k⫺ᐉ
2 (1⫺ε2)N22⫺(i⫺k⫺ᐉ)
冥
. (A4)In particular,
P(no error inM)⫽ (1⫺e1)N11(1⫺e2)N12(1⫺ ε1)N21(1 ⫺ε2)N22.
Thus,
P(no error in trio)⫽
兺
M僆S
P(no error in trio|M) ·P(M)
⫽
兺
M僆S
(1 ⫺e1)N11(1 ⫺e2)N12(1⫺ε1)N21(1⫺ ε2)N22·P(M).
Noting that
兺
kj⫽0
冢
N11
j
冣冢
N12k⫺j
冣
⫽冢
N11⫹N12
k
冣
⫽冢
6 k冣
and
兺
i⫺k
ᐉ⫽0
冢
N21
ᐉ
冣 冢
N22
i⫺k⫺ᐉ
冣
⫽冢
N21⫹N22
i⫺k
冣
⫽冢
6 i⫺k冣
, we see that for the stochastic error model, (A4) reduces toP(ierrors inM)⫽
冢
12 i冣
ei
1(1 ⫺e1)12⫺i.
For the directed error model, we have
P(i errors inM)⫽
兺
i
k⫽0
冢
N11
k
冣
ek
1(1⫺ e1)N11⫺k·
冢
N21
i⫺k
冣
εi⫺k
1 (1⫺ε1)N21⫺(i⫺k).
APPENDIX B
In the following, we describe how to determine whether a haplotype pair consistent with child 1 is also consistent with both parents.
Let
冢
h1h2
冣
0denote a consistent haplotype pair of the first child, where ( )0 means phase information is known. Further, ifh F
(hM) is a haplotype of the father (the mother), lethF(hM) denote the complementary haplotype in the sense that
hF(hM) consists of the remaining alleles of the father (the mother).
1. Ifh1 is consistent with the father but not the mother, thenh2 has to be consistent with the mother unless there
are genotyping errors. Thus,hF can be determined byh1and the genotype of the father andhMcan be determined
byh2and the genotype of the mother. Hence, possible haplotype pairs for the children in this family determined
by such
冢
h1h2
冣
0are
冦冢
h1h2
冣
0,
冢
h1 h2M冣
0
,
冢
h1F h2冣
0
,
冢
h1F h2M冣
0
冧
.2. Ifh1is consistent with the mother but not the father, thenh2has to be consistent with the father unless there
冢
h1h2
冣
0are
冦冢
h1h2
冣
0,
冢
h1 h2F冣
0
,
冢
h1M h2冣
0
,
冢
h1M h2F冣
0
冧
.3. Ifh1is consistent with both the father and the mother, then when h2is consistent with the father but not the
mother, possible haplotype pairs for the children in this family determined by
冢
h1h2
冣
0are the same as those in possibility 2. Whenh2is consistent with the mother but not the father, possible haplotype
pairs for the children in this family determined by
冢
h1h2
冣
0are the same as those in possibility 1. Whenh2is consistent with both the father and the mother, possible haplotype
pairs for the children in this family determined by
冢
h1h2
冣
0are
冦冢
h1h2
冣
0,
冢
h1 h2F冣
0
,
冢
h1M h2冣
0
,
冢
h1M h2F冣
0
冧
and冦冢
h1h2
冣
0,
冢
h1 h2M冣
0
,
冢
h1F h2冣
0
,
冢
h1F h2M冣
0
冧
.APPENDIX C
As an example, we calculateP(T⫽M|O ⫽M), where
M⫽
冢冢
1 1冣冢
1 2
冣冢
1 2
冣冣
. It can be shown thatP(O⫽M|T⫽M)⫽ P
冢
O⫽冢冢
1 1冣冢
1 2
冣冢
1
2
冣冣
兩T⫽冢冢
1 1冣冢
1 2
冣冢
1 2
冣冣冣
⫽ (1⫺e1)4(1 ⫺e2)2⫹4e1(1⫺e1)3e2(1⫺e2)⫹3e12(1⫺ e1)2e22.
Similarly, we can get the other conditional probability P(O ⫽ M|T⫽ M⬘)(M⬘⬆ M). Substituting these formulas into (4) and using the values ofP(T⫽ M), we obtain
P(O⫽ M)⫽ 8e2
1(1⫺e1)4
·p4 ⫹[2e
1(1⫺e1)4(1 ⫺e2)⫹6e12(1⫺e1)3e2⫹(1⫺ e1)4(1⫺e2)2
⫹ 4e1(1⫺ e1)3e2(1⫺ e2)⫹ 3e21(1 ⫺e1)2e22]
· 2p3q⫹ [(1⫺e
1)3e2(1 ⫺e2)2⫹ 2e1(1⫺e1)2e22(1⫺ e2)
⫹ e2
1(1 ⫺e1)e23⫹e1(1 ⫺e1)3e2(1 ⫺e2)⫹e21(1⫺ e1)2e22
⫹ (1⫺e1)3e2(1⫺e2)2⫹ 2e1(1⫺ e1)2e22(1 ⫺e2)⫹ e21(1⫺e1)e32
⫹ (1⫺e1)2e22(1⫺ e2)2⫹e1(1⫺e1)e32(1⫺e2)]
· 4p2q2⫹ [6(1⫺e
⫹ 4e1(1⫺ e1)e32(1⫺ e2)⫹e21e42]
· 2pq3⫹ 8e4
2(1 ⫺e2)2·q4,
wherepis the population frequency of allele 1, andq⫽ 1⫺ p. Thus, we have
P(T⫽ M|O⫽ M)⫽[(1⫺e1)4(1 ⫺e2)2⫹4e1(1⫺e1)3e2(1⫺e2)⫹3e21(1⫺ e1)2e22] · 2p3q/P(O⫽ M).
APPENDIX D
Theorem. If there is no phase information and each marker in a set of tightly linked markers is Mendelian consistent, the trio is Mendelian consistent across these markers.
Proof. Letᏼ,ᏹ, andᏯdenote the genotypes for the two parents and the child across a set ofkmarkers, where
ᏼ⫽
冢
a11a12
... ...
ak1
ak2
冣
ᏹ⫽
冢
b11b12
... ...
bk1
bk2
冣
Ꮿ⫽
冢
c11c12
... ...
ck1
ck2
冣
Letcp
i be the allele consistent with one of the two allelesai1andai2in the father andcmi be the allele consistent with
one of the two allelesbi1 andbi2 in the mother. Then we would infer that one of the haplotypes in the father is
(cp
1cp2. . . ckp) and one of the haplotypes in the mother is (cm1cm2 . . .cmk). It is easy to see that such inference would