Copyright 0 1989 by the Genetics Society of America
Distribution of Chi-Stimulated Recombinational Exchanges and
Heteroduplex Endpoints in Phage Lambda
Keith C. Cheng and Gerald R.
Smith
Fred Hutchinson Cancer Research Center, Seattle, Washington 98104 and Department of Pathology, University of Washington, Seattle, Washington 98195
Manuscript received December 27, 1988 Accepted for publication May 15, 1989
ABSTRACT
T h e recombination hotspot Chi, 5’ G-C-T-G-G-T-G-G 3’, stimulates the RecBCD recombination pathway of Escherichia coli. We have determined, with precision greater than previously reported, the distribution of Chi-stimulated exchanges around a Chi site in phage X. Crosses of h phages with single base-pair mutations surrounding a Chi site were conducted in and analyzed on mismatch correction- impaired hosts to preserve heteroduplex mismatches for analysis. Among phages recombinant for flanking markers, Chi stimulated exchanges most intensely in the intervals immediately adjacent to the Chi site, both to its right and to its left. Stimulation fell off abruptly to the right but gradually to the left (with respect to the orientation of the Chi sequence written above). We have also determined that Chi stimulated the formation of heteroduplex DNA, which frequently had one endpoint to the right of Chi and the other endpoint to the left. These data support a model of Chi-stimulated recombination in which RecBCD enzyme cuts DNA immediately to the right of Chi and unwinds DNA to the left of Chi; segments of unwound single-stranded DNA are sometimes, but not always, degraded before synapsis with homologous DNA.
S
PECIAL sites in both eukaryotes and prokaryotes affect the frequency and distribution of recom- bination events in their vicinity (STAHL 1979; SMITH1988b). Chi, 5’ G-C-T-G-G-T-G-G 3’ (SMITH et al. 198 la), enhances break-join recombination (LAM et al. 1974) mediated by the primary pathway of recom- bination of Escherichia coli, the RecBCD pathway (STAHL and STAHL 1977) (reviewed by STAHL 1979 and SMITH 1987). Models of Chi-stimulated recombi- nation incorporating known genetic and biochemical properties of Chi and the RecBCD pathway enzymes have been proposed (STAHL 1979; Smith et al. 198 1 b). In this paper, we test predictions of one of these models by analyzing recombinants from phage X Red- Gam- crosses conducted in and analyzed on mismatch correction-impaired hosts.
Two known components of the RecBCD pathway (CLARK 1973; SMITH 1988a), RecA protein and RecBCD enzyme, have been studied in vitro in detail (for reviews, see COX and LEHMAN 1987; TAYLOR 1988). RecA protein promotes interactions between homologous DNA molecules, including strand trans- fer between double-stranded and single-stranded DNA (SHIBATA et al. 1979). RecBCD enzyme makes single strand endonucleolytic cleavages four to six nucleotides to the right of the Chi octamer as the enzyme unwinds the DNA from right to left (with
of page chat-ges. This article must therefore be hereby marked “advertisement”
The publiration costs of this article were partly defrayed by the payment in accordance with 18 U.S.C. 3 1734 solely to indicate this fact.
Genetics 123: 5-17 (September, 1989)
respect to Chi as written above; PONTICELLI et al. 1985; TAYLOR et al. 1985). T h e frequency of DNA strand cleavage strongly correlates with the recombi- national hotspot activity of mutant forms of RecBCD enzyme (PONTICELLI et al. 1985) and of mutant forms of Chi (CHENG and SMITH 1987). This correlation indicates that the cleavage about five nucleotides to the right of Chi is essential for hotspot activity of Chi. Does the cleavage to the right of Chi correspond to a position of Chi-stimulated exchange? Previous stud- ies have not determined the distribution of Chi-stim- ulated exchange with sufficient precision to answer this question. Analysis in density gradients of the progeny from crosses of isotopically labeled parental
6 K. C. Cheng and G . R. Smith
and STAHL 1975; STAHL et al. 1980; CHENG and SMITH 1984) have shown that Chi stimulation is greater to its left than to its right, but the absolute amount of stimulation to the right is unknown, since stimulations to the left and right were measured only relative to each other. Two experimental features are essential to determine if Chi can stimulate exchange immediately to its right or left: use of Chi as a marker and homology at Chi. In one report (CHENG and SMITH 1984) using these features there were more Chi-stimulated exchanges to the left of Chi than to its right, but again only relative stimulations were meas- ured. In addition, the absence of additional nearby markers in that report precluded determining how close to Chi (or far from it) these exchanges occurred. To determine the locations of Chi-stimulated ex- changes, we have conducted X Red- Gam- crosses with Chi and additional, nearby single base-pair mu- tations as markers.
In one model of Chi-stimulated recombination (SMITH et al. 198 1 b, 1984), RecBCD enzyme cuts one DNA strand to the right of Chi as it unwinds the DNA from right to left (Figure 1). Continued unwinding produces a single-stranded DNA tail extending left- ward from Chi, which invades a homologous DNA duplex in a RecA protein-promoted reaction. This model predicts that all unreplicated Chi-stimulated recombinants have hybrid DNA at Chi (Figure 1, step I). After replication, half of the Chi-stimulated recom- binants exchanged for flanking markers (step I, right) are predicted to have their point of genetic exchange to the left of Chi, and the other half immediately to the right of Chi. If the single-stranded DNA tail extending leftward from Chi ("Chi tail") were de- graded more than about 10 nucleotides from its 3' end, the recombinants would not be hybrid at Chi and both genetic exchange points would be to the left of Chi. In this paper we test these predictions and esti- mate the frequency of the hypothesized degradation of the Chi tail from the distribution of exchanges among phages recombinant for flanking markers and from the deduced endpoints of heteroduplex DNA in the Chi-stimulated recombinants.
Genetic heterozygosity signaling the presence of hybrid DNA can be abolished by mismatch correction (WILDENBERG and MESELSON 1975; Figure 2). There- fore, mismatch correction-impaired hosts, such as mutL strains (MODRICH 1987; RAPOSA and FOX 1987), are more likely to yield recombinants reflecting the initial break-join exchanges than are crosses permis- sive for mismatch correction. For example, HUISMAN and Fox (1 986) found that the frequency of lambda
O+P+ recombinants heteroduplex at cZ is 10-20-fold higher when the cross lysate is plated on mut-
L218::TnIO, rather than mutL+, indicator bacteria;
"---""" """"""""""
".II
-
+ * or-
+I'
-
-
-
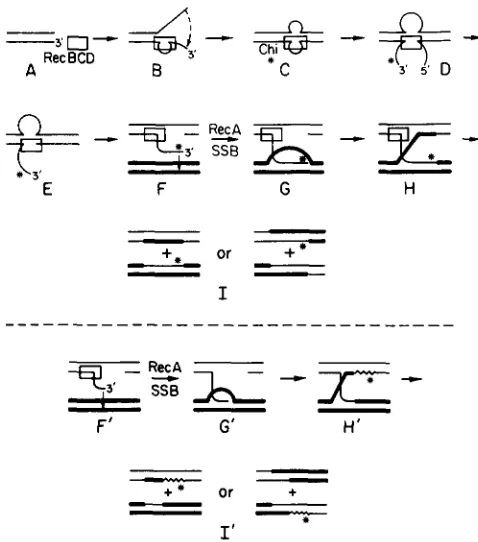
le_FIGURE 1.-Model for RecBCD pathway recombination. One parental chromosome is represented by a pair of light lines, and the other (which may be circular, but is drawn as a linear molecule for simplicity) by a pair of heavy lines. RecBCD enzyme (box) attaches to a duplex end (A), unwinds the DNA to form a loop plus short tail (B) on the strand with a 3'-end (BRAEDT and SMITH 1989). The ends of the loop-tail anneal to form a twin-loop (C) (TAYLOR and SMITH 1980). Upon encountering a properly oriented Chi se- quence, RecBCD enzyme cuts the strand containing 5' G-C-T-G- G-T-G-G 3' (Chi, denoted by
*
in steps D to I ) to produce a 3' ended "Chi tail" (F) (PONTICELLI et al. 1985; TAYLOR et al. 1985). RecA and SSB proteins promote synapsis between the Chi tail and the homologous parent to form a D-loop (G) (COX and LEHMAN1987). Cleavage of the D-loop, perhaps by RecBCD enzyme, fol- lowed by synapsis of the displaced strand with the gap in the first parental DNA forms a Holliday junction (H), whose migration may be driven by RecBCD enzyme. The Holliday junction is resolved by cutting, perhaps by RecBCD enzyme, and ligation of homologous strands to produce recombinants with parental or recombinant configurations of flanking markers (left and right of I , respectively). Panels below the dashed line diagram the consequences of degra- dation of the 3' ended "Chi tail" (F) to produce a shorter tail lacking the Chi sequence (*)(F'). Synapsis to form a D-loop (G') and formation (H') and resolution (1') of the Holliday junction proceed as above, except that repair synthesis (-) replaces the nucleotides lost during degradation of the "Chi tail" (F to F'). Consequently, hybrid DNA does not cover the Chi site, and the points of Chi- stimulated recombinational exchanges are displaced to the left. The repair synthesis drawn here is primed by a 3' end after formation of the Holliday junction (H'). Alternatively, repair synthesis could be primed by a 3' end before formation of the Holliday junction (G'); enlargement and annealing of the D-loop to the gap would form hybrid DNA at Chi and yield genetic exchange to the right of Chi. The genetic consequences of these steps are discussed by SMITH et al. ( 1 984). (Modified from SMITH et al. 198 1 b.)
mutL in the bacterial host for the lambda cross has an insignificant effect.
Chi-Stimulated Exchange Distribution 7
Deduced Splice
Interval
Correa to
-
I II
N
+ +
n n
Interwl
n n I II
(I h C'
r + = -
(1 + +u h +
x -
-
-
ci
+
++ + +
-
-
I IILh-11
n n
u h +
FIGURE 2.-Misscoring of splice points due to misnlatch correc- tion. A splice point, or point of genetic exchange, is the point where
D N A from one parent is connected to D N A from the other parent. Starting with parents a b c and
+ + +
(with intervals I and I 1 defined by the a-b and b-c intervals, respectively), a recombinant heterodu- plex at b is generated. Correction of the b/+ nlismatch to"+/+"
produces an a+ +
recombinant, suggesting that two single strand exchanges have occurred in interval I . Correction of the misnlatch to "b/b" produces an a b+
recombinant, suggesting that both exchanges have occurred in interval 11. Either suggestion is incor- rect; the recombinant had one exrhange point in each interval.FIGURE 3.-l'urbid. clear and mottled plaques. The photograph, about two times life size, is from a plating of the x+ cross dia- gramnled i n Figure 6 on strain V35 l . To allow different plaque types to be photographed close together, the cross was plated at higher density than was done for cross analyses. Plaque types are as follows: 1. very turbid ((+); 2. very clear ( c l ) ; 3, mottled (cl/c+): 4, slightly turbid ( d l ) .
c160 (KAISER 1957) and x+C, which is a recombina- tional hotspot (STAHL, CRASEMANN and STAHL 1975)
as well as a plaque morphology marker in cll. Thus, recombinants heteroduplex for either or both of these markers were detected as mottled plaques (Figure 3) on mutL::TnlO indicator bacteria. In addition, we screened recombinants for heteroduplex DNA at two additional markers, susN7 and sus029, to the left and right of the c markers, respectively.
Recombination of X Red- Gam- by the RecBCD pathway occurs at a low level in the absence of the canonical Chi sequence. T o determine the contribu- tion of that "background" to recombination occurring
TABLE 1
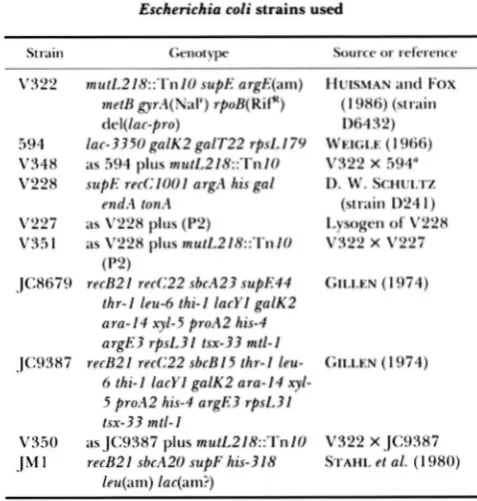
Escherichia coli strains used
SU.;lin Genotype Source or reference
\I322 mutL2lR::TnlO supE argE(an1) HUISWAN ;und FOX mctB gyrA(NaI') rpoB(Rif') ( I 986) (strain
del(1ar-pro) D6432)
594 Iar-3350 galK2 galT22 rpsLl7Y WEIGLE ( 1 966) V348 ;IS 594 plus mutL218::TnIO V322 X 594" V228 supE recCIOOl argA hisgal D. W. SCHULTL
cndA tonA (strain D24 I )
V227 ;IS V228 plus (PP) Lysogen of V228
V351 a s V228 plus mutL218::TnlO V322 X V227
JC.8679 recB21 rerC22 sbcA23 supE44 GILLEN ( I 974)
(P2)
thr-I leu-6 thi-I lacy1 galK2 ara-I4 xyl-5 proA2 his-4 argE3 rpsL3I tsx-33 mtl-1
h thi-I lacy1 galK.2 ara-14 xyl-
5 proA2 his-4 argE3 rpsL3I tsx-33 mll-1
JC9387 recB21 recC22 sbcBI5 thr-I leu- GILLEN ( I 974)
V350 as JC9387 plus m u t L 2 1 8 : T n 1 0 V322 X JC9387
J M 1 recB2l sbcA2O suPF his-318 STAHL et al. (1980)
leu(am) lac(am?)
a A X B , PI transduction where A is the donor and B is the
recipient. Also see MATERIALS A N D METHODS.
in the presence of Chi, a
''x-
cross" containing the inactive x-C209 sequence 5' G-C-T-G-G-T-AG 3' (SCHULTZ, SWINDLE and SMITH 198 1; CHENG and SMITH 1984) in place of Chi, was done in parallel with eachx+
cross.MATERIALS A N D METHODS
Bacterial strains: Bacterial strains are listed in Table 1. The MutL phenotype of strains V348 and V351 was deter- mined by their higher frequency of spontaneous mutation to spectinomycin-resistance (SIECEL and IVERS 1975) relative to the parental strains 594 and V227, respectively.
Phage strains: Phage lambda strains are listed in Table 2. Strains were derived by lytic crosses between phage as described by SCHULTZ, SWINDLE and SMITH (1 98 1) and from our collection.
Culture media: Supplemented tryptone broth (STB) con- tains 1 % (all percents are w/v) Bacto-tryptone (Difco, De- troit, MI), 0.5% NaCI, 0.1% maltose, 0.5 pg/ml thiamine, and 2.5 mM MgS04. BBL agar is 1 % Trypticase peptone (BBL, Cockeysville, MD), 1% Bacto-agar (Difco) and 0.5% NaCI. BBL top agar contains 0.65% Bacto-agar (Difco), 0.5% NaCl and 1.0% Trypticase peptone (BBL). BBL-YE agar is BBL agar containing 0.5% Bacto-yeast extract (Difco). SM is 0.5% NaCI, 1 n1M MgS04, 20 mM Tris-HCI (pH 7.4) and 0.0 1 % gelatin.
8 K. C. Cheng and G. R. Smith
TABLE 2
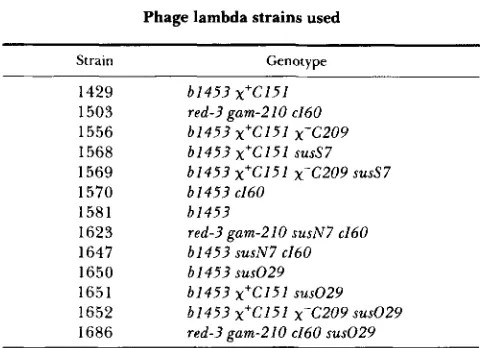
Phage lambda strains used
Strain Genotype
1429 1503 1556 1568 1569 1570 1581 1623 1647 1650 1651 1652 1686
b1453 x+C151 red-3gam-210 c160 b 1 4 5 3 x f C 1 5 1 x - C 2 0 9 b1453 xfC151 suss7 b1453 xfC151 x-C209 suss7 b1453 c160
b I 4 5 3
red-3 gam-210 susN7 c160
b1453 susN7 c160 b1453 susO29 b1453 x'C151 susO29
61453 x+G151 x-C209sus029 red-3 tram-210 c160 susO29
Sources of the alleles are as follows: b1453, HENDERSON and
WEIL (1975); x'CZ51, STAHL, CRASEMANN and STAHL (1975);
susS7, GOLDBERG and HOWE (1969); x-C209, SCHULTZ, SWINDLE and SMITH (1981); red-3, SIGNER and WEIL (1968); gam-210, ZIS-
SLER, SIGNER and SCHAEFER (197 la); susN7 and susO29, CAMPBELL (1961); c160, KAISER (1957).
The following data were used for calculation ofphysical distances
between phage lambda markers in Figures 4, 5 and 6: The nucleo-
tide positions of the gam gene and markers susN7 and suss7 are
given by SANGER et al. (1982) and that of the susO29 marker by RADICELLA, CLARK and Fox (1988). The b1453 deletion ends within the gam gene (HENDERSON and WEILL (1975); for our calculations the right endpoint is assumed to be in the middle of the gene. c160 is in the right part of c l (SMITH 1975), and for o u r calculations is assumed to be 10% from the right end.
STB to about 5 x 10' cfu/ml, incubated at 37" for 20 min, and plated with 2.5 ml BBL top agar on 90-mm Petri plates containing about 40 ml BBL-YE agar per plate poured 1-2 days previously. Plates were incubated at 37" for 40-72 hr before scoring of plaque morphologies. The crosses in Fig- ures 4, 5 and 6 were done on 3 separate days; aliquots of the same bacterial cultures and sets of plates were used for each
x+
andx-
pair.The basis of the selection for recombinants for flanking markers is as follows: gam-210 is suppressed by supE (ZIS- SLER, SIGNER and SCHAEFER 1971a), while the deletion b 1 4 5 3 confers an unconditional Red- Gam- phenotype (HENDERSON and WEIL 1975). P2 lysogens support the growth of only Red- Gam- derivatives of X (ZISSLER, SIGNER and SCHAEFER 1971b), and suss7 is not suppressed by supE
(GOLDBERG and HOWE 1969). Therefore, only 6 1 4 5 3 S+
recombinants grow on the supE (P2) strain V351. Because the morphology of tiny plaques cannot be scored reliably, strain V351 also contains recC1001, which results in an elevated level of recombination compared to rec+, allowing
x-
Red- Gam- to form plaques as large as theirx+
Red-Gam- counterparts (SCHULTZ, TAYLOR and SMITH 1983).
For the crosses in Figures 5 and 6, plaques were scored as Sus if they did not grow after stabbing with sterile toothpicks to lawns of the sup+ strain JC9387 but did grow on the supE strain JC8679; phage were scored as Sus+ if they grew after stabbing to both sup+ and supE strain lawns. Initial scoring of plaque morphologies: Each plaque on the plates was identified by morphology and numbered; note was also taken of proximity to plaques less than 10 mm away (see below under Detection of mixed plaques). The categories of plaques scored were: very clear, slightly turbid, very turbid, mottled and indeterminate (see Figure 3 for examples of plaque morphologies). Indeterminate plaques included any which could not be readily scored by inspec-
tion, such as small plaques and plaques at plate edges. All indeterminate and mottled plaques were retested by poking with a fine platinum needle with a spherical end and streak- ing on lawns of the supE recCIOOl (P2) strain V35 1 on BBL- YE plates.
Detection of mixed plaques: T o harvest the progeny from individual recombinant phage, agar plugs containing individual plaques were picked using sterile Pasteur pipettes into 1 ml of SM plus chloroform and vortexed ("pickates"). To determine the frequency of mixed plaques among re- combinants with each morphology, phages from randomly chosen plaques of each morphology were tested by streaking on lawns of the supE recClOOl (P2) strain V35 1 on BBL-YE plates. Among about 50 very clear plaques from different
x+
andx-
crosses (Figure 5) and 50 slightly turbid plaques fromx-
crosses, none were mixed. Mixed plaques were detected among slightly turbid plaques from thex+
cross and very turbid plaques from bothx+
andx-
crosses. Therefore, all mottled and turbid plaques, all slightly turbid plaques fromx+
crosses and about 10% of the slightly turbid plaques fromx-
crosses were tested for being mixed. Indi- vidual mixed plaques occasionally contained minority pop- ulations as low as about 10%. Thus, a plaque was scored as mixed if the minority plaque type made up at least 10% of progeny phage and a plaque of the minority class was not present on the original plate less than about 1.5 mm away (closer plaques can give cross-contamination; see below). Pickates were restreaked when the proportions of plaque types were not obvious on first streaking. Plaques found to be mixed at c l or c l l in the crosses of Figures 5 and 6 were also scored for Sus as described above.T o test for plaques mixed at susN7 among very clear ( c l ) plaques from the Figure 5 crosses, the very clear plaques were first scored for Sus as described above. T o distinguish between recombinants that were N' on both strands from those that were N+/susN7 heteroduplex (both score as Sus+
by the stab test), all Sus+ recombinant phage were streaked from the supE strain JC8679 stab plate onto lawns ofJC8679 to obtain at least 8 isolated (step 2) plaques. Step 2 plaques were tested for Sus as described above. When all of the step 2 plaques were Sus+, the original c l recombinant was scored as N + on both strands. When one or more of the step 2 plaques were Sus, the original c l recombinant was scored as
N + / s u s N 7 heteroduplex.
To test for plaques mixed at sus029 among very turbid (c+) and slightly turbid ( d l ) plaques from the Figure 6 crosses, plaques were first scored for Sus and then streaked and stabbed as described above for scoring of N+/susN7
heteroduplexes.
T o test how far phage can diffuse from their plaques into contiguous agar, about 50 restreakings were done at differ- ent distances from plaques in platings of different crosses. Phage were found to diffuse as far as about 1.5 mm from a plaque after 3 days' incubation. T o minimize the chance of plaques being too close to each other, platings were done to yield about 40 or fewer recombinant plaques per plate.
Other controls: T o test the relative efficiencies of plating of all recombinant types, plate stocks of phage with the genotypes of the predicted recombinants from each cross were plated on the supE strain JC8679 and on supE recClOO1 (P2) strain V35 1. For all recombinant genotypes, the relative efficiencies of plating on these two strains were within 15% of each other and not consistently higher or lower on either strain on five occasions for the crosses diagrammed in Fig- ures 4 and 5 and on two occasions for the crosses dia- grammed in Figure 6.
Chi-Stimulated Exchange Distribution 9
red.< ,yurn2/0 c160
+
+
\
\
\
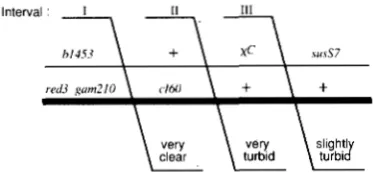
FIGURE 4,“Crosses to determine the distribution of Chi-stimu- lated exchange. The diagram represents two crosses done in paral- lel: in one, the upper parent (phage 1568) contains x+C151 (Chi, 5 ‘ G-C-1-G-G-T-G-G 3’) at xC, and in the other, the upper parent (phage 1569) contains the x-C209 octamer (5’ G-C-x-G-G-T-A-G-
3‘) at X C (underlined bases are changes from wild type) (SCHULTZ, SWINDLE and SMITH 1981). The lower parent for both crosses is phage 1503. The slanted lines represent the three possible locations of exchange in the selected bI453 S+ recombinants (represented in Figure 1 by the upper right recombinant in step I). Crosses were done as described in MATERIALS A N D METHODS. The basis of the selection, scoring for genetic exchange in the three intervals, and scoring for mottled (heteroduplex-containing) plaques are also de- scribed in MATERIALS A N D METHODS. Distances between markers
are not drawn to scale.
First,
x+
andx-
“cross lysates” were reconstructed using mixtures in SM of (1) parental phage alone, (2) parental phage plus one pure recombinant genotype phage at a time(50-1 00 recombinants per plate) and (3) parental phage plus all expected recombinant phage types (strains 1570, 1581,
1429 and 1556; 50-100 plaques per plate) on supE recCIOOl
(P2) strain V35 1 in proportions expected in the cross lysates (from earlier platings for total and for recombinant phage). Reconstructions 1, 2 and 3 yielded no plaques, plaques of only the recombinant type added, and plaques of all types, respectively, in expected numbers. N o mottled plaques were observed in any of these platings; 8 to 10 plaques of each type were streaked out and retained their original mor- phology.
T h e second set of controls, using the
x+
cross of Figure6, was designed to determine whether “rescue” of parental genomes (particularly the suss7 parent, which can grow in nonsuppressing strains without cell lysis) can yield mixed plaques on the plating bacteria. From a typical plating for recombinants on supE recClOOl (P2) strain V35 1, we picked five well-isolated, individual plaques of each morphological type: very clear, slightly turbid and very turbid. Platings of
0.05 ml of a
lo-*
dilution of each pickate yielded about 500plaques on the permissive supF recB sbcA strain J M 1 (which would allow parents, as well as recombinants, to grow) on BBL-YE plates; all plaques were of the original rather than parental plaque type. Plating of 0.2 ml (undiluted) of five pickates from areas of bacterial lawn not containing visible plaques formed no plaques on JM1. Together, these results indicate that recombination between surviving parental
phage and recombinants cannot account for mixed plaques. To test for accurate scoring of c l and c l l genotypes, 10 c l
(very clear) and 8 c l l (slightly turbid) recombinant plaques, and 18 c l and 6 c l l plaques from streakings of mixed plaques from the Figure 4
x+
cross, were tested for complementation by spotting with known c l or c l l phage (KAISER 1957). All complementation results were consistent with the initial scorings. No c l c l l double mutants (expected to be c l by visual scoring) were observed.RESULTS
Three sets of X Red- Gam- crosses were analyzed to determine the distribution of Chi-stimulated ex-
change and to determine the frequency and extent of Chi-stimulated heteroduplex regions. T h e X phages were Red-, to eliminate X’s own homologous recom- bination system, and Gam- to eliminate X’s inhibitor of the RecBCD enzyme (for a review see SMITH 1983). T h e first set of crosses, containing the fewest markers, is the simplest; the second and third sets incorporate additional markers to the left and to the right of Chi, respectively. Each set consisted of a
x+
and ax-
cross conducted and analyzed concurrently (Figures 4, 5 and 6). T h e b1453 S+ recombinants from these crosses were analyzed to determine: ( 1 ) the overall distribu- tion of exchanges (of which heteroduplex-containing recombinants comprise a subset) and(2)
the structures and frequencies of heteroduplexes detected among those recombinants. (Recombinants parental for flanking markers were not examined.) T h e results of the three sets of crosses are compared at the end of the RESULTS (see Table 9).T h e first set of crosses is represented in Figure 4,
and the overall distribution of exchanges is presented in Table 3. T h e frequency of recombinants with ex- changes in each interval was calculated from the total phage titers and the titers of recombinants with ex- changes in each interval. For intervals I and 11, to the left of Chi, the recombinant frequencies from the
x+
cross were 5.9- and 5.5-fold higher, respectively, than those from thex-
cross. For interval 111, to the right of Chi, the correspondingx+/x-
ratio was 0.73. These results show that Chi stimulated recombinationstrongly to its left but not detectably, by this measure, to its right.
10 K . C. Cheng and G. R. Smith
Interval : la Ib I I 111
h14S.f
+
+
XC rusS7I I I
i
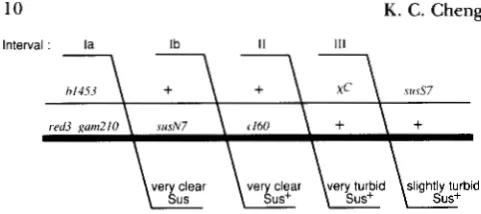
FIGURE 5,"Crosses to determine the distribution of Chi-stimu- lated exchange to the left of cI60. T h e crosses diagrammed here are identical to those diagrammed in Figure 4, except that the lower parent (phage 1623) contains the additional marker susN7.
Recombinants in intervals Ia, Ib, 11 and 111 are scored as very clear
Sus, very clear Sus+, very turbid, and slightly turbid, respectively, as described in MATERIALS A N D METHODS.
TABLE 3
Distribution of Chi-stimulated exchanges
Interval . . . I I1 111
Interval size(bp). . . . . 4900 580 6,869 12,350 Total
% of total bp . . . 40 4.7 56 100
~~~~~~ ~~~ ~
Recombinant frequency (%)
X+ 3.0 0.61 1 . 1 4.7
X - 0.51 0.11 1.5 2.1
Ratio of frequencies 5.9 5.5 0.73 2.2
% of b1453 S+ recombinants
X+ 64 13 23 100
X 24 6 70 100
X+ 1.6 2.8 0.41
X 0.6 1.3 1.3
-
% of recombinants + % of total bp
-
Crosses (Figure 4) were carried out in sup+ mutL::TnIO strain
V348 and plated on supF recE sbcA strain J M 1 for total phage and on supE recCl00I (P2) mutL strain V351 for b1453 Sf recombinant phage as described in MATERIALS AND METHODS. For the x+ and x- crosses the total titers were 1 . 1 X 10' and 3.3 X lo', res ectively, and the recombinant titers were 5.2 X lo 6 and 7.0 X 10 , respec- tively. (All phage titers are in p.f.u. per ml of cross lysate.) For the
X + and x- crosses a total of 167 recombinant type plaques on six plates and 227 plaques on 13 plates, respectively, were analyzed for genotype as described in MATERIALS AND METHODS. Each phage type in a mixed plaque, containing heteroduplex DNA a t c l o r c l l
or both was scored as a half plaque (see Table 4). Interval sizes were calculated from the mapping data referenced in Table 2. T h e sizes of intervals I and I1 are approximate. Recombinant frequency is the titer of phage with exchanges in the indicated interval divided by the total phage titer. "% of b1453 S+ recombinants" is the % of all selected recombinants with exchanges in the indicated interval. In the last two rows of data, these percentages are normalized for each interval's physical size (see RESULTS).
P
crosses (STAHL et al. 1974). There was a slightly higher intensity of exchanges to the right of
xC
than to its left, which may reflect the low level activity of se- quences differing from Chi at one base pair and weakly stimulating recombination in the interval to the right of X C (CHENG and SMITH 1984). For thex+
cross, however, the distribution was markedly skewed to the left of Chi: the relative intensity was greatest (2.8) for the small interval immediately to the left of Chi, less (1.6) for a more distant interval to the left, and below unity (0.41) for the large interval to the right of Chi. In summary, by two measures (not en- tirely independent) Chi stimulated recombination inthis cross to its left but not detectably to its right. (But see below for a cross with a shorter interval to the right of Chi.)
Plausible structures and frequencies of heterodu- plex-containing recombinants from these crosses are shown in Table 4. The frequency of such recombi- nants among total phage progeny was 0.45% from the
x+
cross and 0.10% from thex-
cross. These hetero- duplex-containing recombinants accounted for 10% of the selected 61453 S+ recombinants from thex+
cross and 5 % from thex-
cross. These are minimal estimates of the frequency of hybrid DNA, since some hybrid DNA-containing recombinants could have es- caped detection due to residual mismatch correction, absence of a marker at hybrid DNA regions, or loss of one or the other genotype. Such underestimations are expected to be equal, however, for thex+
andx-
crosses. In subsequent crosses (&e Tables 6 and 8) higher frequencies of heteroduplex-containing re- combinants were also observed, by both measures, for thex+
crosses than for thex-
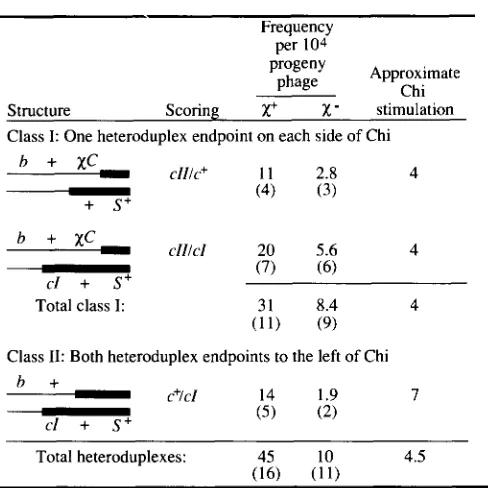
crosses. From these results we infer that most of the heteroduplex-con- taining recombinants were Chi-stimulated.T h e heteroduplex structures in Table 4 are defined by the markers cI60 and x+C or x-C209 and are of two classes: I) those with one heteroduplex endpoint on each side of Chi, and 11) those with both hetero- duplex endpoints to the left of Chi. For the
x+
cross class I heteroduplexes, predicted by the model in Figure 1 , accounted for about 70% of the heterodu- plex-containing recombinants. T h e class I1 heterodu- plexes, predicted by degradation of the Chi tail, ac- counted for the remaining 30%.T o determine with greater precision the distribu- tion of Chi-stimulated exchange in interval I to the left of cZ60, crosses were done with the additional marker susN7 in that interval (Figure 5 and Table 5).
In these crosses, very clear plaques ( c l ; Figure 3) were tested for their genotype at susN7 (pure Sus, pure Sus+, or heteroduplex) as described in MATERIALS AND METHODS. T h e ratio of the
x+
recombinant frequency to thex-
recombinant frequency was greatest (4.4 and 4.1) for the intervals immediately to the left of Chi, less (2.0) for the interval farther to the left, and less than unity (0.54) for the long interval to the right of Chi. After normalization for interval size a similar pattern was seen for the relative intensity of exchange per unit physical distance in thex+
cross: the relative intensity was greatest immediately to the left of Chi(2.8), progressively declined farther to the left (2.0
and l . l ) , and was less than unity (0.46) to the right of Chi. T h e intensity of exchanges in the
x-
cross was approximately constant in the four intervals. These results are in concordance with those of the previous crosses (Table 3).Chi-Stimulated Exchange Distribution 11
TABLE 4
Structures and frequencies of heteroduplex-containing recombinants from the crosses of Figure 4
Frequency per IO4
progeny Approximate
phage Chi
Structure Scoring
x+
x -
stimulationClass I: One heteroduplex endpoint on each side of Chi
-
Cll/C.+ 11 2.8 4-
(4) ( 3 )h
+
XC-k s+
clllcl 20 5.6 4
-
(7) (6) cl is+
Total class I:
Class 11: Both heteroduplex endpoints to the left of Chi
-
C+ICl 14 1.9 7h +
T+
( 5 ) (2)Total heteroduplexes:
(16) (11)
45 10 4.5
These data comprise a subset of those in Table 3. Thin and thick lines represent DNA from upper and lower parents (Figure 4), respec- tively. Crosses were performed as described in Figure 4 and Table 3.
For scoring see MATERIALS AND METHODS. b, c l , XC and S+ refer to
b1453, c160, x+C151 (or x-C209) and S+ respectively. Structures are not drawn to scale. Frequency is the titer of each heteroduplex- containing recombinant phage divided by total phage titer. Numbers of plaques observed are in parentheses. Chi stimulations (x' frequency/ x- frequency) are approximate, due to the small numbers of plaques.
TABLE 5
Distribution of Chi-stimulated exchanges to the left of cI60
Interval . . . , . . . . la Ib 11 111 Total
Interval size (bp). . . . . 2,200 2,700 580 6,869 12,350
% oftotal bp . . . 17 22 4.7 56 100
Recombinant frequency
X+ 0.92 2.1 0.62 1.3 5.0
X 0.45 0.48 0.15 2.4 3.6
Ratio of frequencies 2.0 4.4 4.1 0.54 1.4
-
% of b1453 S+ recombinants
X+ 18 43 13 26 100
X 13 14 4 69 100
X+ 1 . 1 2.0 2.8 0.46
X 0.8 0.6 0.9 1.2
-
% of recombinants + % of total bp
-
Crosses (Figure 5) were carried out and analyzed as discussed in
MATERIALS AND METHODS and in the legend to Table 3. For the x+
cross and x- crosses, the total titers were 5.6 X lo7 and 8.1 X lo6
res ectively, and the recombinant titers were 2.8 X IO6 and 2.9 X 10
P
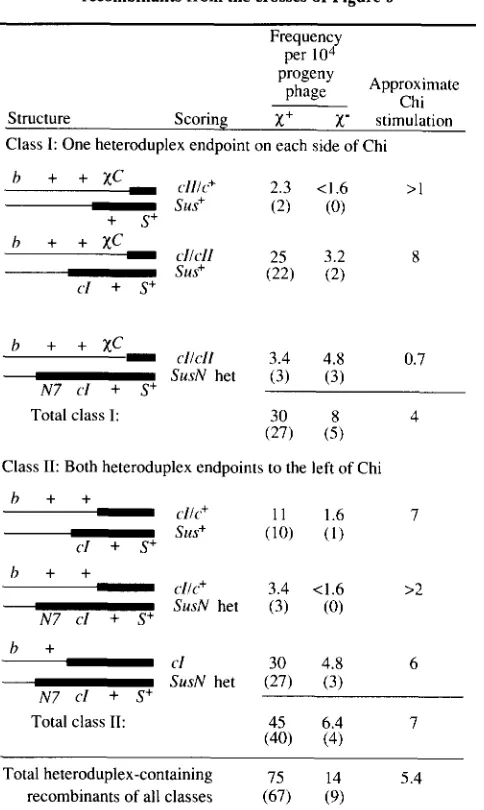
, respectively. (All phage titers are p.f.u. per ml of cross lysate.) For the x+ and x- crosses a total of 445 recombinant-type plaques on 25 plates and 224 plaques on 25 plates, respectively, were analyzed.plex-containing recombinants from these crosses are shown in Table 6 . T h e frequency of stlch recombi- nants among total phage progeny was about five times higher from the
x+
cross than from thex-
cross. OfInterval : I II llla lllb
h I453 i xc
+
rv.67\ \ \
FIGURE 6.-Crosses to determine the distribution of Chi-stimu- lated exchange to the right of Chi. These crosses are identical to
those shown in Figure 4, except that the lower parent (phage 1686)
contains the marker sus029 in addition to c160. Recombinants in intervals I , 11, IIIa and IIIb are scored as very clear, very turbid, slightly turbid Sus and slightly turbid Sus+, respectively, as described in MATERIALS AND METHODS.
the selected b1453 S+ recombinants 15% were heter- oduplex-containing from the
x+
cross, and4%
from thex-
cross. For thex+
cross class I heteroduplexes, with one endpoint on each side of Chi as predicted by the model in Figure 1, accounted for 40% of the total; the remainder were class I1 heteroduplexes, with both endpoints to the left of Chi. Recombinants heterozy- gous for bothx+C
and cZ60 were frequent: about one- third of the total heteroduplex-containing recombi- nants were of this class, the type predicted by the model in Figure 1 . Heteroduplexes were occasionally detected over susN7, cZ60, andx+C;
if continuous, this heteroduplex DNA was at least 3318 bp long.T o determine with greater precision the distribu- tion of Chi-stimulated exchange in interval 111, to the right of Chi, crosses were done with the additional marker susO29 in that interval (Figure 6 and Table
7).
In these crosses all very turbid (c+), slightly turbid(cZZ), and mottled plaques were tested for their geno- type at susO29. T h e ratio of the
x+
recombinant frequency to thex-
frequency was greatest (23) for the short interval immediately to the left of Chi and less ( 1 3) for the interval farther to the left, in accord with the results of the previous crosses. With a short interval to the right of Chi now defined by thex+C
and susO29 markers, Chi stimulation was detected to the right of Chi
(x+/x-
ratio of 5.1). T h e least, and perhaps insignificant, stimulation (1.5) was observed in the interval farther to the right. A similar pattern was seen after normalizing for interval size: the rela- tive intensity of exchange in thex+
cross was greatest (2.8 and 2.3) for the intervals immediately to the left and right of Chi. These intervals are of similar size (about 580 and 43 1 bp), and the relative intensity was about the same for both. T h e relative intensity for the interval farther to the left was less (1.4), and that for the interval farther to the right was less than unity (0.42). In summary, these data show that Chi stimu- lated recombination most strongly immediately to its left and right, less farther to its left, and perhaps insignificantly farther to its right.12 K. C. Cheng and G. R. Smith
TABLE 6
Structures and frequencies of heteroduplex-containing recombinants from the crosses of Figure 5
Frequency per 104
progeny Approximate
phage Chi
Structure Scoring
x+
X stimulationClass I: One heteroduplex endpoint on each side of Chi
h + +
xc
-
sus+ (2) (0)2.3 <1.6 > I
+ s+
h
+ +
XC-N 7 c l + S+
c l i c l l 3.4 4.8 0.7
SusN het (3) (3)
Total class I:
Class 11: Both heteroduplex endpoints to the left of Chi
h + +
-
-
C l / C + 11 1.6 7sus+ (10) (1)
e l +
s+
h + +
-
clic" 3.4 <1.6 >2SusN het (3) (0)
N 7 el + S+
h i
-
e l 30 4.8 6SusN het (27) (3)
Total class 11: 45 6.4 7
N 7 c l + S+
(40) (4)
Total heteroduplex-containing I 5 14 5.4 recombinants of all classes (67) (9)
These data comprise a subset of those in Table 5. Thin and thick lines represent D N A from upper and lower parents (Figure 5), respec- tively. Crosses were performed as described in Figure 5 and Table 5.
Sus scoring refers to genotype at susN7. SusN het means heteroduplex with N + on one strand and susN7 on the other. N 7 refers to susN7; for other abbreviations and details, see the legend to Table 4.
tion to the right of Chi, we plated the cross lysates on the sup+ mutL strain V350 to select directly for O+S+
recombinants (interval IIIb, Figure 6). T h e recombi- nant frequencies were 5.1 % and 5.2% for the
x+
andx-
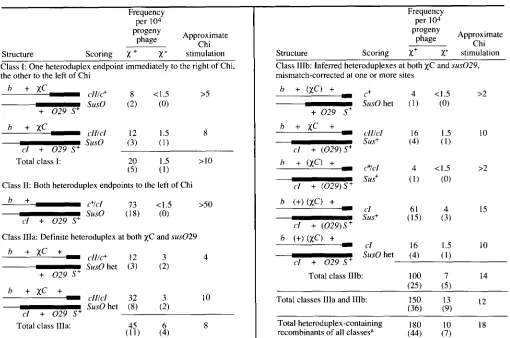
crosses, respectively. In accord with the previous data, Chi did not detectably stimulate recombination in the interval beginning 43 1 bp and ending 6869 bp to its right.Plausible structures and frequencies of heterodu- plex-containing recombinants from these crosses are shown in Table 8. susO29 to the right of Chi allows us in this case to define three classes of heterodu- plexes: I) those with one heteroduplex endpoint on each side of Chi, with the right endpoint between Chi
TABLE 7
Distribution of Chi-stimulated exchanges to the right of Chi
Interval . . . 1
Intervalsiae(bp). . . . . 4,900 580 431 6,438 12,350
11 IIIa IIIb Total
'3% total interval. . . . 40 4.7 3 . 5 52 100
Recombinant frequency (%)
X+ 13 2.8 1.8 5.1 22
X 1.0 0.12 0.35 3.3 4.8
Ratio of frequencies 13 23 5.1 1.5 4.6
-
% of b1453 S+ recombinants
X+ 57 13 8 22 100
X 21 2.5 7.4 69 100
X+ 1.4 2.8 2.3 0.42
X 0.53 0.53 2.1 1.3
-
% of recombinants
+
% of total bp-
Crosses (Figure 6) were carried out and analyzed as described in
MATERIALS AND METHODS and in the legend to Table 3. For the x+ and x- crosses, the total titers were 1.7 X l o 7 and 2.1 X lo', res ectively, and the recombinant titers were 3.7 X 10' and 1.0 X 10
9
, respectively. (All phage titers are p.f.u./ml of cross lysate.) For the X+ and x- crosses a total of 551 recombinant-type plaques on 20 plates and 326 plaques on 20 plates, respectively, were analyzed.and susO29, 11) those with both heteroduplex end- points to the left of Chi, and 111) those with hetero- duplex spanning both Chi and rightward marker
susO29. In the previous crosses recombinants of the third class would have been included among class I heteroduplexes. In contrast to the results of the pre- vious crosses, a large number of multiple exchange recombinants were detected. We inferred the contin- uous heteroduplex DNA structures (class IIIb) that would account for the multiple exchange recombi- nants by mismatch correction. Mismatch correction occurs in mutL mutant hosts for some nonsense mark- ers in DNA replication genes, such as susO29, when heteroduplex phage are analyzed under restrictive conditions (RADICELLA, CLARK and FOX 1988); such mismatch correction may have altered the heterodu- plexes in our crosses. This possibility renders the conclusions about the heteroduplexes from this third set of crosses somewhat uncertain.
Chi-Stimulated Exchange Distribution
TABLE 8
Structures and frequencies of heteroduplextontaining recombinants from the crosses of Figure 6
13
Frequency per 104
progeny Approximate
phage Chi
Structure Scoring X +
x-
stimulationClass I: One heteroduplex endpoint immediately to the right of Chi, the other to the left of Chi
-
C l l / C + 8 < I .5 >5h
+
XCsuso (2) ( 0 )
h
+
X C-
c l l l c l 12 1.5 8suso ( 3 ) ( I ) el
+
0 2 9 S+Total class I:
Class 11: Both heteroduplex endpoints to the left of Chi
-
h + cVcI 73 < I S >50c l + 0 2 9 S+ suso ( 18) ( 0 )
Class IIIa: Definite heteroduplex at both xC and sus029
-
-
clllc+ 12 3 4SusO het ( 3 ) ( 2 )
h + x C
+
+ 0 2 9 S+
h + x C +
-
c l l l c l 32 3 I Ocl
+
0 2 9 S+ SusO het (8) (2)Total class IIIa:
(ff)
(2)
8Frequency per 1 0 4
progeny Approximate phage Chi
Structure Scoring X+
X-
stimulationClass IIIb: Inferred heteroduplexes at both xC and sus029,
mismatch-corrected at one or more sites
Total class IIIb: 100 7 14
(25) 15)
Total classes Illa and IIIb: 150 13
(36) (9) I 2
Total heteroduplex-containing 180 10 18
recombinants of all classesa (44) (7)
A
These data comprise a subset of those in Table 7. Thin and thick lines represent DNA from upper and lower parents (Figure 6),
respectively. Crosses were performed as described in Figure 6 and Table 7. Markers in parentheses were inferred to have been in the heteroduplex before mismatch correction. Sus scoring refers to genotype at sus029. Sur0 het means heteroduplex with O+ on one strand and
susO29 on the other. 0 2 9 refers to rus029; for other abbreviations and details see legend to Table 4.
a Among the class IlIb recombinants, only c l Sus+ plaques were not truly scored as heteroduplexes; their generation can be either via
mismatch correction of the structure drawn or by multiple exchanges (intervals I , IlIa and IIIb). These were not included in the calculation of total heteroduplex-containing recombinants of all classes.
for by the modifications of the model suggested in the
Table 9 summarizes the data from all three crosses for comparison. Nearly all of the measured parame- ters were reproducible from cross to cross. T h e ex- ception was the higher frequency of recombinants in the
x+
cross of Figure 6. T h e basis of this difference is not known, but after normalization for interval sizes, the relative intensities of exchange from this cross agree with those from the other crosses. T h e differ- ence may simply be due to a lower total phage yield determination for thex+
cross of Figure 6.Figure 7 displays the distribution of exchanges in the presence of Chi for the crosses diagrammed in Figures 4 , 5 and 6. We graphed the relative frequency of exchange per unit physical distance for each inter- val vs. the position of each interval relative to Chi. T h e data indicate an exponential decrease in the DISCUSSION.
frequency of exchange to the left of Chi, significant exchange immediately to the right of Chi, and only “background” exchange ( i e . , equivalent to that in the absence of Chi) farther to the right of Chi.
Chi reproducibly stimulated the appearance of het- eroduplex DNA among the recombinants (Table 9). Frequently, one endpoint of this heteroduplex was to the right of Chi, and the other was to the left of Chi (Tables 4, 6 and 8).
14 K. C. Cheng and G . R. Smith
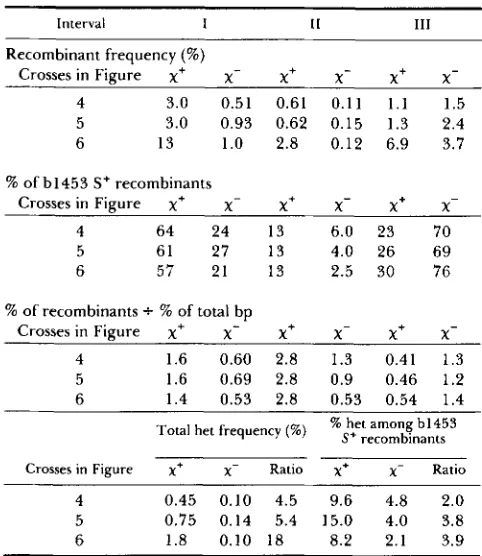
TABLE 9
Summary of data for the crosses in Figures 4,5, and 6
Interval 1 11 I11
Recombinant frequency (%)
Crosses in Figure x+ X - X+ X -
x+
x-4 3.0 0.51 0.61 0.11 1 . 1 1.5 5 3.0 0.93 0.62 0.15 1.3 2.4
6 13 1.0 2.8 0.12 6.9 3.7
% of b1453 S+ recombinants
Crosses in Figure x+ X - X + X - x+ x-
4 64 24 13 6.0 23 70
5 61 27 1 3 4.0 26 69
6 57 21 13 2.5 30 76
% of recombinants + % of total bp
Crosses in Figure x+ X - X+
x-
x+
x-4 1.6 0.60 2.8 1.3 0.41 1.3 5 1.6 0.69 2.8 0.9 0.46 1.2
6 1.4 0.53 2.8 0.53 0.54 1.4
Crosses in Figure x+ x- Ratio x+ x- Ratio 4 0.45 0.10 4.5 9.6 4.8 2.0
5 0.75 0.14 5.4 15.0 4.0 3.8
6 1.8 0.10 18 8.2 2.1 3.9
The data are derived from Tables 3-8 and shown here to demonstrate the reproducibility from cross to cross. For the crosses in Figure 5, the data for intervals Ia and Ih are combined; for the crosses in Figure 6, the data for intervals IIIa and IIIb are com- bined.
Chi
t
1 .or
ma
0.8 - L
IIIb
I
01 I
8 6 4 2 0 2 4 6 8
Distonce from Chi ( k b )
FIGURE 7.-Distribution of recombinational exchanges in the presence of Chi. The relative frequency of exchange per unit physical distance is proportional to the relative intensity of recom- binational exchanges for each interval (% of recombinants + % of total base pairs; Tables 3, 5 and 7). The endpoints of each line segment denote the positions, relative to Chi, of the markers defin- ing each interval measured (Figures 4, 5 and ,6). The point in the middle of each segment indicates the frequency of exchange per unit physical distance, normalized by setting that for interval I1
equal to 1 . The solid line indicates the distribution predicted by the model in Figure 1 , with a 7-fold Chi-stimulation near Chi and an exponential distribution of exchanges to the left of Chi decreasing 2-fold for each 3.2 kb.
guished from
N+
recombinants since they made only a minor contribution. T h e following nuclease mutants showed no significant change in the distribution of Chi-stimulated exchange in such crosses (data not shown): the 3'+5' single strand exonuclease I (prod- uct of sbcB; KUSHNER et al. 197 1; YAJKO, VALENTINE and WEISS 1974), the bidirectional single strand exo- nuclease ExoVlI (product of xseA and xseB; CHASE and RICHARDSON 1977; VALES, RABIN and CHASE 1983), and the 3'+5' proofreading exonuclease func- tions of Pol1 (polAlex-; KORNBERC 1980) and Pol111 (€-subunit, product of dnaQ; SCHEUERMANN and ECHOLS 1984; SCHEUERMANN et al. 1983). Crosses in strains containing plasmids overproducing RecBCD enzyme (PONTICELLI et al. 1985), the X Gam protein (FRIEDMAN and HAYS 1986), RecA protein (MCENTEE 1977), Ssb protein (R. MCMACKEN, personal commu- nication), exonuclease I or DnaQ protein also showed no significant differences (data not shown).DISCUSSION
T o test a model of Chi-stimulated recombination (Figure l ) , phage lambda crosses (Figures 4, 5 and 6) were performed in hosts with impaired mismatch cor- rection. Overall, the results (Tables 3 , 5,
7,
and sum- marized in Table 9 and Figure7)
show, by two meas- ures, that Chi stimulation was greatest in the intervals immediately to the right and left of Chi. Stimulation was not detectable farther to the right (more than 43 1 bp to the right of Chi). Stimulation decreased expo- nentially with distance to the left: a 2-fold decrease per 3.2 kb. This distance-dependence was similar to that reported by ENNIS, AMUNDSEN, and SMITH (1987), a 2-fold decrease per 2.2 kb for crosses em- ploying large heterologies. (The crosses reported here employed only single base pair mutations in the region where recombination was measured.) As inferred from heterozygous phage particles, Chi stimulated the formation of heteroduplex DNA, both at itself and to its left (Tables 4, 6 and 8). A frequently observed class of heteroduplexes had one endpoint to the right of Chi and the other endpoint to the left of Chi.Chi-Stimulated Exchange Distribution 15
Two findings call for a minor modification of the model in the top part of Figure 1. First, more than half of the Chi-stimulated exchanges were to the left of Chi (Tables 3, 5 and
7).
Second, Chi stimulated the formation of recombinants containing heteroduplex DNA far to the left of Chi but not covering Chi (classI1 heteroduplexes, Tables 4, 6 and 8). These findings are readily accommodated by degradation of the sin- gle-stranded DNA containing Chi (“Chi tail,” step F in Figure 1) more than about 10 nucleotides before synapsis (step F’). T h e resultant recombinants would not be heteroduplex at Chi, and the points of strand exchange would be to the left of Chi (step 1’, Figure 1). Chi tail degradation cannot occur every time, however, since cass I heteroduplexes, which are het- eroduplex at Chi and are inconsistent with such deg- radation, make up a significant proportion of the detected heteroduplex-containing recombinants. Fur- thermore, we observed significant stimulation of ex- change immediately to the right of Chi, which in the context of the model in Figure 1 requires the Chi tail to remain intact.
T h e most sensitive estimate we have of the fre- quency of degradation of the Chi tail derives from the Figure 5 crosses, where two markers to the left of Chi permit detection of heteroduplex DNA at those mark- ers. About 60% of the heteroduplex-containing re- combinants from the
x+
cross had both heteroduplex endpoints to the left of Chi (Table 6), implying that, in the context of the model in Figure 1, about 40% of the Chi tails remained intact. Consideration of the fraction of all exchanges to the right and left of Chi (not just those with detected heteroduplex) gives a similar estimate of the fraction of the Chi tails that remain intact. Of the exchanges in thex+
crosses, 23% to 30% were to the right of Chi (Table 9; CHENG and SMITH 1984). In summary, the Chi tail appears to remain intact about 25% to 40% of the time. (Degradation of the Chi tail less than 10 nucleotides, from its 3’ end to thex+C15I
mutation, could not have been detected.)Those instances in which the Chi tail is degraded can account for Chi’s action to its left when opposite a large heterology (STAHL and STAHL 1975; STAHL et
al. 1980) and for localized DNA synthesis in the vicinity of Chi (SIEGEL 1974) (see bottom part of Figure 1). After degradation of the Chi tail through the region of heterology into the region of homology, strand invasion by the resultant single-stranded DNA 3’-end can be promoted by RecA and SSB proteins (KONFORTI and DAVIS 1987). Degradation past the heterology boundary, or in the absence of any heter- ology, would leave a single-stranded DNA gap which could be filled by DNA polymerase. This gap filling can account for the localized DNA synthesis near Chi in a fully homologous ‘‘cross” (SIEGEL 1974), the OC-
currence of some recombinants without detectable heteroduplex at or near Chi (Tables 4, 6 and 8), and the requirement for DNA polymerase I for Chi-stim- ulated recombination (ENNIS, AMUNDSEN, and SMITH
1987).
T h e model in Figure 1 predicts that recombinants parental for flanking markers (Figure 1, I left) initially contain heteroduplex with the single strand insertion on the I strand of X (the strand with its 3’ end on the right). ROSENBERG (1987) reported that the single- strand insertion is on the r strand. T h e genetic factor responsible for this strand bias in the observed heter- oduplexes has not been reported, but neither Chi nor cos (X’s cohesive end site) appear responsible (ROSEN-
BERG 1987, 1988). Most (about 75%) of the recom- binants parental for flanking markers reported in her studies were homoduplex at the monitored susP80 marker, whether DNA replication was blocked or not. T h e formation of those homoduplex recombinants may have involved mismatch correction, which may have abolished heteroduplexes with a single-strand insertion of the 1 strand. Mismatch correction occurs in mutL mutant hosts, as ROSENBERG (1987, 1988) used, for some nonsense markers in DNA replication genes, such as susP80, when heteroduplex phage are analyzed under restrictive conditions (RADICELLA, CLARK and Fox 1988). In the heteroduplexes re- ported here, it was not possible to test for strand bias since the heteroduplexes were necessarily replicated during plaque formation.
A minority of the recombinants studied here were heteroduplex at a marker (susO29) located 431 bp to the right of Chi (Table 8). This class of recombinants is not predicted by the models in Figure 1. These Chi- stimulted recombinants may have arisen from synapsis of the 5’ ended single-stranded DNA tail to the right of Chi (Figure 1, step D) with homologous DNA or from more complex events. SMITH et al. (1 984) pro- posed an alternative model for Chi-stimulated recom- bination in which invasion by a degraded 3 Chi tail leads to heteroduplex DNA spanning Chi and markers both to its left and to its right. That model can account for the minority recombinants observed here.