Speaker Identification Based Speaker
Segmentation for Meeting Data
Pooja Gaud
1, Dr.Vaishali Patil
2P.G. Student, Department of Electronics and Telecommunication Engineering, Dr.J.J.Magdum College of Engineering,
Jaysingpur, Maharashtra, India1
H.O.D. of Electronics Engineering Department, Dr.J.J.Magdum College of Engineering, Jaysingpur, Maharashtra,
India2
ABSTRACT:Speaker segmentation is the process of annotating an input audio with information that attributes temporal regions of the audio signal to their respective sources, which may include both speech and non-speech events. For speech regions, the segmentation system also specifies the locations of speaker boundaries and assign relative speaker labels to each homogeneous segment of speech. The resulting system is flexible to any meetings room layout regarding the number of microphones and their placement. Finally, it takes a step forward into the use of parameters that are more robust to changes in the acoustic data. The main task of this project is to study and research the techniques, algorithms of speaker identification, thus to create a feasible system to simulate the speaker identification.
KEYWORDS: Speaker identification, Speech activity detection, Feature extraction, Speaker segmentation.
I. INTRODUCTION
Speaker identification has emerged as an increasingly important and dedicated domain of speech research. Whereas speaker and speech recognition involve, respectively, the recognition of a person‟s identity or the transcription of their speech. More formally this requires the unsupervised identification of each speaker within an audio stream and the intervals during which each speaker is active [1].
In recent years, segmentation has been applied to spontaneous multi-party discussions also informally known as meeting recordings. Speaker segmentation is trivial if meeting participants have their own recording instruments such as lapel microphones or individual headset microphones. However, audio recording is often performed in a “non-intrusive manner” using Single Distant Microphone (SDM).
This includes determining how many speakers are present in the meeting as well as identifying the speech segments of each speaker in an unsupervised manner. In short speaker segmentation consists of detecting number of speakers and speech corresponding to each speaker and we review key sub-tasks needed to perform speaker identification namely, Speech Activity Detection, Feature Extraction and Speaker Change Point Detection [2].
II. SPEAKERIDENTIFICATIONPROCESS
This section gives information about the speaker identification process, it consists of speech activity detection, feature extraction and speaker segmentation. Fig.1 shows the speaker identification process.
Fig.1. Speaker Identification Process
1. Speech Activity Detection-
Speech activity detection refers to identification of regions that contain speech from the participants present in the meeting recording. The purpose of this stage is to classify the audio into speech & non speech regions. The non -speech regions may contain silence, any meeting room noise, other sounds such as laugh, background music etc. It is important to identify & discard non speech regions such as music & noise early in the diarization process to avoid hindering subsequent speaker segmentation process. This stage is used to remove only prolonged periods of music or noise, rather than targeting short speaker pauses in the middle of speaker turns & thus breaking up homogeneous speaker segments [3].
2. Feature Extraction-
The most important thing in speaker identification project is the feature extraction where it extracts features from speech signal. Feature extraction is a process in which it transforms the input data into set of features is called feature extraction. In feature extraction it reduces the dimension of the input vector while retains the important discriminating feature of a speaker [5].
3. Speaker Segmentation-
III. RELATEDWORK
This section includes the task, performed during speaker identification system implementation. It consists of database creation, speech activity detection, feature extraction and speaker segmentation.
1. Database Creation-
The very first step in our project is database creation. We created a database in our own laboratory with the help of microphone, headphone & digital voice recorder such as pratt. We developed the database in „Marathi‟ language. For creation of database we collect data from 5 male and 3 female speakers and total data collection is of 8 different speakers. We record 20 clips of each speaker and each clip is of 1 minute duration and we record total database is a period of 2 hour 40 minute duration.
Cool edit tool is also used while creating a database. This tool provides various facilities, using this tool we give various effects to the recorded audio signal. We have to amplify the weak recorded signal using this tool and this tool is also used for data of multiple speakers will be mixed to form the data corresponding to meeting discussion.
2. Speech Activity Detection-
After database creation the very important step is to determine the speech/non speech detection in the recorded signal. It is important to identify & discard non speech regions such as music & noise early in the diarization process to avoid hindering subsequent speaker segmentation process [7].Here we used energy based detector for speech/nonspeech detection because of its simplicity, this detector is works on the principal that energy of nonspeech signal is low while the energy of speech signal is high.
3. Feature Extraction-
The first step in any automatic speaker recognition system is to extract features i.e. identify the components of the audio signal that are good for identifying the linguistic content and discarding all the other stuff which carries information like background noise, emotion etc. The main point to understand about speech is that the sounds generated by a human are filtered by the shape of the vocal tract including tongue, teeth etc. This shape determines what sound comes out. If we can determine the shape accurately, this should give us an accurate representation of the phoneme being produced. The shape of the vocal tract manifests itself in the envelope of the short time power spectrum, and the job of MFCCs is to accurately represent this envelope. Mel Frequency Cepstral Coefficients (MFCCs) are a feature widely used in automatic speech and speaker recognition [8].
In order to obtain MFCC coefficient the input speech signal is windowed and taken Discreet Fourier transform to convert into frequency domain. Here we are using bank filter to wrapping the mel frequency. And then a log magnitude of each of the mel frequency is acquired. Then the resultant signal is transformed using an inverse DFT into cepstral domain. The lower order coefficients are selected as the feature vector to avoid higher coefficients since it contains less specific information about speaker. Then the coefficients are uniformly spaced and used as output feature vector for that speech frame [5].
4. Speaker segmentation-
Speaker segmentation is the process of segmenting an audio signal into speaker homogeneous regions, addressing the question “who spoke when?” without any prior knowledge of the number of speakers, specific speaker models, text, language, or amount of speech present in the recording. We used Gaussian Mixture Models (GMMs) as a classifier, trained with frame-based cepstral features for identification of speaker and it performs both speaker segmentation and speaker identification [1].
IV.EXPERIMENTAL RESULTS
This section gives information about the speaker identification accuracy and confusion matrix of 8 speakers using various methods such as speaker identification for feature selection, speaker identification using leave one sentence out method and speaker identification for meeting data.
1.Speaker Identification for Feature Selection-
Speaker No. Accuracy In %
Speaker 1 80.01
Speaker 2 72.24
Speaker 3 83.81
Speaker 4 89.15
Speaker 5 78.57
Speaker 6 87.03
Speaker 7 86.05
Speaker 8 86.05
Total 82.86
Table 1. Results for various percentages of speakers accuracy when same data is used for training and testing
Actual Speaker
Speaker Read As
S1 S2 S3 S4 S5 S6 S7 S8
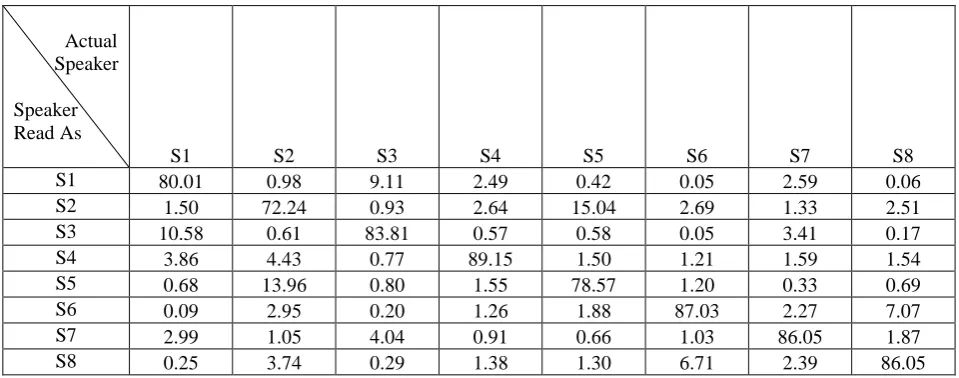
S1 80.01 0.98 9.11 2.49 0.42 0.05 2.59 0.06
S2 1.50 72.24 0.93 2.64 15.04 2.69 1.33 2.51
S3 10.58 0.61 83.81 0.57 0.58 0.05 3.41 0.17
S4 3.86 4.43 0.77 89.15 1.50 1.21 1.59 1.54
S5 0.68 13.96 0.80 1.55 78.57 1.20 0.33 0.69
S6 0.09 2.95 0.20 1.26 1.88 87.03 2.27 7.07
S7 2.99 1.05 4.04 0.91 0.66 1.03 86.05 1.87
S8 0.25 3.74 0.29 1.38 1.30 6.71 2.39 86.05
Table 2. Confusion matrix of all speakers when same data is used for training and testing
2. Speaker Identification Using Leave One Sentence Out Method
Speaker No. Accuracy In %
Speaker 1 78.72
Speaker 2 67.01
Speaker 3 80.81
Speaker 4 87.62
Speaker 5 75.15
Speaker 6 83.16
Speaker 7 81.79
Speaker 8 82.42
Total 79.58
Table 3. Results for various percentages of speakers accuracy using leave one sentence out method
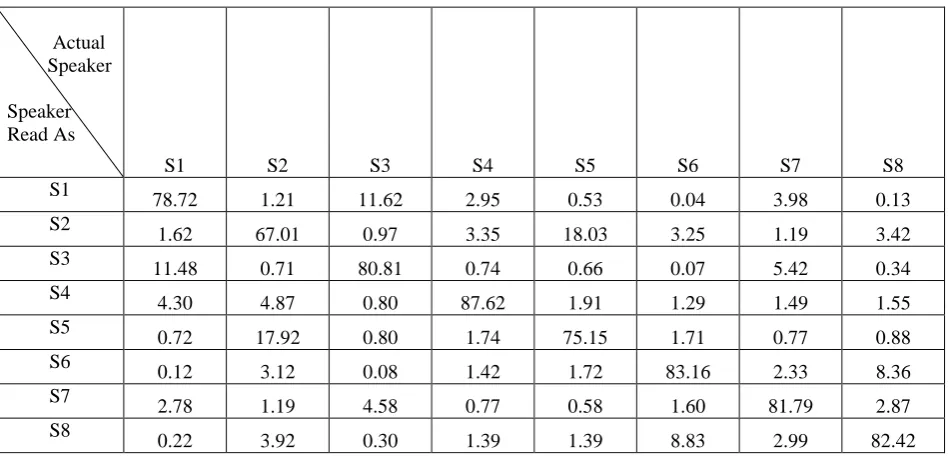
Table 4. Confusion matrix of all speakers using leave one sentence out method
3. Speaker Identification of Meeting Data
In this method we used the 75% data for training and 25% data for testing. While testing we give the meeting database to the GMM model it consists of data of multiple speakers will be mixed to form the data corresponding to meeting discussion. Here table 5 shows the each speaker accuracy in the meeting discussion and table 6 shows the confusion matrix.
Actual Speaker
Speaker Read As
S1 S2 S3 S4 S5 S6 S7 S8
S1
78.72 1.21 11.62 2.95 0.53 0.04 3.98 0.13
S2
1.62 67.01 0.97 3.35 18.03 3.25 1.19 3.42
S3
11.48 0.71 80.81 0.74 0.66 0.07 5.42 0.34
S4 4.30 4.87 0.80 87.62 1.91 1.29 1.49 1.55
S5
0.72 17.92 0.80 1.74 75.15 1.71 0.77 0.88
S6
0.12 3.12 0.08 1.42 1.72 83.16 2.33 8.36
S7
2.78 1.19 4.58 0.77 0.58 1.60 81.79 2.87
S8
Speaker No. Accuracy In %
Speaker 1 80.29
Speaker 2 66.99
Speaker 3 80.77
Speaker 4 85.99
Speaker 5 69.54
Speaker 6 80.75
Speaker 7 77.72
Speaker 8 81.83
Total 77.98
Table 5. Results for various percentages of speakers accuracy for meeting data
Table 6. Confusion matrix of all speakers for meeting data
V. DISCUSSION
This section summarizes the major contributions and conclusion obtained in this research and proposes some improvements and future work.
Actual Speaker
Speaker Read As
S1 S2 S3 S4 S5 S6 S7 S8
S1
80.29 2.69 13.20 5.08 1.89 0.16 7.90 0.24
S2
1.01 66.99 0.68 3.36 23.24 6.21 1.70 5.05
S3
13.26 0.80 80.77 0.86 1.51 0.19 5.79 0.21
S4
2.69 7.00 1.22 85.99 1.30 0.99 1.90 1.96
S5
0.34 15.76 0.26 1.77 69.54 2.75 0.54 1.71
S6
0.10 2.52 0.05 1.06 0.93 80.75 2.24 7.42
S7
2.11 0.70 3.43 0.46 0.50 1.06 77.72 1.52
S8
knowledge about the number of speakers or their identities. Our speaker identification system is based on unsupervised learning method which could be easily adapted to another speech corpus.
The result of this article consists of three main parts. In first, we described speaker identification for feature selection method and in this method we take the decision regarding feature selection for speaker discrimination. In second, we discussed the leave one sentence out method. Using this method we tested the whole data of all speakers. In third, we described speaker identification of meeting data before clustering and check the accuracy for each segment of all speakers.
2. Future work
When we are performing speaker segmentation, each segment shows the speaker identity but there is slight confusion in that case means segment of same speaker shows the different speaker. So, our task is to correct that segment with the help of our ground truth and this process is known as speaker clustering.
Speaker clustering is the process of associating segments of speech produced by the labelling all speech segments belonging to the same speaker with the same relative, show internal speaker label. Clustering aims at identifying and grouping together same-speaker segments which can be localized anywhere in the audio stream.
REFERENCES
[1] X. AngueraMiro, S. Bozonnet, N. Evans, C. Fredouille, G. Friedland, and O. Vinyals, “Speaker diarization: A review of recent research,” Audio, Speech, and Language Processing, IEEE Transactions on, vol. 20, no. 2, 2012.
[2] S. Tranter and D. Reynolds, “An overview of automatic speaker diarization systems,” IEEE TASLP, vol. 14, no. 5, 2006.
[3] P. Gaud, Dr. V. Patil, “Different Approaches for Speaker Diarization” International Journal on Recent and Innovation Trends in Computing and Communication, Vol. 2, Issue.8, August 2014.
[4] X. Anguera, C. Wooters, and J.Pardo, “Robust speaker diarization for meetings: ICSI RT06s evaluation system,” in Proc. ICSLP, Pittsburgh, USA, September 2006.
[5] Asutosh das, ManasRanjan Jena, Kalyan Kumar Barik, “Mel-Frequency Cepstral Coefficient (MFCC) - a Novel Method for Speaker Recognition” Digital Technologies, Vol. 1, August 2014.
[6] C. Wooters and M. Huijbregts, “The ICSI RT07s speaker diarization system,” in Proceedings of Workshop on Classification of Events, Activities, and Relationships and the Rich Transcription Meeting Recognition, 2008.
[7] Xavier AngueraMiro, “Robust Speaker Diarization for meetings” Speech Processing GroupDepartment of Signal Theory and Communications UniversitatPolit`ecnica de CatalunyaBarcelona, 2006.