ISSN(Online) : 2319-8753 ISSN (Print) : 2347-6710
I
nternational
J
ournal of
I
nnovative
R
esearch in
S
cience,
E
ngineering and
T
echnology
(An ISO 3297: 2007 Certified Organization)
Vol. 4, Issue 7, July 2015
Performance Analysis of Data Processing
Tasks in Mobile Phone Sensing System Using
Cloud
G.Ramanjineyulu1, Dr D.Kavitha2
PG Scholar, Dept. of CSE, G Pulla Reddy Engineering College, Kurnool, Andhra Pradesh, India1
Professor, Dept. of CSE, G Pulla Reddy Engineering College, Kurnool, Andhra Pradesh, India2
ABSTRACT: Mobile phone sensing is an emerging area of interest for researchers as smart phones are becoming the core communication device in people's everyday lives. Sensor enables mobile phones or smart phones are attractive sensing application in different domains such as environment monitoring, industrial automation, healthcare, etc Taking advantage of data gathering of mobile phone sensing system (MPSS) as well as the data storage and processing ability of cloud computing (CC) to integrate MPSS-CC. This paper focuses on the processing of the sensory data in MPSS-CC integration architecture and transmitting desirable sensory data to the mobile users in a fast, reliable and secure manner. In this paper, we perform the data processing tasks on the sensory data for reducing the traffic load and bandwidth requirements of sensory data transmission. In addition, the architecture of MPSS-CC is capable of monitoring and predicting the sensory data traffic and also enabling mobile user to securely obtain their desired sensory data faster.
KEYWORDS
: Data processing, integration, cloud computing (CC), mobile phone sensing system (MPS).
I.INTRODUCTION
A. Mobile Phone Sensing
Today’s mobile phone not only serves as the key computing and communication mobile device of choice but also comes with a set of embedded sensors. Sensors have become much more prevalent in mobile devices over the last few years by incorporating more and more sensor into phones. Mobile phone as a sensor serves to collect, process and distribute data around people. Collectively, these sensors are enabling new applications across a wide variety of domains such homecare, healthcare[1], social networks[2], safety, environmental monitoring[3], ecommerce and transportation[4].
ISSN(Online) : 2319-8753 ISSN (Print) : 2347-6710
I
nternational
J
ournal of
I
nnovative
R
esearch in
S
cience,
E
ngineering and
T
echnology
(An ISO 3297: 2007 Certified Organization)
Vol. 4, Issue 7, July 2015
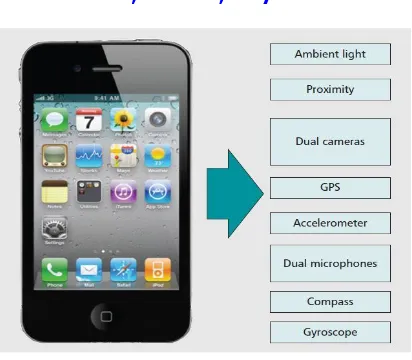
Fig 1.Suite of sensor in mobile phone
The sensors in mobile phones have some advantages. First, the availability of cheap embedded sensors initially included in phones to drive the user experience is changing the landscape of possible applications. Second, smart phones are open and programmable. In addition to sensing, phones come with computing and communication resources that offer a low barrier of entry for third-party programmers. Third, importantly, each phone vendor now offers an app store allowing developers to deliver new applications to large populations of users across the globe, which is transforming the deployment of new applications. Fourth, the mobile computing cloud enables developers to offload mobile services to back-end servers, providing unprecedented scale and additional resources for computing on collections of large-scale sensor data and supporting advanced features such as persuasive user feedback based on the analysis of big sensor data.
B. Cloud Computing
Cloud Computing is internet based computing, where resources allocations are shared, software and information are provided to computer and all other devices on demand as requested. It is considered as an alternative to traditional server or web hosting servers. Cloud provides much more services then that, having different layer to provide application based services [5].
ISSN(Online) : 2319-8753 ISSN (Print) : 2347-6710
I
nternational
J
ournal of
I
nnovative
R
esearch in
S
cience,
E
ngineering and
T
echnology
(An ISO 3297: 2007 Certified Organization)
Vol. 4, Issue 7, July 2015
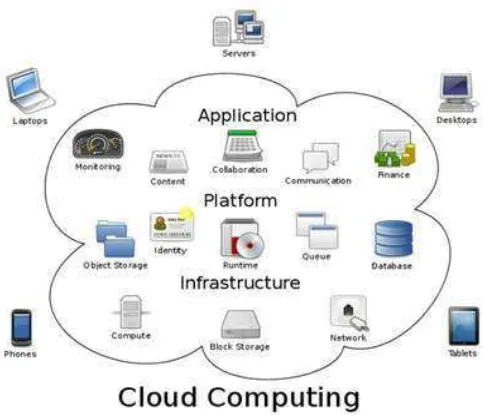
Fig 2.Overview of cloud computing
The fig.2 shows the overview of cloud computing. The cloud computing have three architecture layers mainly Software-as-a-Service (SaaS), Platform-asa-Service (PaaS) and Infrastructure-as-a-Service (IaaS). SaaS provides board market solutions where the vendor provides access to hardware and software products through portal interface [8]. PaaS supplies all the resources required to build an applications [9] and services completely from the internet without having to download or install the software. Paas include application design development, testing and deployment and hosting. IaaS provides consumers with an opportunity to consume processing, storage, network, and other fundamental computing resources [10]. Here the consumer is able to store data, deploy and run arbitrary software such as operating systems and applications. The consumer does not need to control and manage the underlying infrastructure but has control over the operating system, applications, storage, and network components.
C. Integration of MPSS-CC
Taking advantage of data gathering of mobile phone sensing system(MPSS) as well as the data storage and processing ability of cloud computing(CC),the integration of mobile phones and cloud computing has attracted much attention from both academia and industry [11]–[15]. The main idea is to utilize the powerful CC platform to store and process the sensory data (e.g., humidity, temperature, and light) and then further offer these processed sensory data to the mobile users. For example, mobile phones are deployed to collect the weather humidity, temperature, traffic, and house information within a certain area. The collected information can be transmitted to the cloud for storage and processing first. Then, the cloud is able to further transmit the processed sensory data to the mobile users on demand. Mobile users can have access to the sensory information with just a simple client in the mobile device.
D. Research Motivations
When integrating MPSs and CC, the following critical issues or needs should be taken into consideration.
1) Mobile phone used radio resource for communications. With the anticipated dramatic increase in the numbers
ISSN(Online) : 2319-8753 ISSN (Print) : 2347-6710
I
nternational
J
ournal of
I
nnovative
R
esearch in
S
cience,
E
ngineering and
T
echnology
(An ISO 3297: 2007 Certified Organization)
Vol. 4, Issue 7, July 2015
2) Mobile sensors collect data either continuously or at the command of the applications or users. In the latter case, there will be a delay for the applications or users to eventually obtain the desired data. It would be desirable to harness the processing capacity of the cloud to empower the WSN with the ability to anticipate the data needs of the applications/users.
3) Sensory data from a source node are usually forwarded to the gateway via intermediary sensor nodes in a
hop-by-hop manner. Intermediary nodes close to the gateway therefore tend to have a heavy workload. Since sensor nodes are often equipped with batteries that are not rechargeable and they may not be accessible for battery replacement, energy conservation is always an important concern to extend the lifetime of a WSN.
II. RELATED WORK
W.Wang and K.Lee [16] presents dynamic proxy-based approach to connect sensors to the cloud. At the sensor tier, the aggregated sensory data at a sink are sent to the local proxy via a local communication mechanism. At the gateway tier, the local proxy parses the received messages and generates dynamic components over the event bus for each new sensor detected. The gathered sensory data are modeled and then further relayed to the cloud. Khandakar [17] presents framework for integrating wireless sensor network with cloud. This framework includes the data processing unit (DPU), Pub/Sub Broker, the request subscriber, the identity and access management unit, and the data repository (DR). Sensory data collected from the WSN are transmitted via a gateway to the DPU, which processes the data into a storage format and sends the data to the DR. Rajesh et. al. [18] presents Secured Wireless Sensor Network-integrated Cloud Computing architecture. The real-time sensor data must be processed and the action must be taken regularly. The integration controller module of the proposed architecture integrates the sensor network and Internet using Cloud Technology which offers the benefit of reliability, availability and extensibility.
Wen-Yaw Chung et. al. [19] discuss about the agricultural system which use the wireless sensors to monitor temperature, humidity, pH value etc. The purpose is to provide a faster and more convenient platform for the client to obtain information from the sensor nodes that has been set-up in an agricultural system. At the host end, Wireless Sensor Nodes will collect the values of various parameters from the front-end sensors host. At the client sides, internet is used to send request for Web Services that will store this big data into distributed SQL databases which are already in proposed cloud system. Rajeev Piyareet. al. [20] discusses the Wireless Sensor Network applications in important areas such as healthcare, critical infrastructure monitoring, environment monitoring, and manufacturing. Due to some of the limitations of WSNs in terms of memory, energy, computation, communication, and scalability, efficient management of the large number of WSNs data in these areas is an important issue. Cloud computing provides huge computing, storage, and software services in a scalable and virtualized manner at low cost. This paper proposes architecture for integrating Wireless Sensor Networks with the Cloud.
III. MPSS-CC INTEGRATION ARCHITECTURE
A. Architecture overview
ISSN(Online) : 2319-8753 ISSN (Print) : 2347-6710
I
nternational
J
ournal of
I
nnovative
R
esearch in
S
cience,
E
ngineering and
T
echnology
(An ISO 3297: 2007 Certified Organization)
Vol. 4, Issue 7, July 2015
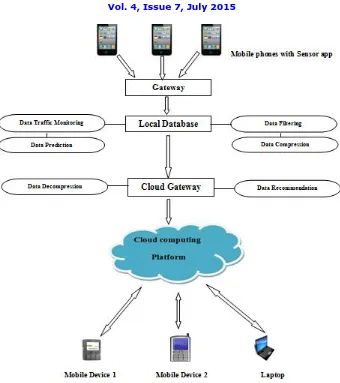
Fig 3.Proposed architecture to integrate mobile phone sensing system and Cloud computing
After the sensory data stored in local database, the database processes the data with the following four components: data traffic monitoring unit, data filtering unit, data prediction unit and data compression unit. This respective unit monitors the data traffic, filters the data traffic, and predicts the future sensory data and also sensory data are compressed. After processed the data processing tasks on sensory data, the data are further transmitted to the cloud gateway. When the cloud gateway receives the compressed sensory data from the local database, the cloud gateway processes the received data by decompressing the data with the data decompression unit.
After performing data decompression, the cloud gateway are stored and processed in the cloud and data are
suitable for presentation to requesting mobile users. So that the cloud utilizes the data recommendation unit to analyze the data feature information required by mobile users. When the user want sensory data, it send request to cloud platform. The cloud platform processes user request and result back to user.
B. Description of Data Processing Tasks
ISSN(Online) : 2319-8753 ISSN (Print) : 2347-6710
I
nternational
J
ournal of
I
nnovative
R
esearch in
S
cience,
E
ngineering and
T
echnology
(An ISO 3297: 2007 Certified Organization)
Vol. 4, Issue 7, July 2015
number of time taken and total number of records. After calculates data traffic, it will checks whether there is too much or very few data collected by the sensors. If it is equal then only further processes sensory data.
2) Data Filtering: The data filtering unit checks whether the gathered sensory data values fall within the acceptable range. For example, the light values in room cannot exceed 100 lux. If the data value is out of range, these faulty sensory data will be discarded. Only acceptable sensory data will be further processed.
3) Data Prediction: To predict the sensory value collected from mobile sensor, the method of the secondary exponential smoothing model (SEMS) [21]-[23] is used to a trend prediction. The SESM is a widely used technique that can be applied to time-series data, either to produce smoothed data for presentation or to make forecasts [24]-[26].
The prediction process of the SESM is as follows.
Suppose that there are n time sequences and the primary data Y = y1, y2, . . . , yn are the data in the original time sequence.
Let ( ) and ( ) be the first and second smoothing values at time t. ( ) and ( ) represent the first and second smoothing values at time t – 1.
Then, ( ) and ( ) are expressed as follows, in which α is the smoothing parameter:
( )= + (1− ) ( )
( )= ( )+ (1− ) ( ) ( )= ( )=
t=2,3,….n (1)
Calculate Prediction value
= + (2)
Here, Ft+m is the prediction value at time t + m, where m is the prediction step and m = {0, 1, 2, . . .,M}. The variables at and bt are given as follows:
= 2 ( )− ( )
= ( )− ( ) (3) Finally ,the prediction error is calculated as
=∑ ( − ) (4)
Here, is the actual data value at time n + m, and is the predicted data value
at time n + m.
4) Data Compression and Decompression: Compression and decompression are performed at the respective local database to reduce packet losses due to network congestion, which would be recovered using a suitable transport protocol between the gateways. However, important sensory data could still be lost if the decompressed data do not perfectly match the data that are compressed, i.e., the compression/decompression process is lossy. To avoid this problem, we utilize lossless compression/decompression techniques. LZ77 compression algorithm is a widely used entropy encoding algorithm for lossless data compression in computer science and information theory
ISSN(Online) : 2319-8753 ISSN (Print) : 2347-6710
I
nternational
J
ournal of
I
nnovative
R
esearch in
S
cience,
E
ngineering and
T
echnology
(An ISO 3297: 2007 Certified Organization)
Vol. 4, Issue 7, July 2015
The encoding process of LZ77 consists of the following steps. 1) The dictionary is initialized to a known value.
2) Read an uncoded string whose length is the maximum allowable match length.
3) The longest matching string is searched in the dictionary.
4) If a match is found with not less than the minimum allowable match length, then the encoded flag, the offset,
and the length are written to the encoded output. Otherwise, the uncoded flag and the first uncoded symbol are written to the encoded output.
5) A copy of the symbols written to the encoded output is shifted from the uncoded string to the dictionary.
6) Read a number of symbols from the uncoded input whose length is equal to the number of symbols written in
Step 4.
7) Repeat from Step 3 until all the uncoded inputs have been encoded.
To perform the decoding of LZ77, the following steps are performed. 1) The dictionary is initialized to a known value.
2) Read the encoded or not encoded flag.
3) If the flag indicates an encoded string, then read the encoded length and the offset and copy the specified symbols from the dictionary to the decoded output. Otherwise, the next character is read and written to the decoded output.
4) A copy of the symbols written to the decoded output is shifted into the dictionary.
5) Repeat from Step 2 until the whole inputs have been decoded.
6) Data Recommendation: Finding all frequent itemsets in a database is difficult since it involves searching all possible itemsets (item combinations). The set of possible itemsets is the power set over I and has size 2 - 1 (excluding the empty set which is not a valid itemset). Although the size of the power set grows exponentially in the number of items n in I, efficient search is possible using the downward-closure property of support which guarantees that for a frequent itemset, all its subsets are also frequent and thus for an infrequent itemset, all its supersets must also be infrequent. Exploiting this property, efficient algorithms (e.g., Apriori algorithm) can find all frequent itemsets.
The Apriori algorithm [32] is a classical algorithm for frequent itemset mining and association rule learning [33]. Apriori is a level-wise complete search algorithm utilizing the antimonotonicity of itemsets. The Apriori property is that any superset of an itemset will not be frequent if an itemset itself is not frequent. Based on this property, the main idea of Apriori is shown with the following three steps first, which are followed with detailed illustrations.
1) The database is scanned and searched for frequent itemsets of size 1 by accumulating the count for each item.
Those itemsets that satisfy the minimum_support requirement are collected.
2) Iterating with the following three steps to find frequent itemsets with cardinality from 1 to k (k-itemset).
From the frequent itemsets of size k, Ck+1 that contains the candidates of frequent itemsets of size k
+ 1 is generated.
The database is scanned, and the support of each candidate of frequent itemsets is calculated.
Those candidate itemsets satisfying the minimum_support requirement are added to Fk+1.
3) The frequent itemsets are utilized to generate association rules if necessary with support_count() and
min_confidence.
The pseudo code of the Apriori algorithm for frequent itemset mining is previously shown, with Ck denoting
ISSN(Online) : 2319-8753 ISSN (Print) : 2347-6710
I
nternational
J
ournal of
I
nnovative
R
esearch in
S
cience,
E
ngineering and
T
echnology
(An ISO 3297: 2007 Certified Organization)
Vol. 4, Issue 7, July 2015
All the candidates of the frequent itemsets included in transaction t are found with the function subset in line 5.
With that, the frequencies of the candidates generated in this way are calculated by scanning the database, and the frequencies are checked to see whether they exceed the minimum_support. After the set of frequent itemsets F is achieved, the association rules are generated based on the frequent itemsets with the following procedure.
For each frequent itemset I in F, all nonempty subsets of I are obtained.
For every nonempty subset s of I, the rule s → (I − s) is selected if the following equation holds:
_ ( )
_ ( )≥min _
where support_count(X) of an itemset X is the proportion of transactions containing the itemset in the database, and min_confidence is a minimum confidence threshold value.
C. Architecture Characteristics
1) Monitor the Sensory Data Traffic: By using the data traffic unit in local data base, the sensory data traffic is monitored. If the sensory data traffic is too high or too low, then it is quite likely that there is something wrong with some sensors. So easily find out some sensors have died or are faulty, or maybe some sensors are compromised.
2) Reduce the Sensory Data Transmission Bandwidth Requirement and Traffic: The sensory data are filtered and compressed before transmitting to the cloud, the traffic load and transmission bandwidth requirements for sensory data are reduced.
3) Predict the Future Trend of the Sensory Data: By using the secondary exponential smoothing model in the data prediction unit, we can predict the future trend of the sensory data. This can alert people to take measures in advance to prevent the occurrence of dangerous events, which are indicated by the sensory data trend. For example, if the toxic substances in the water detected by some sensors tend to exceed the acceptable level, then maybe the government should take some actions to avoid the danger that excessive toxic substances might kill a lot of people.
ISSN(Online) : 2319-8753 ISSN (Print) : 2347-6710
I
nternational
J
ournal of
I
nnovative
R
esearch in
S
cience,
E
ngineering and
T
echnology
(An ISO 3297: 2007 Certified Organization)
Vol. 4, Issue 7, July 2015
IV.EVALUATIONS
A. Evaluation Setup
To perform the evaluation, we implemented a simplified prototype of the architecture to process the sensory data. Here, the two mobile phones with sensor android application used to collect three types of sensory data (i.e. Light, sound, proximity) in the classroom. Specifically, the sound is in dB. Light is in lux, and proximity is expressed in cm. The gathered sensory data is further processed with the cloud platform of the blackbucks Technology to offer these processed sensory data to a mobile user requesting these sensory data. The cloud platform utilizes four virtual CPU cores (2.6 GHz) and a 64-GB memory.
The evaluated performance are data traffic monitoring performance, data filtering performance, data prediction performance, data compression performance, and data recommendation performance.
B. Evaluation Results
1) Data Traffic Monitoring Performance: Table I shows the data traffic monitoring performance in mobile sensor 1 and 2. We monitor the data traffic for a specific time interval (i.e., every minute) regarding all types of sensory data (i.e., sound, light, and proximity). From this table, we can observe that the data traffic is normal. There are 120 data records every minute in mobile sensor 1 and 60 data records every minute in mobile sensor 2.
TABLE I TABLE II
DATA TRAFFIC MONITORING PERFORMANCE DATA FILTERING PERFORMANCE Mobile Sensor Attribute Data Traffic
Mobile Sensor 1 Sound 120 records/minute Mobile Sensor 1 Light 120 records/minute Mobile Sensor 1 Proximity 120 records/minute
Mobile Sensor 2 Sound 60 records/minute
Mobile Sensor 2 Light 60 records/minute
Mobile Sensor 2 Proximity 60 records/minute
2) Data Filtering Performance: For data filtering, we remove the collected data that own too high or too low data value, which is obviously not acceptable. The data filtering performance in both mobile sensor 1 and 2 are shown in Table II. In mobile sensor 1, there are total of 3354 records before data filtering, and there are total of 1755 records after the data filtering. Eighty-four records are filtered. In mobile sensor 2, before data filtering, there are total of 5645 records. After the data filtering, there are total of 3592 records. Forty-three records are filtered.
TABLE III TABLE IV
DATA PREDICTION PERFORMANCE DATA COMPRESSION PERFORMANCE
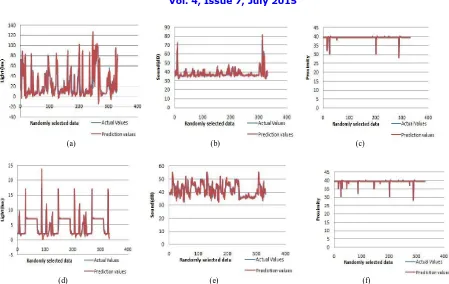
3) Data Prediction Performance: Table III summarizes the data prediction error with the SESM data prediction technique in mobile sensor 1 and 2 utilizing 3000 group data. Moreover, Fig. 4(a)-(c), respectively, show the data prediction sample, with respect to sound, light, and proximity, in mobile sensor 1. The data prediction sample, with respect to sound, light, and proximity, in mobile sensor 2 are presented in Fig. 4(d)–(f), respectively. In Table III and Fig. 4, we can observe that the predicted data value is almost the same as the actual data value.
Mobile Sensor 1 Before Data Filtering 3354 records Mobile Sensor 1 After Data Filtering 1755 records Mobile Sensor 2 Before Data Filtering 5645 records Mobile Sensor 2 After Data Filtering 3592 records
Mobile Sensor 1 Before Data Compression 76390 bytes Mobile Sensor 1 After Data Compression 19075 bytes Mobile Sensor 2 Before Data Compression 13085 bytes Mobile Sensor 2 After Data Compression 2675 bytes Mobile Sensor Attribute Prediction Error
Mobile Sensor 1 Sound -6.01225
Mobile Sensor 1 Light 0.82156
Mobile Sensor 1 Proximity 2.01265
Mobile Sensor 2 Sound 0.00125
Mobile Sensor 2 Light -1.23564
ISSN(Online) : 2319-8753 ISSN (Print) : 2347-6710
I
nternational
J
ournal of
I
nnovative
R
esearch in
S
cience,
E
ngineering and
T
echnology
(An ISO 3297: 2007 Certified Organization)
Vol. 4, Issue 7, July 2015
(a) (b) (c)
(d) (e) (f)
Fig. 4. Data prediction performance sample in mobile sensor 1, with regard to (a) Light (b) Sound and (c) Proximity and in mobile sensor 2, with regard to (d) Light, (e) Sound, (f) Proximity.
4) Data Compression Performance: Regarding data compression, we utilize the deflate data compression method illustrated previously. The data compression performance is shown in Table IV. In mobile sensor 1, the size of all the data is 76390 bytes before data compression and 19075 bytes after data compression. About 75% data are compressed. In mobile sensor 2, before data compression, the size of all the data is 13085 bytes. After data compression, the size of all the data is reduced to 2675 bytes. Around 70% data are compressed.
5) Data Recommendation Performance: Tables V and VI show the data recommendation performance with Apriori, with respect to confidence, before and after attribute combination in both mobile sensors 1 and 2. Here, we randomly select 1000 group sensory data records and preset the attributes (sound, light, and proximity) that the mobile user will utilize. Then the support confidence for each attribute is determined, and the corresponding confidence of the combination of two attributes is obtained. From this table, we can know that the architecture can accomplish the following goal. When the mobile user chooses one type of data (e.g., sound), by setting a confidence threshold, we can get some data combinations (e.g., light, and proximity), whose confidence is larger than the threshold. Then, these data are the recommended data that indicate a stronger relationship than other data patterns.
TABLE IV TABLE V
DATA COMPRESSION PERFORMANCE DATA RECOMMENDATION PERFORMANCE BEFORE ATTRIBUTE COMBINATION
Mobile Sensor Attribute Confidence
Mobile Sensor 1 Sound 0.61
Mobile Sensor 1 Light 0.58
Mobile Sensor 1 Proximity 0.49
Mobile Sensor 2 Sound 0.60
Mobile Sensor 2 Light 0.55
Mobile Sensor 2 Proximity 0.50
Mobile Sensor Attribute Confidence
Mobile Sensor 1 Sound & Light 0.59
Mobile Sensor 1 Sound & Proximity 0.56 Mobile Sensor 1 Light & Proximity 0.45
Mobile Sensor 2 Sound & Light 0.68
ISSN(Online) : 2319-8753 ISSN (Print) : 2347-6710
I
nternational
J
ournal of
I
nnovative
R
esearch in
S
cience,
E
ngineering and
T
echnology
(An ISO 3297: 2007 Certified Organization)
Vol. 4, Issue 7, July 2015
V. CONCLUSION
Integration of mobile phone sensing system and Cloud Computing will provide benefits to organizations and the research community. In this paper, we have proposed architecture to integration of MPSS-CC for the sensory data processing and it enables the transmissions of desirable sensory data to mobile users in a fast, reliable, and secure manner. The architecture could decrease the storage requirements of the sensors and the sensor gateway, and reduce the traffic load and bandwidth requirement of sensory data transmissions. We have provided analytical and experimental results to show that the architecture is capable of enhancing the monitoring performance of sensors, and the security of the transmitted sensory data and of reducing the traffic and bandwidth required for sensory data transmissions and the cloud storage and processing overhead. The advanced capabilities and high performance of the architecture enable the mobile users to obtain their desired sensory data faster.
REFERENCES
[1] S. Consolvo et al., “Activity Sensing in the Wild: A Field Trial of Ubifit Garden,” Proc. 26th Annual ACM SIGCHI Conf. Human Factors Comp. Sys., 2008, pp. 1797–1806.
[2] E. Miluzzo et al., “Sensing meets Mobile Social Networks:The Design, Implementation, and Evaluation ofthe CenceMe Application,” Proc. 6th ACM SenSys,2008, pp. 337–50.
[3] M. Mun et al., “Peir, the Personal Environmental Impact Report, as a Platform for Participatory Sensing Systems Research,” Proc. 7th ACM MobiSys, 2009, pp. 55–68.
[4] A. Thiagarajan et al., “VTrack: Accurate, Energy-Aware Traffic Delay Estimation Using Mobile Phones,” Proc. 7th ACM SenSys, Berkeley, CA, Nov. 2009.
[5] Secured WSN-integrated Cloud Computing for u-Life Care IEEE Communications Society subject matter experts for publication in the IEEE CCNC 2010 proceedings.
[6]F. Schepers. (2010) Security in Cloud Computing, IBM Tivoli Internet Security Systems. [Online]. Available: http://www.cpdpconferences.org/Resources/Schepers.pdf. Last accessed:
10/11/2010.
[7] P. McDaniel, and S. W. Smith, “Outlook: Cloud Computing with a Chance of Security Challenges and Improvements,” IEEE Computer and Reliability Socities 2010, pp. 77-80, Jan. 2010
[8] P. Barham, B. Dragovic, K. Fraser, S. Hand, T. Harris, A. Ho, R.Neugebauer, I. Pratt, A. Warfield, “Xen and the Art of Virtualization,”in Proc. of 19th ACM symposium on Operating Systems Principles,Bolton Landing, NY, USA, October 2003, pp. 164-177.
[9] (2010) Google App Engine. [Online]. Available:http://code.google.com/appengine/. Last Accessed: 15/07/2011
[10] A. Dubey, and D. Wagle. (2007) Delivering software as a service – The McKinsey Quarterly.[Online].Available: http://www.mckinsey.de/downloads/publikation/mck_on_bt/2007/mobt_12_Delivering_Software_as_a_Service.pdf Last Accessed: 15/08/2011. [11] M. Yuriyama and T. Kushida, “Sensor-cloud infrastructure—Physical sensor management with virtualized sensors on cloud computing,” in
Proc.13th Int. Conf. Netw.-Based Inf. Syst., 2010, pp. 1–8.
[12] G. Fortino, M. Pathan, and G. D. Fatta, “Bodycloud: Integration of cloud computing and body sensor networks,” in Proc. IEEE 4th Int. Conf. Cloud Comput. Technol. Sci., 2012, pp. 851–856.
[13] Y. Takabe, K. Matsumoto, M. Yamagiwa, and M. Uehara, “Proposed sensor network for living environments using cloud computing,” in
Proc.15th Int. Conf. Netw.-Based Inf. Syst., 2012, pp. 838–843.
[14] C. Zhu, V. C. M. Leung, L. T. Yang, X. Hu, and L. Shu, “Collaborative location-based sleep scheduling to integrate wireless sensor networks with mobile cloud computing,” in Proc. IEEE Globecom Workshop Cloud Comput. Syst., Netw., Appl., 2013, pp. 451–456.
[15] A. Alamri, W. S. Ansari, M. M. Hassan, M. S. Hossain, A. Alelaiwi, andM. A. Hossain, “A survey on sensor-cloud: Architecture, applications, and approaches,” Int. J. Distrib. Sensor Netw., vol. 2013, pp. 917923-1–917923-18, 2013.
[16] W. Wang, K. Lee, and D. Murray, “Integrating sensors with the cloud using dynamic proxies,” in Proc. IEEE 23rd Int. Symp. Pers. Indoor Mobile Radio Commun., 2012, pp. 1466–1471.
[17] Khandakar EntenamUnayes Ahmed, Mark A Gregory, “Integrating Wireless Sensor Networks with CloudComputing”, 7th International Conference on Mobile Ad-hoc and Sensor Networks (MSN), Beijing, 16-18 Dec 2011, pp 364-366, Print ISBN: 978-1-4577-2178-6, DOI: 10.1109/MSN.2011.86.
[18] V.Rajesh, J.M.Gnanasekar, R.S.Ponmagal, P.Anbalagan, “Integration of Wireless Sensor Network with Cloud”,International Conference on Recent Trends in Information, Telecommunication and Computing, Kochi, Kerala,12-13 Mar 2010, pp 321-323, Print ISBN: 978-1-4244-5956-8, DOI: 10.1109/ITC.2010.88
[19] Wen-Yaw Chung, Pei-Shan Yu, Chao-Jen Huang, “Cloud Computing System Based on Wireless Sensor Network”,Federated Conference on Computer Science and Information Systems, 8-11 Sept 2013, pp 877-880, INSPECAccession Number: 13884725.
[20] Rajeev Piyare, Sun Park, Se YeongMaeng, Seung Chan Oh, Sang Gil Choi, Ho Su Choi, Seong Ro Lee,“Integrating Wireless Sensor Network into Cloud Services for Real-time Data Collection, International conference on ICT Convergence [ICTC], 14-16 Oct 2013, Jeju, pp752-756, DOI : 10.1109/ICTC.2013.6675470.
[21] R. G. Brown, Exponential Smoothing for Predicting Demand.Cambridge, MA, USA: Arthur D. Little Inc., 1956.
ISSN(Online) : 2319-8753 ISSN (Print) : 2347-6710
I
nternational
J
ournal of
I
nnovative
R
esearch in
S
cience,
E
ngineering and
T
echnology
(An ISO 3297: 2007 Certified Organization)
Vol. 4, Issue 7, July 2015
[23] S. K. Prajakta, “Time series forecasting using Holt-Winters exponential smoothing,” Kanwal Rekhi School Inf. Technol., Mumbai, India, Tech. Rep., 2004, pp. 1-3.
[24] R. J. Hyndman, A. B. Koehler, R. D. Snyder, and S. Grose, “A state space framework for automatic forecasting using exponential smoothing methods,” Int. J. Forecast., vol. 18, no. 3, pp. 439–454, Jul.-Sep. 2002.
[25] J. W. Taylor, “Exponential smoothing with a damped multiplicative trend,” Int. J. Forecast., vol. 19, no. 4, pp. 715–725, 2003.
[26] F. Hao and Z. Pei, “A method of determining the secondary exponential smoothing parameter based on OWA,” in Proc. Int. Symp. Commun. Inf. Technol., 2006, pp. 459–462.
[27] J. Ziv and A. Lempel, “A universal algorithm for sequential data compression,”IEEE Trans. Inf. Theory, vol. 23, no. 3, pp. 337–343, May 1977. [28] J. P. McGregor and R. B. Lee, “Performance impact of data compression on virtual private network transactions,” in Proc. 25th Annu. IEEE Conf. Local Comput. Netw., 2000, pp. 500–510.
[29] R. Karri and P. Mishra, “Minimizing energy consumption of secure wireless session with QoS constraints,” in Proc. IEEE Int. Conf. Commun., 2002, pp. 2053–2057.
[30] G. Moritz, D. Timmermann, R. Stoll, and F. Golatowski, “Encoding and compression for the devices profile for web services,” in Proc. IEEE 24th Int. Conf. Adv. Inf. Netw. Appl. Workshops, 2010, pp. 514–519.
[31] M. Tahghighi,M.Mousavi, and P. Khadivi, “Hardware implementation of a novel adaptive version of Deflate compression algorithm,” in Proc. 18th Iranian Conf. Electr. Eng., 2010, pp. 566–569.
[32] R. Agrawal and R. Srikant, “Fast algorithms for mining association rules,” in Proc. 20th Int. Conf. Very Large Data Bases, 1994, pp. 487–499. [33] X. Wu, V. Kumar, J. R. Quinlan, J. Ghosh, Q. Yang, H. Motoda, G. J. McLachlan, A. Ng, B. Liu, P. S. Yu, Z.-H. Zhou, M. Steinbach, D. J. Hand, and D. Steinberg, “Top 10 algorithms in data mining,” Knowl. Inf. Syst., vol. 14, no. 1, pp. 1–37, Jan. 2008.
BIOGRAPHY
Mr. G. Ramanjineyulu is a PG Scholar in Computer Science and Engineering at G Pulla Reddy Engineering College, Kurnool. My research areas are Cloud Computing and Wireless Sensor Network.
Dr. D.Kavitha is working as Professor, Computer Science Department at G Pulla Reddy Engineering College, Kurnool. She has ten years of teaching experience. Her research areas are