Copyright 0 1995 by the Genetics Society of America
A LargeScale Gene-Trap Screen for Insertional
Mutations
in
Developmentally Regulated Genes
in
Mice
Wolfgang Wurst
,*
Janet Rossant
,*
Valerie Prideaux
,*
Malgosia Kownacka,* Alexandra Joyner,
*
,tDavid P.
Hill,
* Francois Guillemot,
* Stephan Gasca,
*
9tDragana Cado,*
JAnna Auerbach
* and Siew-Ian Ang
*
94*Samuel Lunenfeld Research Institute, Mount Sinai Hospital, Toronto, Ontario, Canada M5G 1 x 5 and +Department of Mobcular and Medical Genetics, University of Toronto, Toronto, Canada
Manuscript received May 5 , 1994 Accepted for publication October 11, 1994
ABSTRACT
We have used a gene-trap vector and mouse embryonic stem (ES) cells to screen for insertional mutations in genes developmentally regulated at 8.5 days of embryogenesis (dpc)
.
From 38,730 cell lines with vector insertions, 393 clonal integrations had disrupted active transcription units, as assayed by @galactosidase reporter gene expression. From these lines, 290 clones were recovered and injected into blastocysts to assay for reporter gene expression in 8.5dpc chimeric mouse embryos. Of these, 279 clones provided a sufficient number of chimeric embryos for analysis. Thirty-six ( 13% ) showed restricted patterns of reportergene expression, 88 (32%) showed widespread expression and 155 (55%) failedto show detectable levels of expression. Further analysis showed that approximately one-third of the clones that did not express detectable levels of the reporter gene at 8.5 dpc displayed reporter gene activity at 12.5 dpc. Thus, a large proportion of the genes that are expressed in ES cells are either temporally or spatially regulated during embryogenesis. These results indicate that gene-trap mutagen- eses in embryonic stem cells provide an effective approach for isolating mutations in a large number of developmentally regulated genes.
T
HE ability to carry out large scale screens for devel- opmental mutations has proven essential in unrav- elling the genetic programs underlying embryogenesis in such organisms as Drosophila mlanogaster and Caeno-rhabditis elegans. These types of screens in mammals are made difficult by the large genome size and the devel- opment of the embryo inside the mother's uterus. Fur- thermore, the cost and space required to house large numbers of animals and the relatively long breeding period have limited the undertaking of large scale screens.
ES cell technology has permitted investigators with modest-sized animal facilities to enter the field of mam- malian genetics by allowing the bulk of genetic manipu- lation to occur in vitro. To date, the most popular ap- proach using this technology involves targetted mutagenesis of genes via homologous recombination in ES cells (WECCHI 1989; KOLLER and SMITHIE, 1992). This has allowed mutational analysis of the func- tion of molecularly identified genes that are predicted to be developmentally important. Most often, such
Corresponding author; David Hill, Herman B. Wells Center for Pediat- ric Research, Riley Hospital for Children, Room 2663, 702 Barnhill Rd., Indianapolis, IN 46202.
Berkeley, CA 94720-0001.
Present address: 447 Life Science Addition, University of California,
All authors contributed equally to the project.
Genetics 139 889-899 (February, 1995)
genes are identified by homology either to genes that have been shown to be developmentally important in other species or to genes that contain functionally con- served protein domains of interest. Although this method of selecting candidate genes has proven very successful in identifylng and mutating important devel- opmental genes, it does not provide access to genes that have not been characterized at the molecular level.
We and others have described an efficient means of identifymg and mutating novel genes in ES cells by the introduction of vectors into ES cells that drive
0-
galactosidase reportergene expression from endoge- nous cellular promoters (reviewed in GOSSLER and ZACHGO 1993; HILL and WURST 1993a). In this screen, we used the type of vector that serves as an artificial exon after insertion into an endogenous transcription unit ( GOSSLER et al. 1989; FRIEDRICH and SORIANO 1991 ).
When cell lines containing this vectors are used to make chimeric embryos, the localization of P-galac- tosidase activity generated by the fusion protein is very similar to the expression pattern of the endogenous gene found at the site of insertion (SKARNES et al. 1992). Generation of fusion transcripts also makes it possible to directly clone the transcribed region of the disrupted host gene using the rapid amplification ofcDNA ends protocol (RACE, SKARNES et al. 1992).
890 Wurst c! rcl.
PT-1
gene trap En-2 splice acceptor
I
lac2 gene1
pAI
PGK-Pr.I
neoI
PAvector
Electroporate vector
into ES cells Replica plate
Masterplate / ,
Select neo' colonies
and replica plate
J.
Pick expand and freeze lacz-expressing clones
C Blastocyst injection
Stain replica plate to identify
lacz-expressing clones FKXWI 1 .-Schematic rcpresrnt;ltion of
the gene-trap vector and the method sed to
analyze fl-galactosidase expression patterns in 8 . 5 4 ~ ~ ES cell chimeras.
h
Embryo transfer intopseudopregnant foster mother
Assay lac2 expression in 8.5dpc chimeric embryos
embryonic development display specific spatial and temporal regulation during embryogenesis ( ~ . g . , Hox genes, reviewed in KRUMIAUF 1993). Using the ratio- nale that developmentally regulated genes may code for developmentally important molecules, we conducted a large scale screen for insertional mutations into genes that are developmentally regulated during mouse em- bryogenesis. We reasoned that the results of such a screen .would reveal information on the fnndamental domains of gene expression during development, pro- vide lineage markers for future embryological experi- ments and provide a large number of candidate muta- tions affecting the development of tissues marked by reporter gene expression. I n this study, we report on such a screen conducted to identify and mutate genes that are expressed around the time of the establishment of the basic body plan (8.5 dpc) in the mouse embryo. We have characterized the expression patterns of nearly
300 different genes that are expressed in embryonic stem cells. We discuss the implications of this screen in terms of the types of gene expression patterns that exist in the early mouse embryo and the feasability of using gene-trap vectors in more extensive mutagenic studies.
MATERIALS AND METHODS
Gene-Trap Screen in the Mouse 89 1
TABLE 1
S u m m a r y of integrations tested in 8.5dpc embryos
Expression pattern No. of ES cell clones
Spatially restricted expression 36 (13)
Widespread Expression 88 (32)
No expression detected 155 (55)
Total no. of clones examined 279 (100)
Values in parentheses are percentages.
sistant colonies. Before introduction into cells, the vector DNA was linearized by digestion with HindIII. The reaction mixture was heated to 90°C for 15 min and the linearized DNA was ethanol precipitated. DNA was resuspended in phos phate buffered saline at a concentration of 1 mg/ml for elec- troporation.
Electroporation of Es cells and in vitro screening: Electro- poration and screening of ES cells were performed as de- scribed previously (HILL and WURST 1993b; WURST and JOYNER 1993). After 8-10 days of G418 selection, when neo'
colonies were readily apparent, the colonies were replica plated ( GOSSLER et al. 1989; GOSSLER and ZACHGO 1993). Colonies that showed any /?-galactosidase staining, either scat- tered or throughout the colony, were picked, expanded, re- tested for /?-galactosidase activity and frozen away for later analysis in chimeras.
Production and analysis of chimeras: P-galactosidase posi- tive clones were thawed, grown for one week and then in- jected individually into blastocysts obtained from outbred CD1 mice (Charles River Laboratories, Quebec). For 139 out
of 290 clones, 30-40 blastocysts were injected with 12-15 cells each and transferred into the uteri of three recipient females on the third day of pseudopregnancy. Two recipients from each clone were sacrificed at 8.5 dpc, when embryos were at early somite stages (4- 15 somites) . Dissected embryos and their extraembryonic membranes were fixed and stained for &galactosidase activity as previously described ( GOSSLER and ZACHW 1993; HILL and WURST 1993b). The numbers of embryos that expressed /?-galactosidase and the pattern of the staining were recorded, and all embryos displaying developmental regulation of /?-galactosidase expression were photographed. The third recipient was allowed to continue the pregnancy until 12.5 dpc when chimerism could be scored by the presence of eye pigmentation derived from the agouti D3 ES cell line in the albino CDl host embryos (NAGY et al. 1990). Most of the 12.5-dpc embryos were also stained for
p-
galactosidase activity. The remaining 151 clones were used
to generate 20-30 embryos in two recipients, which were sacrificed and analyzed for reporter gene expression on 8.5 dpc. Three chimeras showing identical expression patterns were considered an acceptable minimum because patterns were reproducible from embryo to embryo despite varying degrees of mosaicism ( GOSSLER et al. 1989). In cases where there was doubt concerning the pattern of reporter gene ex- pression, the injections were repeated until three chimeras showing identical patterns were obtained. Information on the majority of clones was derived from more than three chime-
ras, and data based on two chimeras were reported in a few
cases where expression was clearly ubiquitous.
Production of Estetraploid chimeras: A few clones that displayed interesting patterns were subjected to analysis after aggregation with tetraploid host embryos (NAGY et al. 1990;
NAGY and ROSSANT 1993). In such embryos, the ES cells out-
compete the compromised tetraploid host cells during devel- opment, resulting in embryonic tissues that are derived solely from ES cell descendants ( NAGY et al. 1990). The absence of mosaicism allows for more precise confirmation of the @- galactosidase staining pattern.
RESULTS
Isolation of P-galactosidaseexpressing
ES
cell clones: The vector PTl (Figure 1A),
a modified ver- sion of GT4.5 (see MATERIALS AND METHODS) was used to generate P-galactosidaseexpressing ES clones. Clones containing vectorDNA
were isolated by selection for expression of the neomycin resistance (neo') gene, driven by the PGK-1 promoter. These neo' colonies were then replica plated a n d assayed for P-galactosidase ac- tivity (Figure lB, GOSSLER et al. 1989). Colonies that were expressing P-galactosidase usually contained a mixture of undifferentiated and partially differentiatedES cells, a n d P-galactosidase staining was observed in either or both compartments. From 38,730 neo' clones,
393 (
-
1%
) P-galactosidaseexpressing clones were identified, from these 393 clones, we were able to estab- lish 300 cell lines that were expanded and kept as frozen stocks.Detailed examination of subcellular localization of
0-
galactosidase activity was performed in 208 expressing lines and showed that P-galactosidase activity was local- ized in six different ways. In 122 (59% ) of the clones, 0-galactosidase activity was observed throughout the cy- toplasm, and in 46 (22%) of the clones, staining was restricted to distinct dots in the cytoplasm. Staining in both the cytoplasm and dots was seen in nine ( 4 % )clones. Nuclear staining was observed in 26 ( 13%) of the clones and nuclear plus cytoplasmic staining was seen in 4 ( 2 % ) of the clones. One clone showed
P-
galactosidase staining around the edges of the cells.When these 208 clones were examined for P-galacto- sidase expression patterns within the partially differenti- ated colonies, the expression in 13 clones appeared restricted to partially differentiated cells based o n gross cellular morphology. Only two clones showed P-galac- tosidase expression restricted to undifferentiated ES
cells. The remainder of the clones showed P-galactosi- dase expression throughout the colony.
Reporter gene expression in 8 . 5 4 ~ ~ chimeras: ES
clones (290) expressing the reporter gene were in- jected into CDl blastocysts, and chimeric embryos were
assayed for P-galactosidase expression at the 4-15 so- mite stage of embryogenesis. Of the 290 clones injected,
892 Wurst et al.
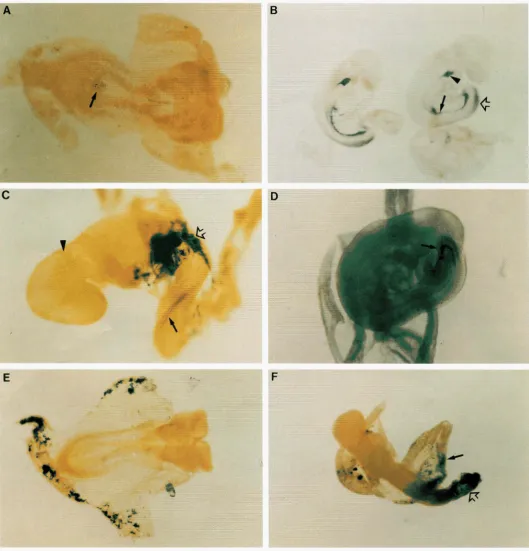
FIGURE 2.-EScell (8.5 dpc) chimeric embryos showing tissue specific expression. Reporter gene expression was detected in the embryo proper (A-D) or extraembryonic tissues ( E and F )
.
(A) An -8-somite-stage chimeric embryo from ES clone PT1-Gene-Trap Screen in the Mouse 893
spread or ubiquitous staining and
155
(55%
) of 'the ' . lines failed to express the reporter construct at detect- able levels (Table 1).After examining the chimeras fi-om the 36 lines that showed spatially restricted patterns of expression in the
8.5
dpc embryos, we classified the expression patterns into four categories: highly restricted tissue-specific pat- terns (Figure2),
highly restricted region-specific pat- terns (Figure3),
highly restricted tissue-specific pat- terns plus widespread low-level expression (Figure4)
,
and highly restricted region-specific patterns plus wide- spread low-level expression (Figure 5 ).
A description of the expression pattern for each clone is provided in Table 2.Seventeen of the 36 clones showed tissue-specific ex- pression (Table
2 A )
.
Nine clones showed tissue-specific expression in the embryo proper; of these linessix
also showed weak expression in the extraembryonic yolk sac. Eight clones showed staining that was predominantly in extraembryonic tissues; two of these lines also showed weak expression in the embryo proper. The tissues that displayed @galactosidase expression varied from clone to clone and included node and putative notochord(PT1-19,
Figure2A),
gut(6-15-2,14-50;
Figure2,
B and D )
,
spinal chord (6-15-2,9-10,12-52; Figure2,
B
andC)
,
a few scattered cells in the head region(9-10,12-27,12-50,14-49),
yolk sac mesoderm(6-
15-1, 13-11, 14-57)
and distinct pockets of cells in the yolk sac mesoderm(PT1-14,6-9-1).
Eleven of the 36 clones showed widespread expres sion with stronger expression in certain tissues. As in the first group, the patterns of expression ranged across a large variety of tissue types, including heart
(PT1-
13,9-7,ll-33,13-17),
somites (7-9-3,9-7,9-9; Fig- ure3),
central nervous system(PT1-13, 9-7, 9-12,
12-2)
and neural tube(7-9-3,9-9).
Widespread low-level reportergene expression with stronger exmession in the central nervous svstem was u I seen in 5 of the 36 clones. Three clones showed bands of differential expression across the hindbrain, indica- tive
of
expression in developing rhombomeres(9-4,
13-11,5-8-1;
Figure 4). One clone showed a specific anterior boundary of expression in the hindbrain (13-
28).
The fifth clone also showed spatially restricted bands of expression in theC N S ,
this time in longitudi- nal stripes along the neural tube (PT1-7).Three of the
36
clones showed spatially restricted expression patterns along the anterior-posterior axis, without any obvious tissue-specificity. Two clones(6-
16-3,8-7-1)
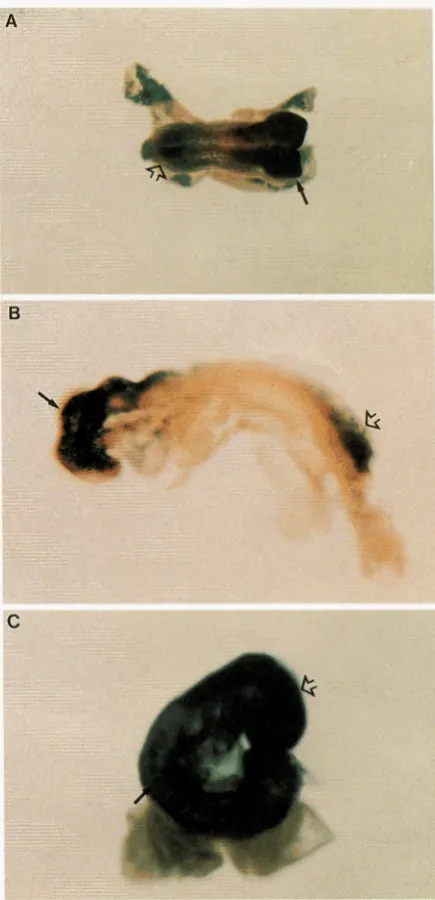
showed strong expression at the anterior and posterior ends of the embryo with a reduction of staining toward the middle of the embryo (Figure 5). The other clone showed a widespread low level of ex- pression, with stronger staining in the anterior neural folds and the somites.FIGURE 3.-EScell (8.5 dpc) chimeric embryos showing reporter gene expression in graded patterns along the ante- rior/posterior
axis.
ES cell chimeric embryos from lines 6-16-3 (A) and 8-7-1 (B) show strong reporter gene expres- sion at the posterior (open arrow) and anterior (arrow) ends. The embryo in ( B ) represents a totally EScellderived em- bryo. (C) An Ekell chimeric embryo from line 9-3 showing stronger staining in the anterior neural (open arrow) folds and in the somites (arrow).
Reporter-gene expression in Estetraploid chime-
ras: To confirm the effectiveness of using chimeric em- bryos to predict patterns of reportergene expression, we generated a small number of aggregation chimeras using tetraploid host embryos. Such chimeras are al- most entirely EScellderived ( NAGY et al.
1990;
NAGY894 Wurst et al.
12-52, generated healthy chimeric embryos. These em- bryos were judged to be almost entirely EScell derived based on the lack of mosaicism in their P-galactosidase staining. These analyses confirmed the patterns of
P-
galactosidase gene expression that had been observed in the previously described diploid chimeras (Figures 2B, 3B and 4C).
In two lines, 6-15-2 and 5-8-1, chimeric embryos also were assayed at stages of development other than 8.5 dpc. At 8.5 dpc, 6-15-2 displayed reporter-gene expression in specific regions of the gut and in the posterior spinal chord. By 9.5 dpc, expression was found in these two areas as well as in a portion of the ventral pharynx. Line 5-8-1 displayed low levels of wide- spread expression coupled with strong staining in the midbrain and hindbrain of 8.5dpc embryos and a lack of expression in two bands in the hindbrain, probably rhombomeres 3 and 5. When this clone was assayed in 7.5-dpc embryos, staining was seen to be restricted to the posterior region of the embryo.
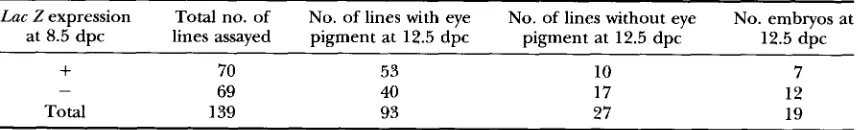
Analysis of 12.5-dpc embryos: A large proportion
( 55% ) of the ,&galactosidase expressing clones failed to show reporter gene activity in 8.5-dpc embryos. To
ensure that this was not because of the absence of ES cell contribution to the embryos, a shbset of the lines were analyzed for their ability to generate chimeras at 12.5 dpc (Table 3 )
.
Because the D3 cell line carries the dominant agouti coat color marker, chimerism can be scored by the presence of eye pigmentation. We analyzed 139 lines for the presence of eye pigmen- tation at 12.5 dpc. From 19 of these lines we could not recover embryos at 12.5 dpc. Of the remaining 120 clones where embryos were recovered, 93 ( 78% )scored positive for eye pigmentation. This indicates that a substantial proportion of those clones showing no expression at 8.5 dpc were able to generate chime- ras but were not displaying detectable reporter gene activity at 8.5 dpc.
Gene-Trap Screen in the Mouse 895
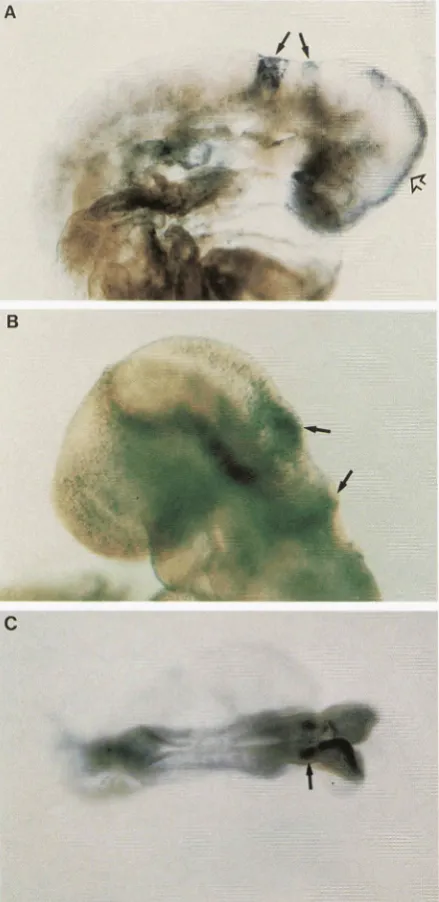
FIGURE 5.-Ekell (8.5 dpc) chimeric embryos showing widespread low expression with stronger reporter gene ex- pression in spatially defined domains. (A) An Eke11 chimeric embryo from line 13 to 31 showing stronger staining in the midline of the mid- and forebrain (open arrow) and strong staining in two bands in the hindbrain (arrow). (B) An ES cell chimeric embryo &om line 9-4 showing stronger staining in two stripes across the hindbrain (arrow). ( C ) A totally E S cell-derived chimeric embryo from ES clone 5-8-1 showing stronger staining in the hindbrain (arrow) and the midbrain.
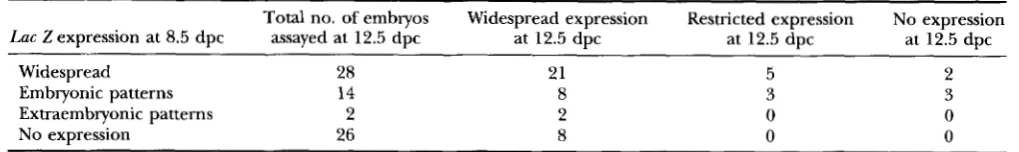
restricted expression patterns. Five lines showed ubiq- uitous expression at 8.5 dpc but restricted expression at 12.5 dpc (Table 4 ) . The restricted expression at 12.5 dpc was predominantly in the CNS (5-42, PT1-
15 and 5-3-1 ) and in the developing limb buds (5- 42, PT1-15 and
12-1).
DISCUSSION
We have generated >300 mouse ES cell clones con- taining potentially mutagenic integrations of a gene- trap vector that uses a @-galactosidase reporter gene to identify endogenous cellular promoters. When 279 of these clones were assayed for reportergene expression in 8.5-day chimeras, a range of developmental patterns was observed. Approximately one third of the clones showed widespread lac2 expression in 8.5-dpc embryos. Thirty-five of the 279 clones exhibited tissue-specific or spatially restricted expression patterns at 8.5 dpc. The remainder of the clones did not express h c Z at this
stage of development, despite expression in ES cells. We have shown that the lack of expression in the latter group of embryos was not due to inability of the ES
cells to contribute to chimeras, because for most of these clones, the presence of ESderived cells could be scored by the presence of eye pigmentation when the embryos were allowed to develop to 12.5 days. In fact, we estimate that only -10% of the ES cell clones that underwent the screening procedure were not able to contribute to chimeric embryos. When a subset of these negative clones were analyzed at midgestation (12.5 dpc)
,
more than one third were found to expresslac2.
Furthermore, 5/ 33 clones that were ubiquitously ex- pressed at 8.5 dpc showed evidence of patterned expres- sion at 12.5 dpc. The results of this gene-trap screen demonstrate that it is possible to identify a wide assort- ment of genes showing tissue-specific and spatially re- stricted expression during development even when the analysis is limited to genes expressed in ES cells and during one developmental stage. Furthermore, our lim- ited analysis at 12.5 dpc indicates that if the time win- dow of expression analysis could be broadened, then a much larger number of genes with restricted expression patterns during development would be identified.
As mentioned earlier, the expression patterns of the
36 clones that showed spatial modulation of the re-
porter gene at 8.5 dpc could be divided into four basic categories: highly restricted tissue-specific patterns
(Figure
2 )
,
highly restricted region-specific patterns (Figure 3 ) , highly restricted tissue-specific patterns plus widespread low-level expression (Figure 4 ) and highly restricted region-specific patterns plus wide-spread low-level expression (Figure 5 )
.
Because this screen was limited to genes that are ex- pressed in ES cells, the question of whether the fre- quency of these classes of gene expression patterns re- flects the frequency of the types of genes that are developmentally regulated in the embryo remains unre- solved. It is clear that some developmentally restricted genes such as En-2 and Hox
1.3
are expressed in undif" ferentiated ES cells, whereas others such as wnt-1 and896 Wurst et al.
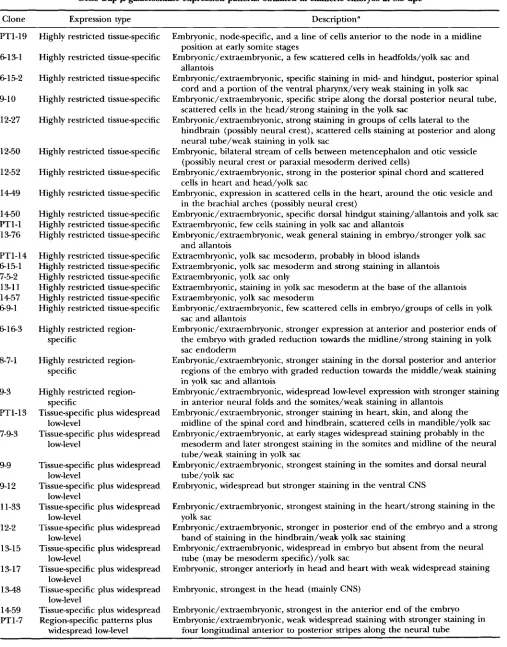
TABLE 2
Gene trap &galactosidase expression patterns obtained in chimeric embryos at 8.5 dpc
Clone Expression type Description"
PT1-19 613-1 615-2 9-1 0 12-27 12-50 12-52 14-49 1450 PTl-1 13-76 PT1-14 615-1 7-5-2 13-11 1457 69-1 6163 8-7-1 9-3 PT1-13 7-9-3 9-9
9-1 2
11-33 12-2 13-15 13-17 13-48 1459 PT1-7
Highly restricted tissue-specific
Highly restricted tissue-specific
Highly restricted tissue-specific
Highly restricted tissue-specific
Highly restricted tissue-specific
Highly restricted tissue-specific
Highly restricted tissue-specific
Highly restricted tissue-specific
Highly restricted tissue-specific Highly restricted tissue-specific Highly restricted tissue-specific
Highly restricted tissue-specific Highly restricted tissue-specific Highly restricted tissue-specific Highly restricted tissue-specific Highly restricted tissue-specific Highly restricted tissue-specific
Highly restricted region- specific
Highly restricted region- specific
Highly restricted region-
Tissue-specific plus widespread
Tissue-specific plus widespread specific
low-level
low-level
Tissue-specific plus widespread
Tissue-specific plus widespread
Tissue-specific plus widespread
Tissue-specific plus widespread
Tissue-specific plus widespread
Tissue-specific plus widespread
Tissue-specific plus widespread
Tissue-specific plus widespread Region-specific patterns plus
low-level low-level low-level low-level low-level low-level low-level widespread low-level
Embryonic, node-specific, and a line of cells anterior to the node in a midline
Embryonic/extraembryonic, a few scattered cells in headfolds/yolk sac and
Embryonic/extraembryonic, specific staining in mid- and hindgut, posterior spinal
Embryonic/extraembryonic, specific stripe along the dorsal posterior neural tube,
Embryonic/extraembryonic, strong staining in groups of cells lateral to the position at early somite stages
allantois
cord and a portion of the ventral pharynx/very weak staining in yolk sac
scattered cells in the head/strong staining in the yolk sac
hindbrain (possibly neural crest), scattered cells staining at posterior and along neural tube/weak staining in yolk sac
(possibly neural crest or paraxial mesoderm derived cells)
cells in heart and head/yolk sac
in the brachial arches (possibly neural crest)
Embryonic, bilateral stream of cells between metencephalon and otic vessicle
Embryonic/extraembryonic, strong in the posterior spinal chord and scattered
Embryonic, expression in scattered cells in the heart, around the otic vesicle and
Embryonic/extraembryonic, specific dorsal hindgut staining/allantois and yolk sac Extraembryonic, few cells staining in yolk sac and allantois
Embryonic/extraembryonic, weak general staining in embryo/stronger yolk sac
Extraembryonic, yolk sac mesoderm, probably in blood islands Extraembryonic, yolk sac mesoderm and strong staining in allantois Extraembryonic, yolk sac only
Extraembryonic, staining in yolk sac mesoderm at the base of the allantois Extraembryonic, yolk sac mesoderm
Embryonic/extraembryonic, few scattered cells in embryo/groups of cells in yolk sac and allantois
Embryonic/extraembryonic, stronger expression at anterior and posterior ends of the embryo with graded reduction towards the midline/strong staining in yolk sac endoderm
Embryonic/extraembryonic, stronger staining in the dorsal posterior and anterior regions of the embryo with graded reduction towards the middle/weak staining in yolk sac and allantois
Embryonic/extraembryonic, widespread low-level expression with stronger staining in anterior neural folds and the somites/weak staining in allantois
Embryonic/extraembryonic, stronger staining in heart, skin, and along the midline of the spinal cord and hindbrain, scattered cells in mandible/yolk sac Embryonic/extraembryonic, at early stages widespread staining probably in the
mesoderm and later strongest staining in the somites and midline of the neural tube/weak staining in yolk sac
tube/yolk sac and allantois
Embryonic/extraembryonic, strongest staining in the somites and dorsal neural
Embryonic, widespread but stronger staining in the ventral CNS
Embryonic/extraembryonic, strongest staining in the heart/strong staining in the
Embryonic/extraembryonic, stronger in posterior end of the embryo and a strong
Embryonic/extraembryonic, widespread in embryo but absent from the neural
Embryonic, stronger anteriorly in head and heart with weak widespread staining
Embryonic, strongest in the head (mainly CNS)
Embryonic/extraembryonic, strongest in the anterior end of the embryo Embryonic/extraembryonic, weak widespread staining with stronger staining in
four longitudinal anterior to posterior stripes along the neural tube yolk sac
band of staining in the hindbrain/weak yolk sac staining
Gene-Trap Screen in the Mouse
TABLE
2Continued
897
Clone Expression type
~~
5-8-1 Region-specific patterns plus widespread low-level
widespread low-level
widespread low-level
9 4 Region-specific patterns plus
13-28 Region-specific patterns plus
13-31 Region-specific patterns plus
widespread low-level
Description"
Embryonic, weak widespread expression with strongest staining in mid- and
Embryonic, widespread early weak staining but later stages show stronger staining
Embryonic/extraembryonic, weak widespread staining including allantois with
hindbrain
in two stripes across the hindbrain
stronger staining in spinal cord and hindbrain with anterior boundary in the hindbrain and a stronger band of expression at this boundary
Embryonic/extraembryonic, broad weak staining with strong specific staining in a
band of cells in the hindbrain (at the level of the otic vesicle) and a weaker band more anteriorly, plus strong staining in the midline of the mid- and forebrain, heart/yolk sac
~~ ~
Clones PT1-19, 615-2, 9-10, 8-7-1, 9-3, 7-9-3, 9-7, 1450, PT1-14, 615-1, 6163, 5-81, 9 4 and 13-31 are shown in Figures 2, 3, 4 or 5. Clones G15-2, 12-52, 5-8-1 and 8-7-1 were tested by aggregation with tetraploid embryos. Clones 13-15, PT1-13 and 13-
~~
31 express the reporter gene only in differentiated cells.
"
1987; MCMAHON and BRADLEY 1990; JEANNOTTE et al. 1991 )
.
A more laborious but less biased screen would involve the analysis of all clones that had incorporated the vector into their genome. A large-scale screen of this type would be very difficult because many integrations would fall outside of transcription units and, due to the nature of the vector, even those that were within genes could only be expressed if integrated in the correct orientation and reading frame.Many of the reporter-gene expression patterns that we observe are consistant with the behavior of ES cells in culture. Spontaneous differentiation of the D3 ES cell line has been shown to give rise to a number of identifiable cell types, including yolk sac-like structures that contain blood islands and primitive blood vessels as well as cardiac muscle cells ( DOETSCHMAN et al.
1985)
.
Of the 36 clones that displayed restricted expres- sion, 24 clones showed expression in the yolk sac (Table2 ) ; in two of the lines expression may be restricted to blood islands ( PTl
-
14 and 6-9-1 ).
Expression in the developing heart was observed in six clones. Because in our prescreen colonies were allowed to partially dif- ferentiate, we may have a bias toward genes that are expressed in tissues that are generated by in uitro differ- entiation. The two clones that were expressed exclu- sively in differentiated cells (13-31 and PT1-13) anddisplayed regulated expression of the reporter gene showed expression in both the yolk sac and the heart.
CNS expression was predominant in 18 out of 36 lines. This result is also not surprising because at 8.5 dpc the CNS is undergoing active organization with respect to dorsal /ventral and anterior/ posterior polar- ity as well as with respect to segmental identity. A large number of genes responsible for these events might be expected to be active in the early embryo and ES cells and thus be identified in our screen.
This study shows that it is feasible to prescreen 300 gene-trap integrations in ES cells by expression in chi- meras. Those with the most interesting developmental expression patterns then can be selected for further analysis at the molecular level and can be transmitted through the germ line for phenotypic analysis of the mutation. This prescreen allows large-scale insertional mutagenesis in mice without access to large animal col- ony resources. In this screen, we have limited analysis to one window of development: 8.5 dpc. This time was chosen as it is the time when the basic body plan of
the embryo is being established. However, other time windows could be added, recognizing that every addi- tional time point analyzed doubles the number of ani- mals used for chimera analysis. In a screen of -300 lines, it has proven possible to generate a diversity of
TABLE 3
Chimeric embryos analyzed at 12.5-dpc
Lac Zexpression Total no. of No. of lines with eye No. of lines without eye No. embryos at
at 8.5 dpc lines assayed pigment at 12.5 dpc pigment at 12.5 dpc 12.5 dpc
+
70 53 10 769 40 17 12
Total 139 93 27 19
898 Wurst et al.
TABLE 4
Lac Z expression in 12.5.dpc embryos
~
Total no. of embryos Widespread expression Restricted expression No expression
~~ ~ ~
Lac Z expression at 8.5 dpc assayed at 12.5 dpc at 12.5 dpc at 12.5 dpc at 12.5 dpc
Widespread 28 21 5 2
Embryonic patterns 14 8 3 3
Extraembryonic patterns 2 2 0 0
No expression 26 8 0 0
clones whose pattern of reporter gene expression is regulated around the time point of interest. The choice of clones to follow in further detail varies with the par- ticular interests of each individual investigator.
The effort required for this screen of 300 clones makes it difficult to envision achieving saturation muta- genesis for all genes expressed in ES cells. One factor that could influence the ability to achieve saturation mutagenesis with this type of approach is insertion of the vector itself. Although it has been reported that transfection via electroporation is a random process, SUTHERLAND and coworkers found that 2/ 46 integra- tion events with a targetting vector integrated into the same locus ( TONEGUZZO et al. 1988; WED and SMITHIES 1992; SUTHERLAND et al. 1993). Although insertion of vector DNA is probably not an entirely random process, because we did not see any reiteration of patterns gener- ated in this study, our vector is certainly not limited to insertion into only a few sites in the genome. Given the low frequency of identifying genes expressed in a particular tissue or spatial domain, for example 4 / 279 for hindbrain stripes, it also makes it difficult to envi- sion using this type of global screen to target specific developmental processes.
A number of vector modifications are also possible that would allow for both improved identification and induction of mutations. Improved efficiency of isolating
ES clones with gene-trap integrations in active genes has been achieved by development of the @ G o gene- trap vectors, in which all neo'colonies should express @-
galactosidase activity ( FRIEDERICH and SORIANO 1991 )
.
The addition of a translation initiation sequence to the @-galactosidase gene makes it independent of the en- dogenous protein coding sequence and increases the frequency of expressing clones by at least threefold (un- published results). Replacement of the @-galactosidase gene by a gene that can be assayed in vivo would elimi- nate the replica plating step of the screen. One candi- date reporter gene is the green fluorescent protein re- cently used as a reporter gene in Caenarhabditis ekgans
( CHALFIE et al. 1994). Another useful addition to the gene-trap vector would be the insertion of sequences that respond to site-specific recombinases. Addition of these sequences would allow manipulation of the locus
where insertion occurred to create genetic mosaics and revertants or place other genes under the control of the endogenous promoter. This approach already has been used to generate a tissue-specific mutation in the mouse ( GU et al. 1994).
With these type of improvements in the gene-trap vector, the rate-limiting step of the screen becomes the production and screening of chimeric embryos. Im- proved ES cell lines such as R1 and improved tech- niques of generating chimeric embryos such as aggrega- tion between ES cells and single embryos can reduce the number of embryos and the effort needed to gener- ate chimeras ( NAGY et al. 1994). A further reduction the number of chimeric embryos required for a screen could be achieved by prescreening ES clones for genes that have a higher possibility of being involved in pro- cesses of interest. For example subcellular localization of the @-galactosidase activity could be used as a crite- rion. Another potential prescreen would take advantage of the ability of ES cells to differentiate spontaneously
( DOETCHMAN et al. 1985 )
,
or in response to growth and differentiation factors (HEATH and SMITH 1988; HILL and WURST 1993b). In addition, molecular character- ization of the tagged genes by RACE protocols could provide further information on which to base the choice of lines to be studied (VON MELCHNER et al.1990)
.
These types of approaches, coupled with a better understanding of the behavior of ES cells and the de- sign of better trapping vectors, should make mutagenic screens in the mouse feasible in a large number of laboratories.The authors thank Dr. ERIC EVE RE^, Dr. KENT ROBERTSON, Dr.
SUSAN STROME and MONICA MCANDREW~HILL for their critical read-
ing of the manuscript. This work was supported by National Institutes
of Health grant HD-25334 to J.R. and Ad. W.W. held a Fellowship
from the Deutsche Forschungsgerneinschaft, J.R. and A.J. are Interna-
tional Scholars of the Howard Hughes Medical Institute, J.R. is a
Terry Fox Cancer Research Scientist of the NCIC, Ad. is an MRC of
Canada Scientist, D.P.H. and F.G. held MRC of Canada Fellowships.
LITERATURE CITED
BELLEN, H. J., C . J. O'KANE, C. WIISON, U. GROSSNIKIAUS, R. K.
PEAR~ON et al., 1989 P-element-mediated enhancer detection: a
versitile method to study development in Drosophila. Genes Dev.
Gene-Trap Screen in the Mouse 899
BIER, E., H. VAESSIN, K. LEE, K McCALL, S. BARBELL et al., 1989
Searching for pattern and mutation in the Drosophila genome
with a P-lacZ vector. Genes Dev. 3: 1273-1287.
BOER, P. H., H. POTTEN, C. N. ADRA, K. JARDINE, G. MULLHOFER et
al., 1990 Polymorphisms in the coding and noncoding regions
of murine PGK-1 alleles. Biochem. Genet. 28: 299-308.
CAPECCHI, M. R., 1989 Altering the genome by homologous recombi-
nation. Science 244: 1288-1292.
CHALFIE, M., Y. Tu, G. EUSKIRGHEN, W. WARD and D. C. PRASHER,
1994 Green fluorescent protein as a marker for gene expression.
Science 263: 802-804.
CHAMBON, P., 1993 Local alterations of &ox-20 and Hox gene ex-
pression in the hindbrain suggest lack of rhombomeres 4 and 6 in homozygote null Hoxa-1 (Hox 1.6) mutant embryos. Proc.
Natl. Acad. Sci. USA 90: 7666-7670.
DOETSCHMAN, T. C., H. EISTEITER, M. KATZ, W. SCHMIDT and R.
KEMLER, 1985 The in vitro development of blastocystderived embryonic stem cell lines: formation of visceral yolk sac, blood
glands and myocardium. J. Embryo!. Exp. Morphol. 87: 27-45.
DOLLE, P., T. LUFKIN, R. KRUMIAUF, M. MARK, D. DUBOULE et al., 1992
Developmental defects of the ear, cranial nenes and hindbrain
resulting from a targeted mutation disruption of the mouse ho-
meobox gene Hox 1.6. Nature 3 5 5 516-520.
FRIEDRICH, G., and P. SORIANO, 1991 Gene traps in embryonic stem
cells: a genetic screen to identify and mutate developmental
genes in mice. Genes Dev. 5 1513-1523.
GOSSI.ER, A., and J. ZACHGO, 1993 Gene and enhancer trap screens
in ES cell chimeras. pp. 181-227 in Gene Targeting: A Practical
Approach, edited by A. L. JOWER. Oxford University Press, Ox- ford.
GOSSLER, A., A. L. JOWER, J. ROSSANT and W. C. SKARNES, 1989
Mouse embryonic stem cells and reporter constructs to detect
developmentally regulated genes. Science 244: 463-465.
G U, H., J. D. MARTH, P. C. ORBAN, H. MOSSMAN, and K RAJEWSKY,
I994 Deletion of a DNA polymerase beta gene segment in T
cells using cell type-specific gene targeting. Science 256: 103-
105.
HEATH, J. K., and A. G. SMITH, 1988 Regulatory factors of embryonic
stem cells. J. Cell Sci. 10 (Suppl.) : 257-266.
HILL, D. P., and W. WURST, 1993a Gene and enhancer trapping:
mutagenic strategies for developmental studies. pp.181-206 in
Current Topics in Dme@mental B i o b a , uolume 28, edited by Roger
A. PEDERSEN. Academic Press, Orlando.
HILL D. P., and W. WURST, 199313 Screening for novel pattern forma-
tion genes using gene trap approaches. Methods Enzymol. 225:
HOPE, I., 1991 “Promoter Trapping” in Caenwhabdztis elegans. Devel-
opment 1 1 3 399-408.
JEANNOTTE, L., J. C. R u I ~ , and E. J. ROBERTSON, 1991 Low level of
Hoxl.3 gene expression does not preclude the use of promo- torless vectors to generate a targeted gene disruption. Mol. Cell.
Biol. 11: 5578-5585.
JOWER, A. L., and G. R. MARTIN, 1987 En-1 and En-2, two mouse
genes with sequence homology to the Drosophila engrailed gene:
expression during embryogenesis. Genes Dev. 1: 29-38.
JOYNER, A. L., T. KORNBERG, K. G. COI.EMAN, D. R. COX and G. R.
MARTIN, 1985 Expression during embryogenesis of a mouse
664-681.
Y
gene with sequence homology to the Drosophila engrailed gene.
Cell 43: 29-37.
, ”
UUR, S., G. SINGH, J. L. STOCK, C. M. SCHREINER, A. KIER et al.,
1992 Dominant mutation of the murine Hox 2.2 gene results
in developmental abnormalities. J. Exp. Zool. 264 323-336.
KOLLER, B. H., and 0. SMITHIES, 1992 Altering genes in animals by
gene targeting. Annu. Rev. Immunol. 10: 705-730.
KORN, R., M. SCHOOR, H. NEUHAUS, U. HANSELING, R. SOININEN et
al., 1992 Enhancer trap integrations in mouse embryonic stem cells give rise to staining patterns in chimeric embryos with a
high frequency and detect endogenous genes. Mech. Dev. 39:
95-109.
KRUMLAUF, R , 1993 Hox genes and pattern formation in the brachial
region of the vertebrate head. Trends Genet. 9 106-112.
LE MOUELLIC, H., Y. LALLEMAND and P. BRUI.ET, 1992 Homeosis in
the mouse induced by a null mutation in the Hox 3.1 gene. Cell
LUFKIN, T., A. DIERICH, M. LEMEUR, M. MARK and P. CHAMBON, 1991
Disruption of the Hox 1.6 homeobox gene results in defects in
a region corresponding to its rostral domain of expression. Cell
MCLAIN, K., C. SCHREINER, K. L. YAGER, J. L. STOCK and S. S. POTTER,
1992 Ectopic expression of Hox 2.3 induces craniofacial and
skeletal malformations in transgenic mice. Mech. Dev. 39: 3-16.
MCMAHON, A. P., and A. BRADLEY, 1990 The Wnt-1 (Int-1) proto-
oncogene is required for development of a large region of the
mouse brain. Cell 6 2 1073-1085.
NAGY, A,, and J. ROSSANT, 1993 Production of completely ES cell-
derived fetuses, pp. 147-179 in Gene Targeting: A Practical Ap
poach, edited by A. L. JOYNER. Oxford University Press, Oxford.
NAGY, A,, E. Gocm, E. M. D m , V. R. PRIDEAUX, E. IVANYI et al., 1990
Embryonic stem cells alone are able to support fetal development
in the mouse. Development 110: 815-822.
NAGY, A., J. ROSSANT, R. NAGY, W. ABRAMOW-NEWERLY and J. C.
RODER, 1994 Derivation of completely cell culture derived mice from early-passage embryonic stem cells. Proc. Natl. Acad. Sci. USA 9 0 8424-8428.
REID, L., and 0. SMITHIES, 1992 Gene targetting and electroporation,
pp. 209-225 in Guide to electropmatim and electrofwion, edited by
D. C. CHANG, B. M. CHASSEY, J. A. SAUNDERS and A. E. SOWERS.
Academic Press, Orlando.
RISAU, W., H. SARIOIA, H. G . ZERWES, J. SAsSE, P. EKBLOM et al., 1988
Vasculogenesis and angiogenesis in embryonic-stem-cellderived
embryoid bodies. Development 102 471-478.
SKARNES, W. C., B. A. AUERBACH and A. L. JOINER, 1992 A gene trap
approach in mouse embryonic stem cells: the lacZ reporter is
activated by splicing, reflects endogenous gene expression and
is mutagenic in mice. Genes Dev. 6 903-918.
ST. JOHNSTON, D., and C. NUSSLEIN-VOW, 1992 The origin of
pattern and polarity in the Drosophila embryo. Cell 68: 201-
219.
SUTHERLAND, H., R. LOVELL-BADGE and I. JACKSON, 1993 Characteri-
sation of two identical independent non-homologous integration
sites in mouse embryonic stem cells. Gene 131: 265-268.
THISSE, C., and B. THISSE, 1992 Dorsoventral development of the
Drosophila embryo is controlled by a cascade of transcriptional
regulators. Development (Suppl.) 173- 181.
TONEGUZZO, F., A. KFATING, S. GLYNN and K. MCDONALD, 1988 Elec-
tric field-mediated gene transfer: characterization of DNA trans
69: 261 -264.
66: 1105-1119.
fer and patterns ofintegration in lymphoid cells. Nucleic Acids
Res. 16: 5515-5532.
VON MELCHNER, H., S. REDDY and H. E. RULEY, 1990 Isolation of
Natl. Acad. Sci. USA 87: 3733-3737.
cellular promoters by using a retrovirus promoter trap. Proc.
WIWON, C., R. K. PEARSON, H. J. BELLEN, C. J. O’KANE, U. GROSS
NIKLAUS et al., 1989 P-element-mediated enhancer detection: an efficient method for isolating and characterizing developmen-
tally regulated genes in Drosophila. Genes Dev. 3: 1301-1313.
WURST, W., and A. L. JOINER, 1993 Production of targeted embryonic
stem cell clones, pp. 33-61 in Gene Targeting: A Practical AppOach,
edited by A. L. JOYNER. Oxford University Press, Oxford.