International Journal of Research (IJR)
e-ISSN: 2348-6848, p- ISSN: 2348-795X Volume 2, Issue 08, August 2015Available at http://internationaljournalofresearch.org
Pulse Width Modulation based inverter for standalone solar PV
cell application”
Sana Tarannum
Research Scholar AL-FALAH UNIVERSITY FARIDABAD Email ID : [email protected]
Javed Ashraf
Professor, Department of Electronics & Communication Engineering AL-FALAH UNIVERSITY Email ID : [email protected]
Abstract:
As the power demand is going on increasing day-by-day, it is responsible for our engineers to make it available as per the demand. Many of the power generating plant are using non-renewable sources as their primary source. But these may become extinct at any time and before facing the situation we have to choose an alternative to avoid the power crisis. One of the best alternatives is choosing non-conventional sources like solar energy, Wind Energy, Tidal energy, Bio-mass energy etc as the primary sources for power generation in power stations. The power from these sources is several times greater than the one, which we are using at the present. Out of these energy sources, the best one which suits for our country is the solar energy. The power from the sun intercepted by the earth is approximately 1.8*1011 MW, which is many thousands of times larger than the present consumption rate on the earth of all commercial energy sources. Thus if we convert this to other forms of energy, it may be one of the most promising of the non- conventional energy resources. This paper defines a 5-parameter based simulation model for PV cells under partial shading conditions in order to allow estimate the characteristics of the cells so that proper conclusions regarding steps and measures need to be taken to increase solar cell efficiency and thus solar energy capitalization can
International Journal of Research (IJR)
e-ISSN: 2348-6848, p- ISSN: 2348-795X Volume 2, Issue 08, August 2015Available at http://internationaljournalofresearch.org
investigate I-V, P-I and P-V characteristics Single phase standalonen inverter using MATLAB/Simulink.+
Keywords: standalone inverter; Maximum power point tracker (MPPT); Total harmonic distortion; photovoltaic system
1.Introduction
Growing demand for electrical energy, soaring prices of fossil fuels with increased concern about degrading environment have generated enormous amount of interest in the utilization of renewable energy sources such as sun.power generation from photovoltaic (pv)cell has seen rapid groeth in the past few years leading to extensive research on using solar energy. A PV system has the following advantages:
1. Low maintenance cost
2. Absences of moving or rotating parts and hence no wear and tear
3. Almost no environmental impact
The PV system has significant potential commercially both off grid and grid connected ranging form very small applications to megawatts of power in SPV power plants.Despite its rapid growth in past few years,there are several challenges that hinder the commercial use of PV system. These include high installation cost of power generation systems and low energy conversion- efficiency .The I-V charecteristiic of a PV cell is non – linear with maximum power available at the knee point. A PV system is generally operasted in afashion to extract maximum power from the PV source .Maximum power-point tracking(MPPT)
power electroniucs converters such as dc-dc converter or dc-dc-ac inverter and some control algorithms in oirdere to optimize the utilization of PV systems.The objectives of MPPT is to extract maximum power generated byb the PV system under varyibng condition of temperature and solar insolation . a major challenges in solar PV based system is to tackle the non-linear current-voltagew(I-V)charecteristics of PV cell,leading to the tracking of a unique maximum power point(MPP) on its power-voltage(P-V) charecteristics curve. Generally,the PV panels are connected in series(to enhancethe PV array voltage)and parallel (to enhance the PV currrent) so as tomeet the load power demand.Since PV module has non-linear charecteristcs, it is necessary to model it for the design and simulation of PV system applications.
The stand-alone system is used in off-grid application with battery storage. Its control
International Journal of Research (IJR)
e-ISSN: 2348-6848, p- ISSN: 2348-795X Volume 2, Issue 08, August 2015Available at http://internationaljournalofresearch.org
power. However, the values of both panel voltage and current vary corresponding to the variation of insolation and temperature. These values also correspond to a particular load resistance, which is equal to V/I as specified by ohm’s law. The power (P) is given by P=V*I. A PV cell has an exponential relationship between current and voltage, and MPP occurs at the knee of the curve
wheredP/dV=0. At this point the characteristic resistance of the PV cell becomes equal to the load resistance .
MPPT utilize some type of control circuit or logic to search for this point and thus to allow the converter circuit to extract the maximum power available from a cell.
2. PV SYSTEM COMPONENTS
Fig 1. PV MODULE MATHEMATICAL MODELLING
3. SOLAR PV CELL/ARRAY
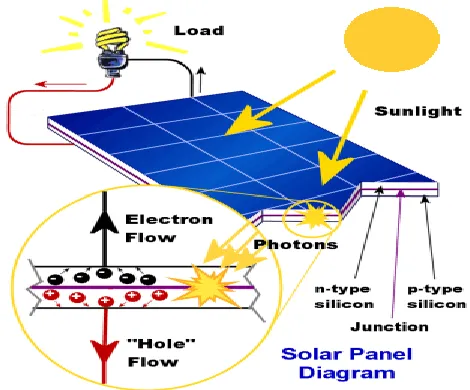
A solar panel cell basically is a p-n semiconductor junction. When exposed to the light, a DC current is generated (fig. 1.2.1). The smallest unit is a cell which when combined in a string i.e. either in series or parallel, form a module which, further, in a bigger number forms an array.The generated current varies linearly with the solar irradiance. The equivalent electrical circuit of an ideal solar cell can be treated as a current source parallel with a diode. The solar cells are connected in series and parallel to create a solar array.
Fig. shows I-V and P-V characteristics of a typical PV cell.
Figure 2: Working of a simple PV system.
International Journal of Research (IJR)
e-ISSN: 2348-6848, p- ISSN: 2348-795X Volume 2, Issue 08, August 2015Available at http://internationaljournalofresearch.org
4 . SOLAR CELL
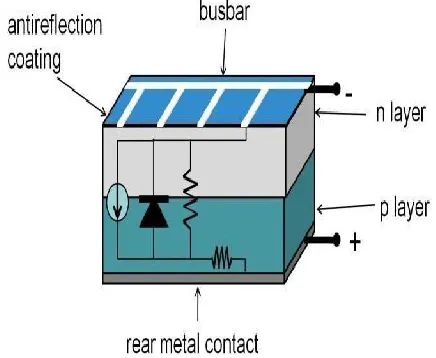
A Solar cell (also called a Photo-Voltaic cell) is an electrical device that converts the electrical energy of light directly into electricity as in figure 2 . A typical silicon PV cell is composed of a thin wafer consisting of an ultra-thin layer of phosphorus-doped (N-type) silicon on top of a thicker layer of boron-doped (P-type) silicon. An electrical field is created near the top surface of the cell where these two materials are in contact, called the PN junction. When sunlight strikes the surface of a PV cell, this electrical field provides momentum and direction to light stimulated electrons, resulting in a flow of current when the solar cell is connected to an electrical load. Regardless of size, a typical silicon PV cell produces about 0.5-0.6 volt DC under open circuit, no-load conditions. The current (and power) output of a PV cell depends on its efficiency and size (surface area), and is proportional to the intensity of sunlight striking the surface of the cell. For example, under peak sunlight conditions, a typical commercial PV cell with a surface area
of 1.580*0.800 square metres will produce about 170W peak power.
If the sunlight intensity were 40 percent of peak, this cell would produce about 67W.
Figure 4. PV module configurations in a PV plant
5 . 5-PARAMETER BASED
MODEL OF A SOLAR PV CELL
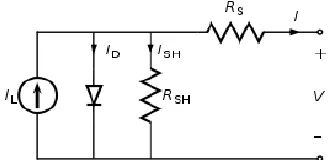
A solar cell model is represented by a constant current source and a diode as shown in Figure 5. The light generated current, IL, is the
amount of current produced by the electron-hole pairs generated by the impinging sunlight. This phenomenon is called photovoltaic effect. IL
depends on the intensity of the incident solar light, characteristics of the solar panel, and the ambient temperature. The most important electrical characteristics of a PV cell module/array are [3]:
a) Short Circuit current (ISC): Usually this is
associated with the light generated current IL and is considered the same for normal levels of solar irradiance. It increases slightly with increasing temperature. It is directly proportional to the incident optical power.
b) Open circuit voltage (VOC): It is
logarithmically dependent on the solar irradiance. With the increase in temperature there is an increase in saturation current and results in reduction of the open circuit voltage.
The behavior of photovoltaic (PV) cells can be modeled with an equivalent circuit shown in Figure 5. This circuit includes a series resistance,RS and a diode in parallel with a shunt
resistance, RSH. The letter “V” represents the
voltage at the load. This circuit can be used for an individual cell, for a module consisting of several cells, or for an array consisting of several modules.
For the typical silicon solar cell used in the design here:
Open circuit voltage ( VOC ) = 0.57 V
Short Circuit current ( ISC ) = 0.76 A (Depends
International Journal of Research (IJR)
e-ISSN: 2348-6848, p- ISSN: 2348-795X Volume 2, Issue 08, August 2015Available at http://internationaljournalofresearch.org
a) Movement of current through the emitter and base of the solar cell
b) Contact resistance between the metal contact and silicon
c) Resistance of the top and the rear metal contacts.
Shunt resistance mostly arises due to:
a) Manufacturing defects, rather than poor solar cell design.
b) Leakage of current through the cell, around the edges of the device and between contacts of different polarity.
Figure 5: Equivalent circuit representing the 5-Parameter model
Application of Kirchoff’s Current Law (Equation (3.1)) on the equivalent circuit[5] results in the current flowing to the load.
𝐼 = 𝐼𝐿− 𝐼𝐷− 𝐼𝑆𝐻...(1)
The shape of the current-voltage (I-V) curve changes as the operating conditions (cell temperature, TC and effective irradiance, Geff)
change, therefore it is expected that the value of the parameters describing the curve will change as well. Figure 3.1. 2 shows how the shape of the I-V curve changes by changes in the operating conditions.
Figure 6 : I-V and P-V characteristics of a PV cell
If the diode current and the current through the shunt resistance (IDand ISH, respectively) are
expanded, Equation (2) is obtained. Equation (3) is used to calculate the power (P).
𝐼 = 𝐼𝐿− 𝐼0 𝑒 𝑉+𝐼𝑅𝑆
𝑎 − 1 −𝑉+𝐼𝑅𝑆
𝑅𝑆𝐻 ...(2)
𝑃 = 𝐼𝑉
…
(3)
The five parameters (from which the 5-Parameter model obtains its name) are a,IL, I0, RS and RSh ,
where
a: ideality factor IL: light current
I0: diode reverse-saturation current RS: series resistance
RSh: shunt resistance
The shape of the current-voltage (I-V) curve changes as the operating conditions (cell temperature, TC, effective irradiance, Geff, and
incidence angle, θ) change, therefore it is expected that the value of the parameters describing the curve will change as well. It is observed that if the five parameters (a, I0, IL, RS
and RSh) that correspond to a specific cell
International Journal of Research (IJR)
e-ISSN: 2348-6848, p- ISSN: 2348-795X Volume 2, Issue 08, August 2015Available at http://internationaljournalofresearch.org
6. CALCULATION OF REFERENCE PARAMETERS AT SRC
To calculate the five reference parameters (aref, Io,ref, IL,ref, Rs,ref, and Rsh,ref), five pieces of
information are needed at reference conditions (usually Standard Rated Conditions, SRC, where Tc=25 ºC and Geff=1000 W/m2). The pieces of
information are the short circuit current (Isc0),
open circuit voltage (Voc0), current and voltage at
the maximum power point (Imp0 and Vmp0,
respectively), and the slope of the I-V curve at the short circuit point. The subscript “0” indicates at reference conditions. This information is usually provided by the manufacturer.
To find the reference parameters it is important to know the meaning of each piece of information[2]:
At short circuit current: I=Isc0, V=0
At open circuit voltage: I=0, V=Voc0
At the maximum power point: I=Imp0, V=Vmp0
At the maximum power point: dP/dVmp=0
At short circuit: dIsc/dV= -1/Rsh,ref
Having these five pieces of information, Equation (2) can be rewritten as Equation (4). Substituting the known information results in Equations (5) to (9).
𝐼 = 𝐼𝐿,𝑟𝑒𝑓 − 𝐼0,𝑟𝑒𝑓[e
V +I.Rs ,𝑟𝑒𝑓
𝑎 𝑟𝑒𝑓 − 1]
–
𝑉+𝐼.𝑅𝑠,𝑟𝑒𝑓Rsh,ref
…
(4)
𝐼𝑠𝑐 = 𝐼𝐿,𝑟𝑒𝑓 − 𝐼0,𝑟𝑒𝑓 [e
𝐼𝑠𝑐0.𝑅𝑠,𝑟𝑒𝑓
𝑎 𝑟𝑒𝑓 − 1]
−
𝐼𝑠𝑐 0.𝑅𝑠,𝑟𝑒𝑓
Rsh ,ref
… (5)
0 = 𝐼𝐿,𝑟𝑒𝑓 − 𝐼0,𝑟𝑒𝑓[e
𝑉𝑜𝑐
𝑎 𝑟𝑒𝑓 − 1]
−
𝑉𝑜𝑐Rsh,ref
… (6)
𝐼𝑚𝑝 0 = 𝐼𝐿,𝑟𝑒𝑓 − 𝐼0,𝑟𝑒𝑓 e
V mp 0+Imp 0.Rs,ref 𝑎 𝑟𝑒𝑓
−
𝑉𝑚𝑝 0+𝐼𝑚𝑝 0.𝑅𝑠,𝑟𝑒𝑓
Rsh ,𝑟𝑒𝑓
… (7)
𝑑(𝐼𝑉)
𝑑𝑉
= 0
… (8)
𝑑𝐼
𝑑𝑉𝑠𝑐
= −
1 𝑅𝑠ℎ,𝑟𝑒𝑓… (9)
The five reference parameters (aref, Io,ref, IL,ref, Rs,ref, and Rsh,ref) can be obtained by
simultaneously solving Equations (5) through (9).Using Gauss Siedel method these equations are solved and following values are obtained: a ref = 0.0392 eV
Io,ref= 0.3223 ∗ 10−6 A
IL,ref = 0.7630 A
Rs,ref = 0.03684 Ω
Rsh,ref=10 Ω
7. SIMULATION OF A SOLAR CELL MODEL:
By varying environmental parameters i.e. insolation (Geff) and temperature (TC), which are in W/m2 and Kelvin respectively in the developed model for PV cell (Figure 3), we get different behaviors of I-V and P-V curves.
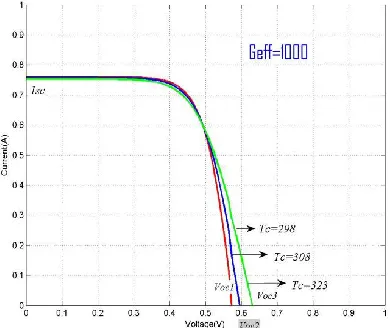
Following observations are made. a) Varying temperature (Tc)
By varying values of Tc different curves are obtained for the developed PV cell model.
International Journal of Research (IJR)
e-ISSN: 2348-6848, p- ISSN: 2348-795X Volume 2, Issue 08, August 2015Available at http://internationaljournalofresearch.org
Voc are observed. As we can see with increasing Tc, Voc increases Geff being constant.
Figure 4: variation of I-V curve with respect to Tc
P-V characteristics:
Different PV curves are obtained by varying Tc, as shown in figure 5. It is observed that for a single cell, output voltage Voc is directly proportional to the temperature Tc.
Figure 5: Variation of P-V curve with respect to Tc
CONCLUSION
The 5-Parameter model presented in this paper is a user interactive model which accepts data and shows corresponding behavior on SIMULINK platform to predict the output for specified cell
parameters under different operating conditions. The model requires an easy one time calculation of the five parameters.
APPENDIX
C program to evaluate the reference parameters #include<stdio.h>
#include<math.h> #include<conio.h> void main()
{ clrscr(); int i; float
ion=0.0000003221,ilo=0.7613,ao=0.0352,rso=0. 0364,rsho=9.70;
float
rs,a,il,rsh,io,c,d,e,z,po,ko,xo,x1,rsp=rso,aop=ao,r shp=rsho,ilp=ilo,iop;
iop=ion; io=ion; a=ao; rs=rso; rsh=rsho; il=ilo; float
imp=0.69119,vmp=0.45,isc=0.7606,voc=0.5728; for(i=1;i<=5;i++)
{
c=exp(isc*rs/a);
rs=(rsh/isc)*(il-isc+io*(1-c)); z=log((il/io)-(voc/(rsh*io))+1); a=voc/z;
po=imp*rs; ko=(vmp+po)/a; d=exp(ko);
il=imp+((vmp+imp*rs)/rsh)+(io*d); xo=(vmp+imp*rs)/a;
x1=exp(xo);
rsh=(rs*imp-vmp*imp)/((io*x1*(vmp-imp*rs)/a)-imp);
e=exp(isc*rs/a);
io=a*rs/(rsh*(rsh-rs)*e); if(fabs(rs-rso)>0.001) rso=rs;
International Journal of Research (IJR)
e-ISSN: 2348-6848, p- ISSN: 2348-795X Volume 2, Issue 08, August 2015Available at http://internationaljournalofresearch.org
rsp=rs;
if(fabs(a-ao)>0.01) ao=a;
else aop=a;
if(fabs(il-ilo)>0.001) ilo=il;
else ilp=il;
if(fabs(rsh-rsho)>0.001) rsho=rsh;
else rshp=rsh;
if(fabs(io-ion)>10^(-7)) ion=io;
else iop=io; }
printf("c= %f\n",c); printf("z= %f\n",z); printf("po= %f\n",po); printf("ko= %f\n",ko); printf("d= %f\n",d); printf("x1= %f\n",x1);
printf("rs= %f\n a= %f\n il= %f\n rsh=%f\n io=%f\n",rsp,aop,ilp,rshp,iop);
getch(); }
REFERENCES
[1] Nguyen D.D., “Modelling and
reconfiguration of solar photovoltaic arrays under non-uniform shadow conditions”, PhD Thesis, Chapter 1-2, University of North eastern, January,2008.
[2] I. H. Altas and A.M. Sharaf, “A Photovoltaic Array Simulation Model for Matlab-Simulink GUI Environment,” IEEE, Clean Electrical Power, International Conference on Clean
Electrical Power (ICCEP '07), June14-16, 2007, Ischia, Italy.
[3] S. Chowdhury, S. P. Chowdhury, G. A. Taylor, and Y. H. Song, “Mathematical Modeling and Performance Evaluation of a Stand-Alone Polycrystalline PV Plant with MPPT Facility,” IEEE Power and Energy Society General Meeting - Conversion and Delivery of Electrical Energy in the 21st Century, July 20-24, 2008, Pittsburg, USA. International Conference on Electrical Energy Systems (ICEES 2011), 3-5 Jan 2011.
[4] Jee-Hoon Jung, and S. Ahmed, “Model Construction of Single Crystalline Photovoltaic Panels for Real-time Simulation,” IEEE Energy Conversion Congress & Expo, September 12-16, 2010, Atlanta, USA.
[5] S. Nema, R. K. Nema, and G. Agnihotri, “Matlab/ simulink based study of photovoltaic cells / modules / array and their experimental verification,” International Journal of Energy and Environment, pp.487-500, Volume 1, Issue 3, 2010.
[6] K. H. Hussein and I. Muta, “Maximum photovoltaic power tracking: An algorithm for rapidly changing atmospheric conditions,” Proc. Inst. Electr.Eng. Gener., Transmiss. Distrib., vol. 142, no. 1, pp. 59–64, Jan. 1995.