Soil Stabilization using Fly Ash and Rice Husk
Ash
Er. Jasvir Singh1, Er.Harpreet Singh Maan2
Assistant Professor, Department of Civil Engineering, Chandigarh University, Punjab, India1
Assistant Professor, Department of Civil Engineering, Chandigarh University, Punjab, India2
ABSTRACT: Soil is a complex material. Recycled and waste materials like fly ash, bagasse ash, rise husk ash can be used to soil stabilization to improve physical and chemical properties of soil. In addition to that properties which can improved by soil stabilization are CBR, shear strength of soil, UCS and bearing capacity etc. The objective of this study to check the amount of fly ash at which sample of soil and fly ash gives optimum values of CBR and UCS and after that rice husk ash is added in different proportions in the sample of soil and optimum quantity of fly ash to achieve the optimum value of CBR.
I. INTRODUCTION
Due to rapid growth in highway construction there is need of good earth. Soil cannot be replaced with good soil everywhere as it is very costly and increase the project cost. This problem can be overcome with improvement in properties of soil which is to be used for infrastructure project. Many investigations had been carried out to use waste materials to improve the soil properties and to utilize the waste materials in view of better environment.
Objective of this study is to improve the properties of locally available clayey soil.For this research, soil sample was taken from Mohali district. Stabilization is done by adding different percentages of fly ash and rice husk ashes. Stabilization is done for following purposes-
1. To evaluate the CBR by using optimum content of fly ash 2. To evaluate the UCS by using optimum content of fly ash 3. To evaluate the CBR by using optimum content of rice husk ash
II. MATERIALS AND METHODOLOGY
Fly ash is residual material remained after combustion of coal in thermal power plant. Fly ash contains fine particles of silicon dioxide (Sio2), aluminum oxide, iron oxide and calcium oxide. Fly ash has been used in many civil engineering projects successfully. Fly ash provides stability to sub grade, reduce earth pressure and also improves stability of slopes. Usually fly ash is mixed with clayey soils to improve properties as these soils cannot be used directly for construction due to their unfavorable properties.RHA is a carbon neutral green product. Lots of ways are being thought of for disposing them by making commercial use of this RHA. RHA is a good super-pozzolan.
1. Natural soil.
2.1INDEXPROPERTIESOFSOIL Plasticity Index
Plasticity index of soil was 5 % which is numerical difference between liquid limit and plastic limit. Type of soil
The type of soil was checked from plasticity chart. It was seen that soil which is taken for this study is intermediate plasticity. As per IS 1498 soil is classified as CI.
Engineering properties are indicated by index properties of in table 2.1.
Table2.1 GeotechnicalPropertiesofsoil
SR.NO PROPERTIES VALUE CONFIRMINGTOIS CODE
1. Specificgravity(G) 2.60 IS 2720 : Part 3 : Sec 1 :1980
2. Maximum drydensity(MDD) 2.124 gm/cc IS 2720 : Part VII: 1980
3. Optimum moisture content(OMC) 8.4 % IS 2720 : Part VII: 1980
4. Naturalmoisture content 8.6 % IS 2720 : Part 2 : 1973
5. Liquid limit 24 IS 2720 : Part 5 : 1985
6. Plastic limit 19 IS 2720 :Part 5 : 1985
III.RESULTS AND DISCUSSION
Maximum dry density (MDD) and Optimum moisture content (OMC) of soil at different fly ash contents given in table 3.1
Ash content (%) 0 8 14 18 24
OMC (%) 8.5 9.3 9.7 10.7 11.0
MDD (gm/cc) 2.124 2.012 1.990 1.920 1.900
8 9 10 11
O
M
C
(%
)
FIG .3.1OMC AND MDD AT VARIOUS PERCENTAGES OF FLY ASH
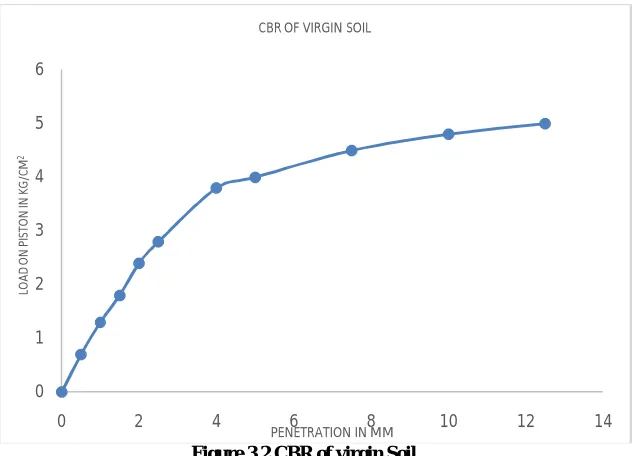
3.1CALIFORNIA BEARING RATIO OF VIRGIN SOIL (CBR TEST)
Figure 3.2 CBR of virgin Soil
1.5 1.6 1.7 1.8 1.9 2 2.1 2.2 2.3 2.4 2.5
0 2 4 6 8 10 12 14 16 18 20
M
D
D
(g
m
/c
c)
Ash content (%)
VARIATION OF MDD WITH VARIOUS %AGE OF FLY ASH
0 1 2 3 4 5 6
0 2 4 6 8 10 12 14
LO
A
D
O
N
P
IS
TO
N
IN
KG
/C
M
2
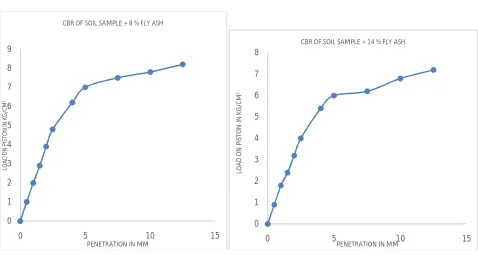
Figure 3.3 CBR of soil sample with 8% fly ash Figure 3.4 CBR graph at 14 % fly ash
Figure 3.5 CBR graph at 18 % fly ash Figure 3.6 CBR graph at 24 % fly ash 0 1 2 3 4 5 6 7 8 9
0 5 10 15
LO A D O N P IS TO N IN KG /C M 2
PENETRATION IN MM CBR OF SOIL SAMPLE + 8 % FLY ASH
0 1 2 3 4 5 6 7 8
0 5 10 15
LO A D O N PI ST O N I N K G /C M 2
PENETRATION IN MM CBR OF SOIL SAMPLE + 14 % FLY ASH
0 1 2 3 4 5 6 7 8 9
0 5 10 15
LO A D O N PI ST O N I N K G /C M 2
PENETRATION IN MM CBR OF SOIL SAMPLE + 18 % FLY ASH
0 1 2 3 4 5 6 7 8 9
0 5 10 15
LO A D O N PI ST O N I N K G /C M 2
Table 3.2: Summary of CBR test with various percentages of fly ash
Sample No
Composition
Soaked CBR (%)
At 2.5 mm penetration
At 5 mm penetration
CBR
1 Soil 3.94 3.86 3.94
2 Soil with 8% fly ash 6.9 6.7 6.9
3 Soil with 14 % fly ash 6.8 6.3 6.8
4 Soil with 18 % fly ash 6.6 6.2 6.6
5 Soil with 24 % fly ash 6.4 6.3 6.4
Figure 3.8 Variation of CBR with different %age of fly ashFigure 3.9 unconfined compressive strength at different percentages of fly ash
0 1 2 3 4 5 6 7
0 8
14 18
24
3.94
6.9 6.8
6.6 6.4
C
B
R
v
al
u
e
in
%
ag
e
Various %age of PSA Variation of CBR with different %age of fly ash
0 100 200 300 400 500 600
0 8 14 18 24 26
215 238
345 390
480 456
U
C
S
(k
N
/m
2)
Ash content (%)
Fig 3.10 Variation of strain with different percentages of ash content
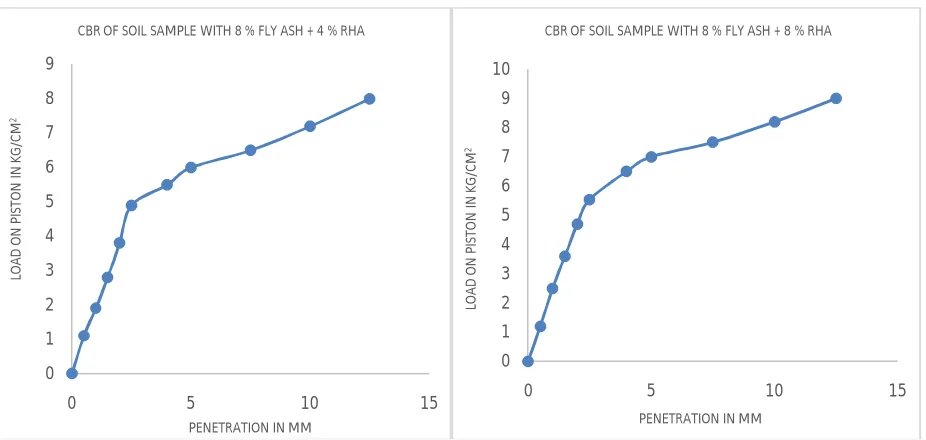
Figure 3.11 CBR graph at 8% fly ash and 4% RHA Figure 3.12 CBR graph at 8% fly ash and 8 % RHA 0
50 100 150 200 250 300 350 400 450 500
0 5 10 15 20
U
C
S
(k
N
/m
2
2
)
Strain(%)
0 % fly ash 8% fly ash 14 % fly ash 18 % fly ash 24 % fly ash
0 1 2 3 4 5 6 7 8 9
0 5 10 15
LO
A
D
O
N
PI
ST
O
N
I
N
K
G
/C
M
2
PENETRATION IN MM CBR OF SOIL SAMPLE WITH 8 % FLY ASH + 4 % RHA
0 1 2 3 4 5 6 7 8 9 10
0 5 10 15
LO
A
D
O
N
PI
ST
O
N
I
N
K
G
/C
M
2
PENETRATION IN MM
Figure 3.13 CBR graph at 8% fly ash and 12% RHAFigure 3.14 CBR graph at 8% fly ash and 16% RHA
Figure 3.15 CBR graph at 8% fly ash and 20 % RHAFigure 3.15 CBR Summary of soil with 8% fly ash and different %age of RHA
0 2 4 6 8 10 12
0 5 10 15
LO A D O N PI ST O N I N K G /C M 2
PENETRATION IN MM CBR OF SOIL SAMPLE WITH 8 % FLY ASH + 12 % RHA
0 2 4 6 8 10 12
0 5 10 15
LO A D O N PI ST O N I N K G /C M 2
PENETRATION IN MM
CBR OF SOIL SAMPLE WITH 8 % FLY ASH + 16 % RHA
0 1 2 3 4 5 6 7 8 9 10
0 5 10 15
LO A D O N PI ST O N I N K G /C M 2
PENETRATION IN MM
CBR OF SOIL SAMPLE WITH 8 % FLY ASH + 20 % RHA
0 1 2 3 4 5 6 7 8 9 0 4 8 12 16 20 6.9 7.2 7.8 8.9 8.7 8.5 C B R v al u e in % ag e
Various %age of RHA
IV.CONCLUSIONS
The experimental work done on soil stabilization with fly ash and rice husk ash can be concluded as follows -
Soil with varying percentage of fly ash gives maximum CBR value at 8% fly ash. It increases from 3.94 % to 6.8 %. With further addition of fly ash, it keeps decreasing.
Unconfined compressive strength of soil with 8% fly ash increased as compared to virgin soil from 2.154 kg/cm2 to 2.38 kg/cm2. It was maximum as 4.80kg/cm2 when 24 % Paper mill sludge ash was added. After there was decrement in UCS when 26 % paper mill sludge ash was added.
The soil with 8 % fly ash was further blended with variable percentage of rice husk ash (4%,8%, 12%,16%&20%). The major improvement in CBR occurred at 8% fly ash mixed with 12% rice husk ash and thereafter, further addition of rice husk ash is causing gradual change in CBR values. The peak soaked CBR value is 8.9 %.
REFERENCES
[1] Amo. O.O., Fajobi, A.B., &Afekhuai, S.O. (2005). “Stabilizing potential of cement and fly ash mixture on expansive clay soil”. Journal of Applied Sciences, 5(9), 1669-1673.
[2] Athanasopoulou, A. (2014). Addition of lime and fly ash to improve highway subgrade soils. Journal of Materials in Civil Engineering, 26(4), 773-775.
[3] Bose B(2012)” Geo engineering properties of expansive soil stabilized with fly ash”, Electronic Journal of Geotechnical Engineering, Vol. 17, Bund. J, 2012, pp. 1339-1353.
[4] Buhler, R.L., &Cerato, A.B. (2007). “: Stabilization of Oklahoma Expansive Soils Using Lime and Class C fly ash.” GSP 162 Problematic Soils and Rocks and In Situ Characterization.
[5] Senol, A. (2012). “Effect of fly ash and polypropylene fibres content on the soft soils”. Bull EngGeol Environ,71, 379–387.
[6] Senol, A., Edil, T.B., Shafique, Md.S.B., Acosta, H.A., & Benson, C.H. (2006). “Soft subgrades stabilization by using various fly ashes.” Resources, Conservation and Recycling,
[7] Sezer, A, Inan, G., Yılmaz, H.R., &Ramyar, K. (2006). “Utilization of a very high lime fly ash for improvement of clay.” Building and Environment, 41, 150–155.
[8] Sharma N.K., Swain,S.K., Sahoo, U.C. (2012).” Stabilization of a Clayey Soil with Fly Ash and Lime:A Micro Level Investigation”. GeotechGeolEng, 30, 1197–1205.
[9] T.B. Edil, H.A. Acosta & C.H. Benson. (2006).” Stabilizing Soft Fine-Grained Soils with Fly Ash”. Journal of Materials in Civil Engineering, 18(2), 283-294.