Solution of Economic Dispatch Problem using
BBO for Power system optimization
Gaurav Bansal
1, Rakesh Narvey
2Assistant Professor, Dept. of EE, MITS Engineering College, Gwalior, M.P, India 1 PG Student [ISD], Dept. of EE, MITS Engineering College, Gwalior, M.P, India 2
ABSTRACT: This paper presents the biogeography based optimization (BBO) algorithm to solve economic load dispatch problem. Economic load dispatch problem is basically an optimization problem where objective function may be highly nonlinear, non-convex, and no differentiable and may have multiple local minima. The models of biogeography explain how an organism arises, immigrate from an environment to another and gets eliminated. This method is based on two steps mutation and migration. This paper provides to show the minimum cost of the system constraint for each generating system also if the power demand increases the minimum cost also increases with the standard deviation.BBO technique is implemented in MATLAB environment.
KEYWORDS: Biogeography-Based Optimization (BBO), Economic Load Dispatch (ELD), GA, Migration, Mutation, Power Demand (PD).
I.INTRODUCTION
Economic Load Dispatch (ELD) are designed and operated to meet the continuous variation of power demand. ELD seeks the best generation schedule for the generating plants to supply required demand at minimum cost of production [1]. In recent years certain artificial intelligence (AI) techniques such as Fuzzy Logic (FL)[2], Differential Evolution (DE) [3], Genetic Algorithm (GA) [4], Particle Swarm Optimization (PSO) [5], Bacteria Foraging Optimization (BFO)[6], etc. have been successfully applied to the ELD problems for units having non-linear cost functions. A new population based evolutionary algorithm of optimization has been proposed, based on biography by Simon in year 2008[7].Biogeography is the nature’s way of distributing species. Let us consider an optimization problem with some trial solutions of it. In BBO, a good solution is analogous to an island with a high Habitat Suitability Index (HSI), and a poor solution represents an island with a low HSI. High HSI solutions resist change more than low HSI solutions. Low HSI solutions tend to copy good features from high HSI solutions. The shared features remain in the high HSI solutions, while at the same time appearing as new features in the low HSI solutions. This is as if some representatives of a species migrating to a habitat, while other representatives remain in their original habitat. Poor solutions accept a lot of new features from good solutions. This addition of new features to low HSI solutions may raise the quality of those solutions. This new approach to solve a problem is known as biogeography-based optimization (BBO).
II.OPTIMIZATION OF ECONOMIC LOAD DISPATCH FORMULATION
The ELD problem having an objective function minimizes the total generation cost, FT, while fulfilling various
constraints when supplying the required load demand of a power system [1]. The objective function is given by Eq. 1:
min FT= min 𝑛𝑖=1𝐹𝑖 𝑃𝐺𝑖 = 𝑚𝑖𝑛 𝑖=1𝑛 𝐴𝑖𝑃𝐺𝑖2 + 𝐵𝑖𝑃𝐺𝑖+ 𝐶𝑖 ……… (1)
where, PGi is the output power generated by the ith generator, Fi (PGi) is the Generation cost function of ith generator
and Ai, Bi, Ci are the Cost coefficients of ith generator, n is the number of generators.
Constraint 1: This constraint is an inequality constraint for each generator. For normal system operations, real power output of each generator is within its lower and upper bounds and is known as generation capacity constraint given by Eq. 2:
PGimin≤PGi ≤ PGimax ……… (2)
where, PGiminand PGimax are the lower and upper limit of the power generated by ith generator.
Constraint 2:This constraint is an equality constraint. In which the equilibrium is met when the total power generation must equals the total demand PD and the real power loss in transmission lines PL. This is known as power balance
constraint can be expressed as given in Eq. 3:
𝑃𝐺𝑖 𝑛
𝑖=1 = PD + PL ……… (3)
The transmission losses are considered as afunction of the generators output, can be expressed asgiven in Eq. 4:
PL= 𝑛𝑖=1 𝑛𝑗 =1𝑃𝐺𝑖𝐵𝑖𝑗𝑃𝐺𝑗 + 𝑛𝑖=1𝐵𝑜𝑖𝑃𝐺𝑖+ 𝐵𝑜𝑜 (4)
where, Bij, Boi, Boo are the transmission power loss B coefficients, which are assumed to be constant. In the summary,
the objective of economic power dispatch optimization is to minimize FT subject to the constraints given by the Eq. 2-4.
III.BIOGEOGRAPHIC BASED OPTIMIZATION
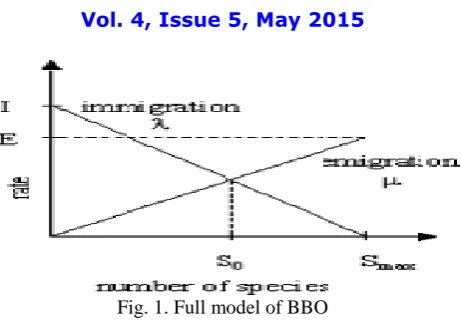
Biogeography shows a model of migration of a type of living thing from an island to another and it shows the overthrow and rise of living things in an environment. Habitat is an island that is physically separated from other islands [10]. A factor that is important for a habitat is HSI. The environment that is suitable for live has a high HSI and vice versa. Some Factors can impress the quality and quantity of HSI and there are SIV (suitability index variable). These variables 101 can regard as an independent variable and HSI can be calculated based on SIV’s. Temperature, diversity of vegetation, rain down fall, etc. are examples of SIV’s. Habitats that have high HSI can have large number of living things and habitats that have low HSI, have small number of living things. Habitats with high HSI, because of their large number of creature, have many species that they can migrate to other habitats. Transferring creatures from one habitat to another is called emigration. The process of entering creatures to a habitat from another habitat is called immigration. Thus, a habitat with high HSI has a high emigration rate and habitat with low HSI has high immigration rate. This immigration of creatures from high HSI habitats to low HSI habitats can enhance the HSI of this habitat because the HSI of habitat is directly proportional to creatures’ variety. Fig.1 gives a full model of immigration rate and emigration rate. In the immigration figure, we can see that maximum immigration rate occurred when there are no creatures in the habitat. If there are small numbers of creatures in the habitat, large number of living things can enter to the habitat and consequently immigration rate is high. When number of creatures in the habitat goes up and habitat becomes populated, small number of creatures can live in this habitat and immigration rate decreases. The maximum number of creatures that can live in the habitat is Smax. In this condition immigration rate is zero because no creatures can enter to this habitat. With considering emigration diagram of Fig.1, we can understand that when there are no creatures in the habitat, there is no living thing to immigrate to another habitat and the emigration rate is zero. When the number of creatures increases and habitat becomes populated, large number of creatures can leave their own habitats and seek a new habitat for live and consequently emigration rate increases. The maximum emigration rate occurs when the number of creatures is Smax. In the Fig. 1 the immigration and emigration lines are in form of straight lines but these lines might be more complicated lines.Immigration and emigration rate have a important role in selecting those SIV’s that migration process should be apply on them.
With regard to immigration and emigration diagrams in fig.1, we can extract the following formulas: μ
k= E k
n
……….. (5)
𝜆𝑘 = I (1 - 𝑘
Fig. 1. Full model of BBO
Where μk is emigration rate for k number of creatures and λk is immigration rate for k number of creatures. If, E = 1, with combining of above equations will results
𝜇𝐾 + 𝜆𝐾 = E ……… (7)
The basis of BBO algorithm is based on two main parts: Migration and Mutation.
A. Migration
In BBO algorithm, a population is selected as a solution. This solution can represent as a vector of real numbers that each real number is a SIV in BBO algorithm [10]. The fitness of each solution can be calculated with its objective function. This fitness is the same HSI in BBO algorithm. In BBO solutions with high HSI represents a good solution and solution with low HSI represents a bad solution. The information of habitats probabilistically shares between other habitats using emigration rate and immigration rate of each solution. Each solution can modify on basis of Pmod, modification probability of each solution. In BBO one solution Si is selected for modification and then using immigration rate of that solution, is decided that modification be imposed on which SIV in that solution. Emigration rate of other solution is used for choosing a SIV that, modification will be apply and then a SIV will select randomly to migrate to the solution Si in BBO algorithm an elitism process is included to prevent deterioration of best solution. During the migration, a number of best solutions are transferred to next iteration without migration procedure.
B.Mutation
Sudden changes in climate of one habitat or other incidents will cause the sudden changes in HSI of that habitat[10]. In BBO algorithm, this situation can be model in the form of sudden changes in value of SIV. The probability of any organism can be calculated by the following equation.
PS=
−(𝜆𝑆 − μS)PS μS−1PS−1
− 𝜆𝑆− 𝜇𝑆 𝑃𝑆𝜇𝑆−1𝑃𝑆−1
− 𝜆𝑆− 𝜇𝑆 𝑃𝑆𝜇𝑆−1𝑃𝑆−1
𝜇𝑆+1𝑃𝑆+11≤Pi≤Smax≤-1
………. (8)
Each member of one habitat has its own probability. If this probability is too low, then this solution has high chance to mutate. In the same manner, if probability of a solution is high that solution has a little chance to mutate. Consequently, solutions with high HSI and low HSI have a little chance to development a better SIV in the next iteration. Unlike high HSI and low HSI solutions, medium HSI solutions have a greater chance to development better solutions after mutation procedure.
In the following equation mutation rate of each solution can be calculated.
m (s) = mmax
1−Ps
Pmax ……… ……. (9)
Where,
𝑃max : Largest of all the 𝑃s values
This kind of mutation is inclined to increase diversity between solutions. At this stage, there is also an elitism to prevent the answers from getting worse after mutation procedure. In this case, if a SIV is selected for mutation operation, one authorized random number is substituted.
C. BBO Algorithm Applied To Economic Load Dispatch
The BBO algorithm as applied to ELD problem has been summarized below [8].
Step 1: Initialization of BBO parameters: Choose the number of generators i.e. number of SIVs, number of habitats i.e. population size, power demand, loss coefficients, habitat modification probability 𝑃𝑚𝑜𝑑𝑖𝑓𝑦 = 1, mutation probability = 0.01, maximum mutation rate 𝑚𝑚𝑎𝑥, maximum immigration rate I = 1, maximum emigration rate E = 1, step size for numerical integration dt = 1, elitism parameter = 2.
Step 2: Initialization of SIVs: Each SIV of a habitat is initialized randomly while satisfying the constraints of (3). Each habitat represents a potential solution to the given problem.
Step 3: Calculation of HSIs: HSI for each habitat is calculated for given immigration and emigration rates. HSI represents the fuel cost of the generators.
Step 4: Identification of elite habitats: Based on the HSI values, elite habitats are identified i.e. those habitats for which the fuel cost is minimum, are selected.
Step 5: Performing migration operation: For each of the non-elite habitats, migration operation is performed. HSI for each habitat is recomputed. SIVs obtained after migration must satisfy the constraints of (3).
Step 6: Performing mutation operation: Species count probability of each habitat is updated using (7). Mutation operation is carried out on the non-elite habitats. HSI value of each new habitat set is recomputed.
Step 7: Stopping criterion: Go to step 3 for next iteration. If the predefined number of iterations is reached, stop the process.
V. RESULT AND DISCUSSION
The applicability and validity of the BBO algorithm for practical applications has been tested on 15 unit test case, the cost coefficients and other data for 15 generating units system is shown in Table 1. All the simulations were carried out using MATLAB 9.0.1 on core i3, 2nd generation processor having 2.4 GHz. With 4 GB RAM on 64-bit operating system.
Test case 1. - Population size effect on 15 units system
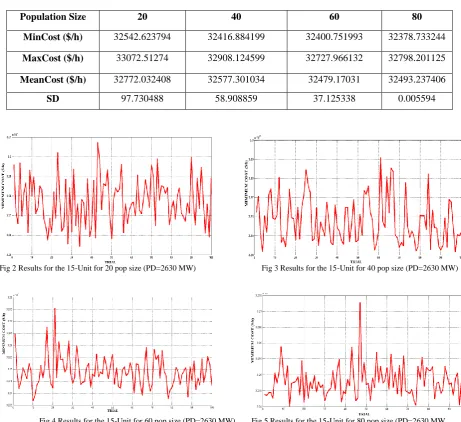
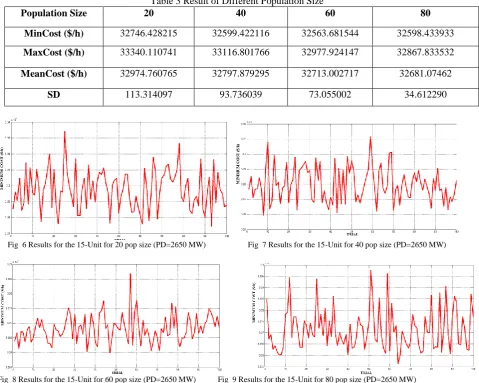
The cost coefficients and other data for 15 generating units system is listed in Table, To find the optimum population size for the ELD problem, many trials were conducted by changing the size of population. The study carried out in this paper found that population size should be optimum for achieving global best results. Too large or a very small population may not be capable of searching a minimum, particularly in complex multimodal problems. The population size is a very important issue in stochastic search methods. Too large a population makes an algorithm slow and computationally inefficient, while a very small population may not be capable of searching a minimum, particularly in complex problems. The optimum population size is found to be related to the problem dimension. Their best results are shown in Table 2 for load 2630 MW and Table 3 for 2650 MW. It can be observed that the population size= 20,40,60 and 80 are show in the figure 2,fig 3,fig 4 and fig 5 for load 2630 and fig 6 fig 7 fig 8 or fig 9 for load 2650,best parameters for this case after 100 Trials, which is very close to global minima. It can be seen that with increase in population, there is a steady improvement in minimum cost maximum cost and mean cost value and S.D.
Table 2 Result of Different Population Size (PD 2630 MW)
Population Size 20 40 60 80
MinCost ($/h) 32542.623794 32416.884199 32400.751993 32378.733244
MaxCost ($/h) 33072.51274 32908.124599 32727.966132 32798.201125
MeanCost ($/h) 32772.032408 32577.301034 32479.17031 32493.237406
SD 97.730488 58.908859 37.125338 0.005594
Fig 2 Results for the 15-Unit for 20 pop size (PD=2630 MW) Fig 3 Results for the 15-Unit for 40 pop size (PD=2630 MW)
Table 3 Result of Different Population Size
Population Size 20 40 60 80
MinCost ($/h) 32746.428215 32599.422116 32563.681544 32598.433933
MaxCost ($/h) 33340.110741 33116.801766 32977.924147 32867.833532
MeanCost ($/h) 32974.760765 32797.879295 32713.002717 32681.07462
SD 113.314097 93.736039 73.055002 34.612290
Fig 6 Results for the 15-Unit for 20 pop size (PD=2650 MW) Fig 7 Results for the 15-Unit for 40 pop size (PD=2650 MW)
Fig 8 Results for the 15-Unit for 60 pop size (PD=2650 MW) Fig 9 Results for the 15-Unit for 80 pop size (PD=2650 MW)
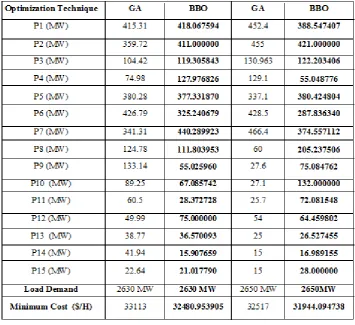
Test case 2 Comparison of Results for 15 unit system
BBO achieved quite effective result. Results obtained from proposed BBO algorithm have been compared with GA [1.The best results of all evolutionary methods are shown in Table 3 and fig 10 and fig 11 shows that the proposed BBO algorithm provided better results compared to other reported evolutionary techniques.
Table 4 Comparison Best power output for 15-generator system for power demand 2630 MW and 2650 MW
VI.CONCLUSION
This paper presents a novel approach towards the BBO which results on the 15 unit generating system demonstrate the feasibility and effectiveness of the proposed method in the minimizing cost of the generation. The results also shows the improvements were made to solve the economic load dispatch problem more efficiently. Finally, it has been demonstrated that the proposed algorithm improves the convergence and performs better when compared with other.
REFERENCES
[1] A. J. Wood and B. F. Wollenberg, Power Generation, Operation, and Control, 2nd ed. New York: Wiley, 1996.
[2]A. Bhattacharya and P. K. Chattopadhyay ―Biogeography-Based Optimization for Different Economic Load Dispatch Problems‖ IEEE Trans. Power Syst., Vol. 25, pp. 1064 –1077, 2010.
[3] R. Storn and K. Price, Differential Evolution—A Simple and Efficient Adaptive Scheme for Global Optimization Over Continuous Spaces,International Computer Science Institute ,Berkeley, CA, 1995, Tech .Rep. TR-95–012.
[4] P. H. Chen and H. C. Chang, ―Large-scale economic dispatch by genetic algorithm,‖ IEEE Trans. Power Syst., vol. 10, no. 4, pp.1919–1926, Nov. 1995.
[5] Kennedy J and Eberhart RC (1995) Particle swarm optimization, In Proceedings of IEEE International Conference on Neural Networks, Perth, Australia, pp. 1942– 1948.
[6] K. M. Passino, ―Biomimicry of bacterial foraging for distributed optimization and control,‖ IEEE Trans. Control Syst., vol. 22, no. 3, pp.52–67, Jun. 2002.
[7] D. Simon, ―Biogeography-based optimization,‖ IEEE Trans. Evol.Comput., vol. 12, no. 6, pp. 702–713, Dec. 2008.
[8] Jyoti Jain and Rameshwar Singh, Biogeography-Based Optimization Algorithm for Load Dispatch in Power System in International Journal of Emerging Technology & Advanced Engineering (ISSN 2250-2459, ISO 9001:2008 Certified Journal), Volume 3, Issue 7, July 2013.
[9] Mimoun YOUNES, Farid BENHAMIDA, Genetic Algorithm-Particle Swarm Optimization (GA-PSO) for Economic Load Dispatch.
[10] K. T. Chaturvedi, M. Pandit, and L. Srivastava, ―Selforganizing hierarchical particle swarm Optimization fornonconvex economic dispatch,‖ IEEE Trans. Power Syst., vol. 23, no. 3, p. 1079, Aug. 2008.
![Table 1 cost coefficients data [11]](https://thumb-us.123doks.com/thumbv2/123dok_us/7787660.1289012/4.595.141.457.540.765/table-cost-coefficients-data.webp)