Study of the photon strength functions and level density in
the gamma decay of the n +
234U reaction
J. Moreno-Soto1,∗, E. Berthoumieux1, E. Dupont1, F. Gunsing1, O. Serot2, O. Litaize2, M. Diakaki2, A. Chebboubi2, W. Dridi3, S. Valenta33, M. Krtiˇcka33, O. Aberle4, V. Alcayne5, J. Andrzejewski6, L. Audouin7, V. Bécares5, V. Babiano-Suarez8, M. Bacak4,9,1, M. Barbagallo4,10, Th. Benedikt11, S. Bennett12, J. Billowes12, D. Bosnar13, A. Brown14, M. Busso10,15,16, M. Caamaño17, L. Caballero-Ontanaya8, F. Calviño18, M. Calviani4, D. Cano-Ott5, A. Casanovas18, F. Cerutti4, E. Chiaveri4,12, N. Colonna10, G. Cortés18, M. A. Cortés-Giraldo19, L. Cosentino20, S. Cristallo10,15,21, L. A. Damone10,22, P. J. Davies12, M. Dietz23, C. Domingo-Pardo8, R. Dressler24, Q. Ducasse25, I. Durán17, Z. Eleme26, B. Fernández-Domínguez17, A. Ferrari4, P. Finocchiaro20, V. Furman27, K. Göbel11, A. Gawlik6, S. Gilardoni4, I. F. Gonçalves28, E. González-Romero5, C. Guerrero19, S. Heinitz24, J. Heyse29, D. G. Jenkins14, A. Junghans30, F. Käppeler31, Y. Kadi4, A. Kimura32, I. Knapova33, M. Kokkoris34, Y. Kopatch27, D. Kurtulgil11, I. Ladarescu8, C. Lederer-Woods23, S. J. Lonsdale23, D. Macina4, A. Manna35,36, T. Martínez5, A. Masi4, C. Massimi35,36, P. Mastinu37, M. Mastromarco4, E. A. Maugeri24, A. Mazzone10,38, E. Mendoza5, A. Mengoni39, V. Michalopoulou4,34, P. M. Milazzo40, F. Mingrone4, A. Musumarra20,41, A. Negret42, F. Ogállar43, A. Oprea42, N. Patronis26, A. Pavlik44, J. Perkowski6, L. Persanti10,15,21, C. Petrone42, E. Pirovano25, I. Porras43, J. Praena43, J. M. Quesada19, D. Ramos-Doval7, T. Rauscher45,46, R. Reifarth11, D. Rochman24, M. Sabaté-Gilarte19,4, A. Saxena47, P. Schillebeeckx29, D. Schumann24, A. Sekhar12, S. Simone20, A. G. Smith12, N. V. Sosnin12, P. Sprung24, A. Stamatopoulos34, G. Tagliente10, J. L. Tain8, A. Tarifeño-Saldivia18, L. Tassan-Got4,34,7, A. Tsinganis4, J. Ulrich24, S. Urlass30,4, G. Vannini35,36, V. Variale10, P. Vaz28, A. Ventura35, D. Vescovi10,15, V. Vlachoudis4, R. Vlastou34, A. Wallner48, P. J. Woods23, T. Wright12, P. Žugec13, and the n_TOF Collaboration
1CEA Irfu, Université Paris-Saclay, F-91191 Gif-sur-Yvette, France
2CEA, DEN, DER, SPRC, Cadarache, F-13108 Saint-Paul-lez-Durance, France
3Laboratory on Energy and Matter for Nuclear Sciences Development (LR16CNSTN02), Technopark
Sidi Thabet, 2020 Ariana, Tunisia
4European Organization for Nuclear Research (CERN), Switzerland
5Centro de Investigaciones Energéticas Medioambientales y Tecnológicas (CIEMAT), Spain
6University of Lodz, Poland
7Institut de Physique Nucléaire, CNRS-IN2P3, Univ. Paris-Sud, Université Paris-Saclay, F-91406
Or-say Cedex, France
8Instituto de Física Corpuscular, CSIC - Universidad de Valencia, Spain
9Technische Universität Wien, Austria
10Istituto Nazionale di Fisica Nucleare, Sezione di Bari, Italy
11Goethe University Frankfurt, Germany
12University of Manchester, United Kingdom
13Department of Physics, Faculty of Science, University of Zagreb, Zagreb, Croatia
14University of York, United Kingdom
15Istituto Nazionale di Fisica Nucleare, Sezione di Perugia, Italy
16Dipartimento di Fisica e Geologia, Università di Perugia, Italy
17University of Santiago de Compostela, Spain
18Universitat Politècnica de Catalunya, Spain
19Universidad de Sevilla, Spain
20INFN Laboratori Nazionali del Sud, Catania, Italy
21Istituto Nazionale di Astrofisica - Osservatorio Astronomico di Teramo, Italy
22Dipartimento di Fisica, Università degli Studi di Bari, Italy
23School of Physics and Astronomy, University of Edinburgh, United Kingdom
24Paul Scherrer Institut (PSI), Villingen, Switzerland
25Physikalisch-Technische Bundesanstalt (PTB), Bundesallee 100, 38116 Braunschweig, Germany
26University of Ioannina, Greece
27Joint Institute for Nuclear Research (JINR), Dubna, Russia
28Instituto Superior Técnico, Lisbon, Portugal
29European Commission, Joint Research Centre, Geel, Retieseweg 111, B-2440 Geel, Belgium
30Helmholtz-Zentrum Dresden-Rossendorf, Germany
31Karlsruhe Institute of Technology, Campus North, IKP, 76021 Karlsruhe, Germany
32Japan Atomic Energy Agency (JAEA), Tokai-mura, Japan
33Charles University, Prague, Czech Republic
34National Technical University of Athens, Greece
35Istituto Nazionale di Fisica Nucleare, Sezione di Bologna, Italy
36Dipartimento di Fisica e Astronomia, Università di Bologna, Italy
37Istituto Nazionale di Fisica Nucleare, Sezione di Legnaro, Italy
38Consiglio Nazionale delle Ricerche, Bari, Italy
39Agenzia nazionale per le nuove tecnologie (ENEA), Bologna, Italy
40Istituto Nazionale di Fisica Nucleare, Sezione di Trieste, Italy
41Dipartimento di Fisica e Astronomia, Università di Catania, Italy
42Horia Hulubei National Institute of Physics and Nuclear Engineering, Romania
43University of Granada, Spain
44University of Vienna, Faculty of Physics, Vienna, Austria
45Department of Physics, University of Basel, Switzerland
46Centre for Astrophysics Research, University of Hertfordshire, United Kingdom
47Bhabha Atomic Research Centre (BARC), India
48Australian National University, Canberra, Australia
Abstract.The accurate calculations of neutron-induced reaction cross sections are relevant for many nuclear applications. The photon strength functions and nuclear level densities are essential inputs for such calculations. These quan-tities for235U are studied using the measurement of the gamma de-excitation
cascades in radiative capture on234U with the Total Absorption Calorimeter at
n_TOF at CERN. This segmented 4πgamma calorimeter is designed to detect gamma rays emitted from the nucleus with high efficiency. This experiment provides information on gamma multiplicity and gamma spectra that can be compared with numerical simulations. The codediceboxcis used to simulate
the gamma cascades whilegeant4 is used for the simulation of the interaction
1 Introduction
The aim of this work is to describe theγ-decay of excited nucleus following neutron capture. At low excitation energy, the number of levels per unit energy is rather small and levels can be experimentally resolved. However, as the excitation energy increases the level density is also increasing, so the statistical model is needed to describe the levels and transitions be-tween them – the used quantities are nuclear level density (LD) and photon strength functions (PSFs). Their improved experimental and theoretical description is important for modeling of radiative capture reactions in nuclear astrophysics and nuclear technologies since the neutron capture cross sections above the resolved resonance region are usually calculated using the statistical model of Hauser-Feshbach [1] for which PSFs and LDs are essential inputs.
In this work, the Total Absorption Calorimeter (TAC) at n_TOF facility (CERN) [2–4] was used to measure234U(n,γ) reaction [5]. The TAC is a 4πdetector segmented in 40 BaF
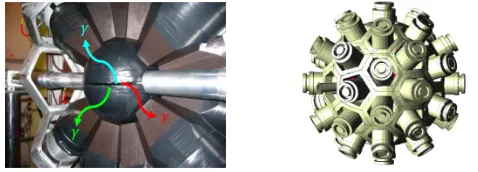
2 crystals with a very high efficiency (almost 100%) to detect the γ rays from the capture cascades. In Fig. 1 (left) one hemisphere of the TAC is shown. The234U sample is placed in the center and emits γrays, which are detected by the BaF2 detectors. Thanks to the segmentation of the detector it is possible to discriminate against the background by putting conditions on the multiplicity and the total deposited energy of events registered by the TAC.
Figure 1. One hemisphere of the TAC consisting of the BaF2detectors, the neutron beam tube and
the neutron absorber. A cascade event of threeγrays is depicted. If allγrays are detected the crystal multiplicity ismcr=3 (left). The geometry of the full TAC as implemented in GEANT4 (right).
2 Experimental data
In a radiative capture reaction the compound nucleus decays through a cascade ofγrays. The measured cascade events are reconstructed by takingγrays detected by the TAC in the BaF2 detectors in a time coincidence window of 20 ns. A software threshold of 75 keV was set for all BaF2detectors to suppress the low energy background. The observables used for the analysis are:
• The neutron energy,En, calculated from the measured time of flight.
• The crystal multiplicity,mcr, given by the number of hit crystals in each detected cascade
event.
• The total deposited energy or sum energyEsumin the detectors for each cascade event.
• The multi-step cascade spectra for each crystal multiplicitymcr, which are theγ-ray energy
spectra for fully detected cascades.
1 10 2
10 3
10 4
10 5
10
Neutron energy (eV)
6 10
Counts
Ti Without conditions
0 1000 2000 3000 4000 5000 6000
Sum energy (keV)
0 10 20 30 40 50 60 70 80 90 100 3 10 × Counts
= 5.16 eV
r Er E cr All m 2 ≥ cr m 3 ≥ cr m 4 ≥ cr m
Figure 2.Time-of-flight spectrum converted to neutron energy (left). Total energy deposited for differ-ent sets of crystal multiplicities for234U(n,γ) in the resonance at 5.16 eV (right).
Fig. 2 (right) shows the sum-energy spectra in the resonance at 5.16 eV, corrected for
background, for different multiplicity criteria [7]. All spectra clearly show the sum-peak
at 5.3 MeV corresponding to theQvalue of the reaction. There are differences between the
spectra depending on the considered multiplicities. At low sum-energies (below 1 MeV) the
spectrum for allmcr is dominated by the remaining background. However, in the spectra
formcr ≥2 this background is completely absent. For the present study, only cascades with
mcr ≥2 are considered to ensure that the background is correctly subtracted, furthermore
the multistep cascade spectra are constructed using only the events with sum-energy in the
interval 4.8<Esum(MeV)<6.0.
0 1000 2000 3000 4000 5000 6000
Sum energy (keV)
0 100 200 3 − 10 × Normalized counts
= 5.16 eV
r
E = 31.13 eV
r
E = 48.56 eV
r
E = 94.29 eV
r
E
cr
All m
0 1000 2000 3000 4000 5000 6000
Sum energy (keV)
0 10 20 30 40 50 60 3 − 10 × Normalized counts = 3 cr m
0 1000 2000 3000 4000 5000
Gamma energy (keV)
0 2 4 6 8 10 12 14 3 − 10 × Normalized counts
(MeV) < 6
sum
4.8 < E
= 2
cr
m
0 1000 2000 3000 4000 5000
Gamma energy (keV)
0 10 20 30 40 50 3 − 10 × Normalized counts
(MeV) < 6
sum
4.8 < E = 3
cr
m
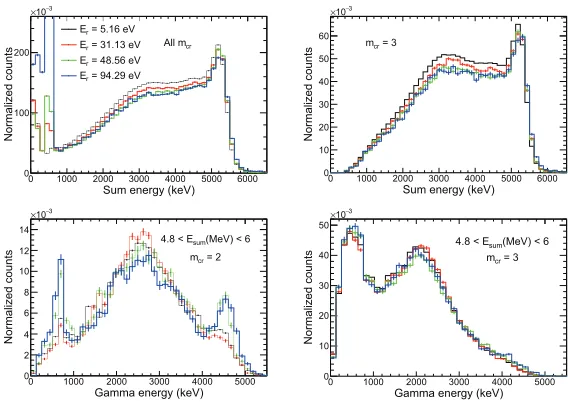
Figure 3. Sum-energy spectra of different resonances for allmcrandmcr =3 (top). Multi-stepγ-ray energy spectra of different resonances formcr=2,3 (bottom). The statistical uncertainties are small.
As can be seen in Fig. 3 (top), the sum-energy spectra for allmcrof four s-wave resonances
show significant differences at low energy only. These differences are due to the fact that the
subtraction of the background is approximative – the remaining background induced by the
larger scattering width. However, these differences do not appear formcr ≥ 3 because of
the low multiplicity nature of the background. More importantly, the background subtraction gets more accurate with increasing sum-energy, hence all sum-energy spectra have similar behavior forEsum>1 MeV.
The multi-stepγ-ray energy spectra, see Fig. 3 (bottom), show similar responses for the different resonances formcr≥3. The spectra formcr=2 show significant differences
depend-ing on the considered resonance. These differences can be attributed to the Porter-Thomas fluctuations of primary transition intensities among the resonances, as expected the effects are mostly noticeable at the edges of themcr=2 multi-stepγ-ray energy spectra.
The normalization of all spectra was done by dividing the spectra by the number of counts in the sum-energy spectrum of mcr ≥ 2 between Esum = 4.8 MeV and 6 MeV. The same
normalization was applied to the simulations.
3 Simulations
The results presented in this work are based on the comparison of experimental data with statistical model simulations ofγdecay. The in-house developed Monte Carlo codediceboxc, based on the same algorithm used by F. Beˇcváˇr [8] in his codedicebox, was used to simulate the gamma cascades whilegeant4 was used for the simulation of the interaction of these gammas with the complete TAC experimental assembly [2].
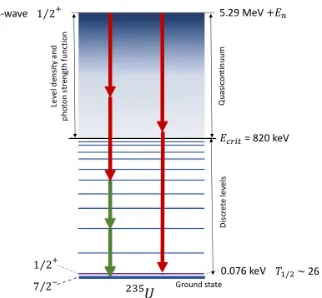
Figure 4. Schema of Monte Carlo cascades generation withdiceboxccode. Red arrows depict the
transitions generated in terms of LD and PSFs, green arows are the transitions among discrete levels taken from spectroscopic data.
diceboxcsimulates sets of levels and their partial radiation widths known as nuclear real-izations [8]. To describe the decay scheme, below a critical energyEcritall the level energies,
spins, parities and branching intensities of depopulating transitions are taken from existing experimental data. Above Ecrit, the level scheme is generated by the code – the levels are
obtained by a random discretization of an a priori known LD formula. Further, the PSFs are used to generate probabilities of transitions of typeX(electric or magnetic) and multipolarity
L. Fig. 4 shows a diagram of the operation ofdiceboxc.
The partial radiation width of an electromagnetic transition from levelito levelf,Γiγf, is
selected from a Porter-Thomas distribution with the mean valueΓXLiγfdefined as
ΓXL iγf
= f
XL(E
γ)·E2γL+1 ρ(Ei,Ji, πi)
whereρis the LD and fXL(E
γ) is the PSF. Theγ-ray transition probabilities are corrected for internal conversion using tables from Ref. [9]. The levels and transitions belowEcritare
taken from ENSDF database [10]. To ensure satisfactory statistics concerning the modelled quantities, 20 nuclear realizations with 105γ-cascades per realization were simulated for each combination of LD and PSFs models.
To simulate the transport and detection ofγ-rays, the toolkitgeant4 is used [11]. The ge-ometry and efficiency of TAC have been accurately modeled following CAD drawings of the engineering design and direct measurements [2, 12]. The modeled geometry is shown in the right panel of Fig. 1. Finally, an amplitude resolution of about 13-17%, depending on the detector, and a threshold of 75 keV for all crystals is assumed.
3.1 Level density models
The LD for given spin and parity is calculated as the product of three factors: the parity distributionP(E, π), the spin distributionR(E,J) and the LDρ(E). In this work, one assumes that both parities are equally probableP(E, π)=1/2 at allE, whileR(E,J) is
R(E,J)=exp
−2σJ22
c
−exp
−(J2σ+1)2 2
c
≈22σJ+21
c
exp ⎡ ⎢⎢⎢⎢⎢ ⎢⎢⎢⎣− J+
1 2
2
2σ2
c
⎤ ⎥⎥⎥⎥⎥
⎥⎥⎥⎦, (2)
whereσcis the spin cut-offfactor. Different forms of spin cut-offfactor could be used.
Thediceboxccode includes various models for the LDρ(E). The Constant Temperature (CT) [13] model assumes that the number of levels varies according to the constant tempera-ture law and LD is given by
ρ(E)= 1
T exp
E−E
0
T
, (3)
with parameters E0 and a nuclear temperature T, which are usually fitted to experimental discrete levels, taken from Ref. [14]. In this work the spin cut-offparameter, which is constant for a given nucleus [15], was used.
The Back-shifted Fermi Gas (BSFG) [16] model assumes the nucleus as a gas of fermions creating pairs and single particle levels are equally spaced and non-degenerated with a LD given by
ρ(E)= exp 2 √
a(E−E1)
12√2σca1/4(E−E1)5/4
, (4)
whereE1 is the energy backshift and a is the LD parameter. The energy-dependent spin cut-off factor for the BSFG model was taken from Ref. [15]. The parameters for BSFG model were taken from Ref. [14]. Variations of the BSFG model have been developed, as for example in ref. [17], which incorporates the thermodynamic temperaturet. In this case, the spin cut-offis related to a fraction of the moment of inertia of the nucleus that is usually taken between 0.5 and 1. In addition, a BSFG model with energy-dependent LD parameter
a and spin cut-off which accounts for the damping of the shell effects was introduced in RIPL-3 [18]. Finally, we used microscopic LD in the form of numerical interpolation tables calculated with the Hartree-Fock-Bogoliubov (HFB) method [19, 20].
3.2 Photon strength function
resonance (GDER). The shape of theE1 PSF for deformed nucleus is usually described by a sum of two standard Lorentzians [18, 21], as a consequence of vibration modes along and perpendicular to the symmetry axis. This description is known as Standard Lorentzian model (SLO):
fS LOE1 (Eγ)= 1 3(πc)2
2
i=1
σGiEγΓ 2
Gi
E2 γ−E2Gi
2 +E2
γΓ2Gi
, (5)
where the parametersEGi,ΓGiandσGi are the energy, width and cross section of the GDER. Different variations were proposed to better describe the energy region below neutron separation energy. The model by Kadmenskii, Markushev and Furman (KMF) [22] aims only at this energy region while generalised Lorentzian models by Kopecky, Uhl and Chrien (GLO, ELO, EGLO) [23] and other models and calculations attempt to describe theE1 PSF in the whole energy region.
The KMF, GLO and ELO models use the damping widthΓT(Eγ,Tf) which depends on
Eγand the nuclear temperatureTf in form
ΓT(Eγ,Tf)= ΓG
E2
G
(E2
γ+4π2T2f). (6)
Phenomenological modifications of this damping width in which is introduced ak param-eter were proposed in the EGLO [23] and the MGLO [24] models. There are other models forE1 PSF, we refer the reader to the overview in RIPL-3 [18].
For the decay of levels below the neutron separation energy,M1 transitions play an impor-tant role. In this work theM1 PSF consists of the spin-flip (SF) resonance, which dominates the M1 PSF at relatively high energy typically around 7 MeV, and the scissor mode (SC), a concentration of M1 strength around 2-3 MeV in deformed nuclei. The SLO model was adopted to describe theM1 PSF. For further details see review [25] and references therein.
The electric quadrupole (E2) transitions, although playing a minor role with respect to dipole transitions, are also taken into account. The SLO model with a single Lorentzian was used to describe theE2 PSF as recommended in [18].
4 Comparison of simulations and measurements
Various combinations of LD and PSF models were checked and compared with the exper-imental data introduced in Sec. 2. The parameters were taken from RIPL-3 database [18] in which only one SLO term for theM1 PSF is recommended, or from original works, (i) the analysis of d- and3He-induced reactions on actinide targets performed at the Oslo Cy-clotron Laboratory (OCL) [26] and (ii) the measurement of multi-stepγ-ray energy spectra from resonant neutron capture on uranium samples with DANCE calorimeter [27]. In both a sum of SLO terms was adopted to describe the M1 PSF – one for the SF and two for the SC. TheE2 transitions were included in the simulations by taking the parameters from [28]. The parameters use for the PSF in the different simulations are collected in Table. 1.
From theE1 PSF models introduced in Sec. 3.2 the SLO and KMF models do not repro-duce the experimental data in combination with any LD model independently on the chosen parametrisation of theM1 PSF. Conversely, the ELO, GLO, EGLO and MGLOE1 PSF mod-els, paired with a suitable LD model, allow, by tuning the parameters of theM1 PSF and the
kparameter, a satisfactory description of the experimental data.
analysis [27] and (iii) the analysis of d- and3He-induced reactions at OCL [26]. The
stan-dard deviation due to different nuclear realizations is only calculated in the simulation for
RIPL-3, for the other simulations the standard deviation shows similar behaviour and is not displayed for a better visualization. The statistical uncertainties are much smaller than the standard deviation. Overall, the introduction of the SC is mandatory for the improvement of the simulation and the increase of the SC strength in the DANCE analysis with respect to OCL improves the description of the experimental data. It may be possible that in order to match experimental data the SC strength has to be further increased and used in conjunction
with steeperE1 PSF of generalised Lorentzian type.
0 1000 2000 3000 4000 5000 6000
Sum energy (keV)
0 0.1 0.2
Normalized counts
MC sim. RIPL-3 MC sim. [26] MC sim. [27] = 5.16 eV
r E 2 ≥ cr m
1 2 3 4 5 6 7 8
Multiplicity 0 0.1 0.2 0.3 Normalized counts
(MeV) < 6
sum
4.8 < E
0 1000 2000 3000 4000 5000 6000
Sum energy (keV)
0 5 10 15 20 25 30 35 40 3 − 10 × Normalized counts = 2 cr m
0 1000 2000 3000 4000 5000
Gamma energy (keV)
0 2 4 6 8 10 12 14 3 − 10 × Normalized counts
(MeV) < 6
sum
4.8 < E = 2
cr
m
0 1000 2000 3000 4000 5000 6000
Sum energy (keV)
0 10 20 30 40 50 60 3 − 10 × Normalized counts = 3 cr m
0 1000 2000 3000 4000 5000
Gamma energy (keV)
0 10 20 30 40 50 3 − 10 × Normalized counts
(MeV) < 6
sum
4.8 < E = 3
cr
m
Figure 5. Comparison of experimental data to simulations using the LD and PSF models as recom-mended in RIPL-3 database [18] (grey filled), and as published in Refs. [26] (red line) and [27] (green line). The left column shows the total deposited energy spectra while on the right the multiplicity distri-bution and multi-stepγ-ray energy spectra are shown. The resonance energy as well as the multiplicity and sum-energy conditions are specified in the figures.
5 Conclusion
The Total Absorption Calorimeter at the n_TOF facility (CERN) was used to measure the
γ-ray cascades following the neutron capture in 234U. Simulations of γ decay performed
withdiceboxcfor various LD and PSFs combinations were compared with the experimental
data. The inadequacy of the SLO and KMF models ofE1 PSF as well as the necessity of
scissors mode contribution toM1 PSF was shown. The simulations with model combinations
with a detailed parameter search for analytical models and the use of tabulated PSFs from QRPA calculations [29], as well as the extension to other actinides.
Table 1.Parameters from RIPL-3 [18], OCL [26] and DANCE [27] for the PSFs.
Transition E1(MeV) Γ1(MeV) σ1(mb) E2(MeV) Γ2(MeV) σ2(mb) E3(MeV) Γ3(MeV) σ3(mb)
E1 [18] 11.11 1.12 243.3 13.41 4.98 426 – – –
M1 [18] – – – – – – 6.61 4.00 2.35
E2 [28] 10.21 1.18 1.7 – – – – – –
E1 [26] 11.40 4.20 572 14.40 4.20 1040 7.30 2.0 15.0 M1 [26] 2.15 0.80 0.45 2.90 0.60 0.40 6.61 4.00 7.00
E2 [28] 10.21 1.18 1.7 – – – – – –
E1 [27] 11.28 2.48 325 13.73 4.25 384
M1 [27] 2.15 0.80 0.60 2.90 0.60 0.53 6.61 4.00 1.50
E2 [28] 10.21 1.18 1.7 – – – – – –
References
[1] W. Hauser, H. Feshbach, Phys. Rev.87, 366 (1952)
[2] C. Guerrero et al. (n_TOF), Nucl. Instrum. Meth. A608, 424 (2009) [3] E. Chiaveri et al. (n_TOF), Nucl. Data Sheets119, 1 (2014)
[4] C. Guerrero et al. (n_TOF), Eur. Phys. J. A49, 27 (2013) [5] W. Dridi,PhD thesis(Université d’Evry Val d’Essonne, 2006)
[6] C. Lampoudis et al. (n_TOF), inProceedings of the 2007 International Conference on
Nuclear Data for Science and Technology(2008), Vol. 1, pp. 595–598
[7] W. Dridi et al. (n_TOF), inConference Proceedings of the American Nuclear Society’s
Topical Meeting on Reactor Physics(2006), Vol. C032, pp. 1–10
[8] F. Beˇcváˇr, Nucl. Instrum. Meth. A417, 434 (1998) [9] R.S. Hager, E.C. Seltzer, Nucl. DataA4, 1 (1968) [10] E. Browne, J. Tuli, Nucl. Data Sheets122, 205 (2014)
[11] S. Agostinelli et al. (GEANT4), Nucl. Instrum. Meth. A506, 250 (2003) [12] C. Guerrero et al. (n_TOF), Nucl. Instrum. Meth. A671, 108 (2012) [13] A. Gilbert, A.G.W. Cameron, Can. J. Phys.43, 1446 (1965)
[14] T. von Egidy, D. Bucurescu, Phys. Rev. C72, 044311 (2005)
[15] T. von Egidy, H.H. Schmidt, A.N. Behkami, Nucl. Phys. A481, 189 (1988) [16] H.A. Bethe, Phys. Rev.50, 332 (1936)
[17] W. Dilg, W. Schantl, H. Vonach, M. Uhl, Nucl. Phys. A217, 269 (1973) [18] R. Capote et al., Nucl. Data Sheets110, 3107 (2009)
[19] S. Goriely, S. Hilaire, A.J. Koning, Phys. Rev. C78, 064307 (2008) [20] A.J. Koning, S. Hilaire, S. Goriely, Nucl. Phys. A810, 13 (2008) [21] G.A. Bartholomew, Annual Review of Nuclear Science11, 259 (1961)
[22] S.G. Kadmenskii, V.P. Markushev, V.I. Furman, Sov. J. Nucl. Phys.37, 165 (1983) [23] J. Kopecky, M. Uhl, R.E. Chrien, Phys. Rev. C47, 312 (1993)
[24] J. Kroll et al., Phys. Rev. C88, 034317 (2013)
[25] K. Heyde, P. von Neumann-Cosel, A. Richter, Rev. Mod. Phys.82, 2365 (2010) [26] M. Guttormsen et al., Phys. Rev. C89, 014302 (2014)
[27] J.L. Ullmann et al., Phys. Rev. C96, 024627 (2017)
[28] Handbook for Calculations of Nuclear Reaction Data Reference Input Parameter
Li-brary, IAEA-TECDOC-1034 (Vienna, 1998)
![Figure 5. Comparison of experimental data to simulations using the LD and PSF models as recom-mended in RIPL-3 database [18] (grey filled), and as published in Refs](https://thumb-us.123doks.com/thumbv2/123dok_us/8006128.1330348/8.482.91.378.186.484/figure-comparison-experimental-simulations-mended-database-lled-published.webp)
![Table 1. Parameters from RIPL-3 [18], OCL [26] and DANCE [27] for the PSFs.](https://thumb-us.123doks.com/thumbv2/123dok_us/8006128.1330348/9.482.66.417.113.211/table-parameters-ripl-ocl-dance-psfs.webp)
