ANALYSIS OF AERODYNAMIC PERFORMANCE OF
NREL S833 USING CFD SIMULATION
Satyam Shukla
1, Mrs. Swati D. Chaugaonkar
21
M.E. student S.G.S.I.T.S, Indore (India)
2
Asst.Prof. Department of Mechanical Engineering S.G.S.I.T.S Indore (India)
ABSTRACT
Today energy is a key input in the economic growth and development of human as well as world. The growth of
the nation is directly link with availability of the energy sources, which can be renewable and non-renewable
sources of energy. Among all the sources of renewable energy, wind power is the most important source. Device
that utilizes the kinetic energy of wind to convert it into mechanical energy to generate electricity or power is
called wind turbine. The cross section of the turbine blades is defined as Airfoil. In this paper, briefly
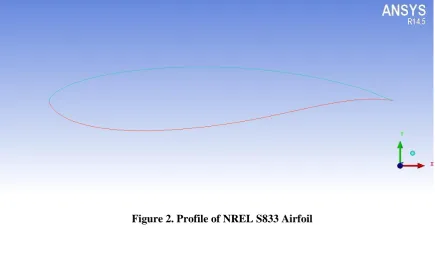
explanation of aerodynamic behaviour of an airfoil is analysed. Here NREL S833 airfoil is selected for CFD
analysis, which is suitable for low Reynolds number as well as small diameter of Horizontal Axis Wind Turbine.
Parameter such as Lift and Drag co-efficient, which influences the aerodynamic behaviour of an airfoil, is
analyses at different Angle of attacks. The analysis is carried out in the ANSYS Fluent 14.5 whereas for
modelling ICEM CFD is used.
Key Words:
Airfoil, Angle of Attacks, CFD, Drag and Lift coefficient, NREL (National Renewable
Energy Laboratory) .
I. INTRODUCTION
Energy is defined as the property of any objects, which can be transferred to other objects or may be
converted into different forms. Resources of energy may be Renewable and Renewable type.
Non-Renewable energy resources are those natural resources, which are exhaustible in nature and cannot be replaced
once they used. Non-Renewable resources of energy are available in limited amount on earth and take long
times may be ten to thousands of year for developing it again. Fossil fuel such as coal, oil, natural gas and
nuclear power are includes in this category. Renewable energy resources are those natural resources of energy
which inexhaustible in nature and can be used to produced energy repeatedly. These resources are available in
unlimited amount on earth and develop in very short time. Solar, Wind, Water, Geothermal, ocean, biomass and
tides are the example of renewable energy resources. As compare to non renewable source of energy only 21.7%
of electricity generation is produced by renewable sources of energy worldwide as of 2013.
In the next 100 years, the world is going to be in the energy crisis due to the limited supply of the
Non-renewable energy resources such as fossil. According to The Klass model assumes a continuous compound rate
and it is a computational approximation Depletion times for oil, coal and natural gas are approximately 35, 107,
and 37 years respectively[1]. With an ever-increasing energy crisis in few years, it will be important to found
wind is the biggest source of energy because it is all around us all of the time. Wind energy is described as the
energy generates the mechanical energy/ power from kinetic energy of wind by utilization of the airflow motion.
This mechanical power is used to perform many special tasks (such as grinding grain or pumping water) or
driving the rotor/ generator whose function is to convert the mechanical energy into the electricity, which is
used in power grid or by individuals. The device that converts kinetic energy into mechanical energy than
electricity is known as Wind turbine. Wind turbine is the combination of different components with function to
generate electricity. The function of the rotor is rotate at predefined speed as wind speed, so that the generator
produces electric energy output under the control system regulations. In order to maximise extraction from wind
energy researcher give more attention on effective geometry and design of wind turbine blades. In the starting
stage, helicopters airfoils are used in the wind turbine blades but continuous research on airfoil development
gives special purpose airfoils, which are specially suited for wind turbines. The cross section of a designed
structure with curved surfaces aiming to give most favourable ratio of lift to drag in wings of flight, blades of
wind turbine or in sail, is airfoil. Airfoil is the geometry whose aims to provide a smooth and uniform flow of
fluid over the geometry and reduces the Drag. An airfoil shaped structure or body moved through a fluid
produces an aerodynamic forces. Design of airfoil is major facet of aerodynamics.
There are various term, to define a airfoil such that
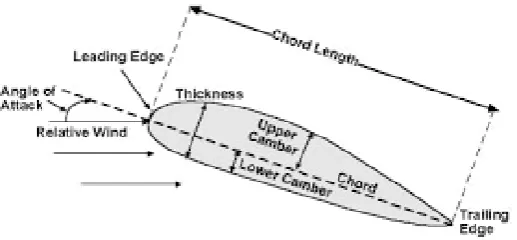
Figure 1. Airfoil Terminology
Surface, which generally, experiences the higher velocity and lower static pressure, is known as Upper Surface
or the Suction Surface. The surface, which has a comparatively lower velocity and higher static pressure than
upper surface, is called Lower or the Pressure Surface. Leading Edge is the point at front of the airfoils having
maximum curvature or minimum radius. Trailing Edget is similar to the Leading edge but the location of that
point at rear of the airfoil. the straight line joining by Leading and Trailing edge is known as chord length or
chord 'c'. Chord is taken as the reference dimension of airfoil section. The locus of point's midway between the
upper and lower surface is termed as Camber line or Mean line of the airfoil. The shape of Camber line is
depends on the thickness of the airfoil. The angle between the chord and flow of fluid (Air) is termed as Angle
of Attack [2, 3].
In general, when airfoil moved through in fluid media experiences two forces and one moment; these being Lift
and Drag forces and pitching moment. Lift force is defined as force act on the perpendicular direction of
generated as consequences of uneven pressure distribution on upper and lower surfaces of a airfoil. It is
generally a lower pressure in upper surface and higher pressure on lower surface. Drag force, act in the direction
of parallel to the oncoming airflow. Drag force is a consequence of both viscous forces at the surface of the
airfoil and the unequal pressure on airfoil surfaces facing towards and away from the airflow motion. The
coefficient of these forces is termed as Lift coefficient and Drag coefficient, and it is defined as CL and CD,
,
Where is the density of air and c is the chord length or length of airfoil, here unit of lift and drag force is N/m
[3,4].
Fluid Dynamics have a sub-branch named Computational Fluid Dynamics that uses the numerical methods and
algorithms to solve and analyze problems of fluid flows, using CFD method aerodynamics characteristics of
wind turbine blades are analyzed. Meanwhile Finite element method (FEM) is used to structural analysis of
wind turbine structure and blades. On comparing the traditional theoretical and Experimental methods,
numerical analysis method give best results and save money as well as time for analysis and optimum design of
turbine blades. To analzy the problem CFD simulation uses different types of turbulent model according to flow
of fluid.the turbulent model such as Standard ϵ model, Realizable ϵ model, Shear-Stress Transport(SST)
K-ω model and Reynolds stress model [5].
II. METHODOLOGY
Airfoil is model in the ICEM CFD with unstructured meshing within analysis domain.
Figure 3. unstructured meshing on Airfoil
After modelling airfoil model is imported into ANSYS FLUENT 14.5 for analysis, here far field boundary
condition is uses with SST K-ω turbulent model. A constant Reynolds number 5×10⁵ with mach number 0.07 is used for analysis at different angles of attacks for calculate the Lift and Drag Coefficient at that angles.
III. RESULTS AND DISCUSSION
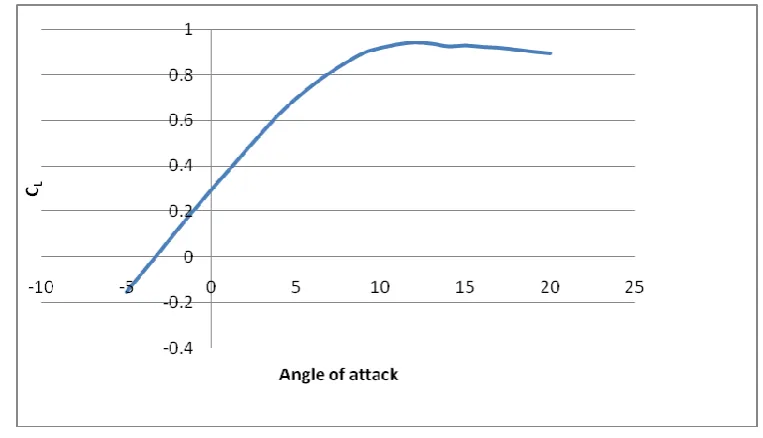
"Fig.4" shows the variation of lift coefficient with different angles of attack of air on airfoil. Initially from -5° to
12°, the value of the lift coefficient gradually increases after that the coefficient values starts continuous
decreasing on increasing the angle of attacks. Similarly "Fig. 5" shows, drag coefficient variation with angle of
attack. Here initially the coefficient of drag is decrease until 2° of angle and after that, it starts continuous
increasing in nature.
Figure 5. Drag coefficient vs. Angle of Attack
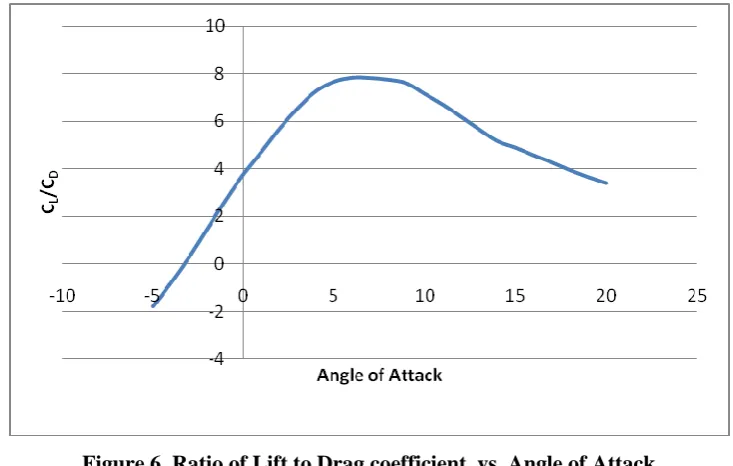
"Fig. 6" represents the relation between, ratio of lift to drag coefficient and angles of attacks. Higher value of
lift to drag coefficient ratio with angle of attack, then that angle is optimum angle of attacks for that Airfoil.
Here ratio starts from -5° and continuous increases until 6° after that the value of lift to drag coefficient ratio is
decreases.
Figure 6. Ratio of Lift to Drag coefficient vs. Angle of Attack
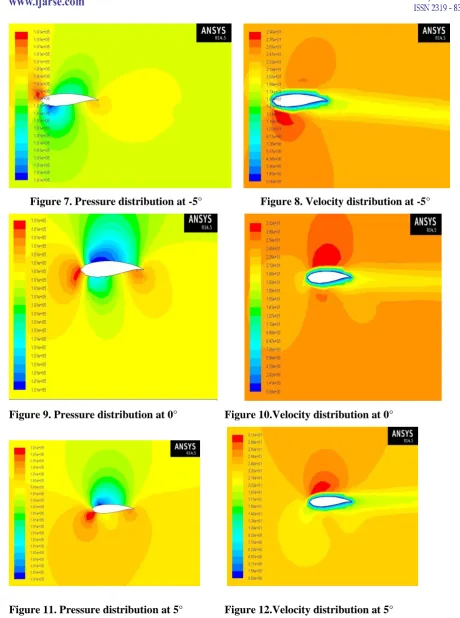
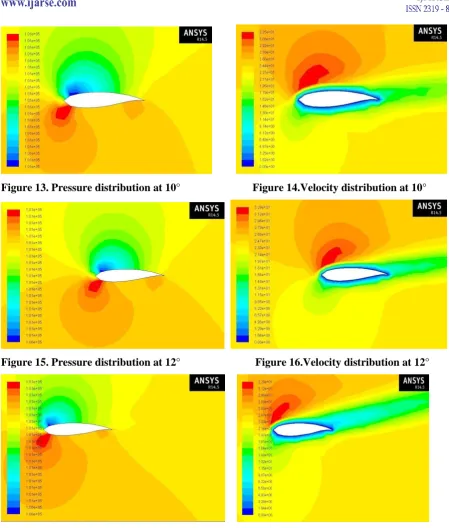
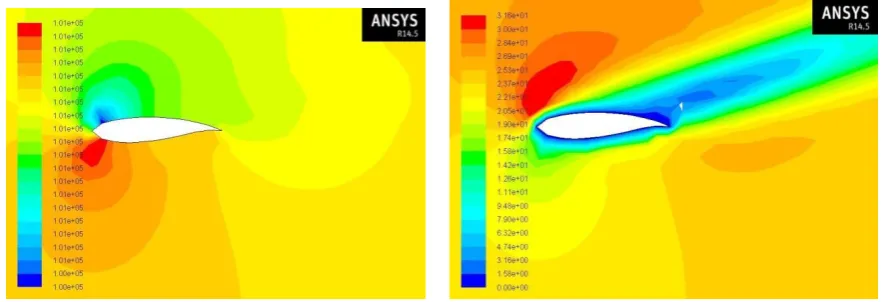
"Fig. 7 to 20" shows the variation of static pressure distribution and velocity distribution over the Airfoil at
different angles of attacks. On increasing the value of angel, the static pressure on upper surface is decreases and
pressure on lower surface increases until the particular value of angle of attack. After that, pressure on upper
surface is gradually increases and decrease in lower surface. Like that velocity distribution on upper surface is
more as compare to lower surface till particular value of angle then starts reverse phenomenon i.e. decreases
Figure 7. Pressure distribution at -5°
Figure 8. Velocity distribution at -5°
Figure 9. Pressure distribution at 0°
Figure 10.Velocity distribution at 0°
Figure 13. Pressure distribution at 10°
Figure 14.Velocity distribution at 10°
Figure 15. Pressure distribution at 12°
Figure 16.Velocity distribution at 12°
Figure 19. Pressure distribution at 20°
Figure 20.Velocity distribution at 20°
IV. CONCLUSION
CFD Simulation gives precise value of aerodynamic performance like Lift and Drag coefficient.
Maximum value of lift coefficient is 0.94 at 12°.
The optimum value of angle of attack of air on Airfoil is 6°, because at this angle the value of lift to drag
coefficient ratio is high i.e. 7.841.
Using CFD simulation we can save time and cost consumption in experiment, and can easily understood the
working mechanism in airfoil by animation.
REFERENCES
[1]. Shafiee, Shahriar, and Erkan Topal. "When will fossil fuel reserves be diminished?" Energy Policy 37.1
Jan. (2009): 181. Science Direct. Web. 1 Feb. 2012.
[2].Navin Prasad E, Janakiram S, Prabu T, Sivasubramaniam S " DESIGN AND DEVELOPMENT OF
HORIZONTAL SMALL WIND TURBINE BLADE FOR LOW WIND SPEEDS" IJESAT, Jan-Feb 2014
ISSN: 2250-3676.
[3]. IRA H. ABBOTT and ALBERT E. VON DOENHOFF "THEORY OF WING SECTIONS" (Including a
Summary of Airfoil Data) Stand4,-d Book. Number: 486-60586-8.
[4]. Singh RK, Ahmed MR, Zullah MA, Lee YH. Design and testing of a low Reynolds number airfoil for small
horizontal axis wind turbines. Renewable Energy 2012;42:66-76.
[5]. H K Versteeg and W Malalasekera "An Introduction to Computational Fluid Dynamics" second edition
2007 ISBN: 978-0-13-127498-3.
[6]. https://en.wikipedia.org.
[7]. www.nrel.gov.