Abstract—Machine-type communication (MTC) is a crucial service for next generation cellular networks. Mass accesses of the network from MTC devices may result in overload of radio access networks (RANs) and degrade the service quality of human-to-human communication. Group paging is one of the mechanisms proposed to alleviate the RAN overload problem. This paper presents an analytical model based on a recursive contending-users estimation (RCE) method proposed in [1] to derive the performance metrics of collision probability, access success probability, average access delay, statistics of preamble transmissions, statistics of access delay, and utilization of RAOs for group paging with various combinations of group sizes and reserved radio resources in a paging access interval. The optimal group size and required random-access opportunities (RAOs) are subsequently derived based on the given target success access probability. Numerical results demonstrate that the proposed model can accurately estimate the performance of group paging.
Index Terms—group paging, random access, machine-type communications, overload control
I. INTRODUCTION
achine
-type communication (MTC), which is also known as machine-to-machine communication (M2M) in IEEE 802.16 Working Group, is a new service defined by 3GPP to facilitate machines communicating with each other over current cellular networks [2]. Machine-type communication usually involves a large number of MTC devices to support a wide range of applications, such as smart grid, road security, and consumer electronic devices. However, concurrent accesses of radio network by mass MTC devices may result in intolerable delays, packet loss, or even service unavailability to current human-to-human (H2H) communication services. Hence, proper overload control mechanisms are required to guarantee network availability and quality of H2H services under heavy MTC load [2].The overload control of uplink random-access channel (RACH) in radio access network (RAN) is one of the principle working items for 3GPP Long Term Evolution (LTE) [2]. The purpose of RAN overload control is to avoid RAN overload when mass MTC devices simultaneously contend for the
Copyright (c) 2012 IEEE. Personal use of this material is permitted. However, permission to use this material for any other purposes must be obtained from the IEEE by sending a request to [email protected]. This work was supported by National Science Council, Taiwan, under Contract NSC 101-2219-E-002-023, NSC 101-3113-P-011-003, and NSC 101-2219-E-009 -026.
R. G. Cheng is the corresponding author (e-mail: [email protected]).
RACH. From the perspective of the way that MTC traffic is generated, the RAN overload control schemes can be categorized into push-based and pull-based approaches [3]. In
the push-based approach, the MTC traffic is pushed from MTC
devices to the network without any restriction until RAN overload is detected. In the pull-based approach, the MTC
traffic is pulled by the network and thus, the network may
properly control the MTC traffic load through paging and thus, prevents RAN overload.
Access class barring (ACB), separated RACH resources for MTC, dynamic allocation of RACH resource, MTC specific backoff scheme, and slotted access are examples of push-based RAN overload control schemes [2]. In the ACB scheme, the network separates the MTC traffic into several access classes and assigns an ACB factor to each MTC access class. Each cell can control the channel access probability of a specific MTC access class by setting the ACB factor. In the separated RACH scheme, the network reserves dedicated RACH resources for the H2H and MTC devices to provide them with distinct access collision probabilities. In the dynamic allocation of RACH resource scheme, the network dynamically allocates additional RACH resources for the MTC devices based on the predicted access load of MTC devices. The MTC specific backoff scheme delays the random-access (re-)attempts of MTC devices by assigning MTC-specific random backoff procedure. In the slotted access scheme, each MTC device is associated with dedicated access cycles/slots (similar to paging cycles/slots) through its identity. Each MTC device can transmit the random-access attempt only at its random-access slot. The advantages and disadvantages of various push-based RAN overload control schemes are summarized in [4].
Paging and group paging are potential pull-based RAN overload control schemes [5]. In LTE, a downlink paging channel is defined to transmit the paging information to user equipment (UE), informing UEs on system information changes and emergency notifications. The network may transmit a paging message to activate a specific UE at the UE's paging occasion. The paging occasion of each UE is determined according to its UE identity (UE-ID). Current paging mechanism that was originally designed for H2H services can only page up to 16 devices with a single paging message, and only two paging occasions are available per 10 ms radio frame [5]. Therefore, a BS must transmit multiple paging messages over a long period to activate a large number of MTC devices. Therefore, a group paging mechanism that uses a single group paging message to activate a group of MTC devices is proposed to address this issue [2]. In group paging,
Performance Analysis of Group Paging for
Machine-type Communications in LTE Networks
Chia-Hung Wei,
Ray-Guang Cheng,
Senior Member, IEEE
, and Shaio-Li Tsao
an MTC device is assigned by a unique group identity (GID) after camping on a network and joining a group. All of the MTC devices in a group listen to the same paging channel at the same paging occasion derived from the GID [5]. The group of MTC devices shall simultaneously perform the standard LTE random-access procedure to access the network when they find their GID in a group paging message. The MTC devices with random accesses that failed shall follow the standard LTE random backoff procedure to retransmit their random-access attempts during a paging access interval until the retry limitation exceeds. Note that the network may use the group paging message to notify MTC devices the paging access interval and the dedicated random-access resources reserved for group paging.
The first simulation study of group paging is given in [6]. The main performance metrics specified in 3GPP TR 37.868
[2], which include collision probability, access success
probability, statistics of number of preamble transmissions, and
statistics of access delay, were investigated. The preliminary study showed that group paging is a promising solution for RAN overload control. However, it lacks a general rule for LTE operators to determine the proper number of reserved random-access resources and the group size. This paper aims to develop an analytical model to investigate the performance of group paging and to suggest the related parameters. The analytical model needs to consider all of the implementation constraints specified in LTE [2]. The implementation constraints include the LTE random backoff procedure; the limited capacity of the downlink access grant channel, which results in failed random accesses even if the random-access attempts are not collided; the maximum number of retransmissions for the failed random-access attempts; the exponential law for power ramping effect, which results in a time-varying detection probability for the random-access attempts; and the transmission delay of the message part considering the effect of hybrid automatic retransmission request (HARQ) procedure.
The random-access architecture of LTE is similar to a multichannel slotted ALOHA system. Much research has been devoted to the slotted ALOHA system in single-channel [7,8] or multichannel slotted systems [9]-[16]. In [7], the throughput of single-channel slotted ALOHA systems as a function of a constant offered load was presented. In [8], the relationship between the throughput and the average access delay of a finite-user single-channel slotted ALOHA system was investigated. For multichannel slotted ALOHA systems, the performance metrics of the throughput [9,10,13], average access delay [11]-[15], and the collision and success probabilities [16] were also discussed. The purposes of these studies were to reduce the access delay [9], to adjust the design parameters to stabilize the channels [10,11,12], to maximize the throughput [13,14], or to realize the tradeoff between the average throughput and the average access delay [15]. A finite population system was considered in [11,12]. In [11], the stability and delay of finite-user slotted ALOHA systems with multi-packet reception were investigated. In [12], the authors showed that the variability of packet sizes results in power law
delays for finite-population ALOHA systems. In [14], the authors presented closed-form expressions of throughput and access delay for OFDMA systems. The analysis was derived based on an assumption of a constant successfully transmission probability. The collision and success probabilities defined from the perspective of a user and a random-access channel in LTE systems were discussed in [16]. The effect of random backoff procedure in slotted ALOHA systems was considered in [7,8,9,13,14,16]. The effect of the time-varying preamble detection probability due to fading channel was considered in [7]. The impact of the backoff window size to the average access delay was discussed in [8]. The access randomness in time domain was considered in [8,9]; in frequency domain was considered in [13]; and in time, code, and frequency domain was considered in [14,16]. Most of the above studies focus on the uniform backoff policy. Both the binary exponential and uniform backoff policies were considered in [14]. The constraint of the maximum number of retransmissions in the random-access procedure was considered in [13,14].
Most of the performance evaluations of ALOHA systems focused on average value (throughput and/or access delay) analysis [9,10,11,13] and the distributional property was only addressed in [12]. Existing studies normally assumed that new packet arrivals in a slot time follow a Bernoulli distribution [10,11] or a Poisson distribution [7,9,12,13,14,15] with a constant rate and thus, the combined rate of new and retransmission packets in a slot is a constant. In group paging, the number of MTC devices to be paged is known and the MTC devices access the network in a highly synchronized manner once they are paged. However, the random-access attempts in each random-access slot are not fixed because no new arrival is generated and the number of MTC devices gradually decreases if any device successfully accesses the RACH. Moreover, the analytical model has to consider the system environment (for example, power-ramping effect) and the distributional properties related performance metrics (that is, statistics of preamble transmissions and access delay) of LTE. Therefore, current analytical models cannot be directly applied to the performance analysis of group paging in LTE networks. This paper presents an analytical model to derive the performance metrics of group paging by considering all of the parameters defined in the LTE random-access procedure [17]. Similar to existing approaches, we use the known paging group size and the Poisson approximation model [1] to estimate the number of success and failed (or collided) devices in the first random-access slot. Different to current approaches, the numbers of contending devices in the successive random-access slots are then individually derived based as a function of the number of failed devices, the time-domain backoff parameters, the limited capacity of the downlink access grant channel, and the time-varying detecting probability. The performance metrics of group paging are then derived based on the estimated number of success and failed devices obtained from all random-access slots. The remainder of this paper is organized as follows: the system model and the analytical model are described in Section II. Section III presents the numerical results. Finally, conclusions are offered in Section
IV.
II. SYSTEMMODEL
This study considers a group of M MTC devices in a paging
area containing K cells in an LTE network. Without loss of
generality, we considered a case that the MTC devices are
uniformly distributed in the K cells, and thus, each cell has M/K
MTC devices. It is assumed that the each base station (BS) in
the paging area reserves an amount of R dedicated
random-access resources and sends a group paging message
containing a GID to page the M/K MTC devices simultaneously.
Once the group paging message is received, all M/K MTC
devices follow the standard LTE random-access procedure to establish connections with the BS. The performance of random accesses during a paging access interval will be investigated. The paging access interval of group paging starts from the first
random-access slot and ends at the Imaxth random-access slot,
where Imax is the number of random-access slots reserved for
group paging. Note that Imax depends on the maximal number of
preamble transmissions of the random-access procedure and will be derived below.
Figure 1 shows the time-frequency mapping [18] and the timing diagram of physical random-access transmission of LTE. In LTE, time is divided into fix-length radio frames. Each radio frame consists of multiple sub-frames. Random-access transmissions are restricted to specific sub-frames [16], which are referred as the random-access slots in the rest of this paper. In LTE, the random-access resource is determined in terms of random-access opportunities (RAOs). The total number of RAOs provided by a BS in a random-access slot is equal to the number of frequency bands in each random-access slot multiplies by the number of random-access preambles [17]. In
LTE, one access window of length TRA per TRA_REP period is
allocated for the random-access [17], as illustrated in Fig. 1.
TRA_REP is the interval between two successive random-access
slots and can be obtained from the physical random-access channel (PRACH) configuration index announced by the BS.
For example, TRA_REP = 5 radio frames [19] if PRACH
configuration index 6 is used [2].
The timing diagram shown in Fig. 1 illustrates the behavior of an MTC device receiving a group paging message. In this paper, the time axis starts from the first random-access slot in which all MTC devices send their first random-access attempts immediately after receiving the group paging message from the
BS. Hence, the time of the ith random-access slot is
i 1 TRA REP_ , as illustrated in Fig. 1. Before going intodetails, the LTE random-access procedure is first elaborated as follows:
A. LTE Random-access Procedure
Figure 2 illustrates the LTE two-step random-access procedure [17], which separates the transmission of the random-access preamble and the associated signalling messages (Msg 3 and Msg 4) for a connection setup. The preamble is transmitted through a common channel shared by multiple UEs and the signalling messages are transmitted in a
dedicated channel specifically reserved for a UE. In the first
step, a UE synchronizes to the downlink timing ((1) in Fig. 2),
randomly selects a random-access preamble from a group of preambles reserved for the RACH, and transmits the random-access preamble in a randomly chosen random-access
slot and a frequency band (2). The BS correlates the received
signal with the set of possible sequences in a cell and transmits
a response message indicating the detected preamble(s) (3).
Each response message carries a medium access control (MAC) header and one or more MAC random-access responses
(RARs). The MAC header may carry a backoff indicator (BI)
(unit: sub-frame) to indicate the backoff parameter values for
the collided or un-detected UEs. In LTE, the range of BI is from
0 to 960 sub-frames [17]. Each RAR carries the identity (ID) of the preamble selected by the UE, the information to be used by the UE to adjust the uplink timing, and a dedicated uplink resource reserved for the UE to transmit the message [17].
Let TRAR be the processing time required by the BS to detect
the transmitted preambles (unit: sub-frame); WRAR be the length
of the random-access-response window (unit: sub-frame); WBO
be the length of the backoff window (unit: sub-frame)
(WBOBI1); and NPTmax be the maximum number of
preamble transmissions. As illustrated in Fig. 1, the random-access-response window starts at the end of the
preamble transmission plus TRAR [17] sub-frames and the
backoff window starts at the end of the random-access-response window. The UE should perform random backoff and retransmit its random-access attempt if it
does not receive the response message within WRAR. For each
retransmitted random-access attempt, the UE must randomly
choose a backoff counter from zero to BI; ramp up its
transmission power, and transmit a newly selected random-access preamble in the next available random-access slot when the backoff counter decreases to zero. The process
continues until NPTmax preamble transmissions are reached.
Once the UE receives the response message from the BS and adjusts its uplink timing, the remaining signalling required for connection setup is transmitted on the assigned dedicated uplink resource in a synchronized manner by using the same procedures as normal data transmission. Non-adaptive HARQ is subsequently enabled to protect the signalling exchange of the message. The UE, which successfully receives the RAR message, must send an Msg3 carrying the UE ID and the ‘radio resource control (RRC) connection request’ message to the BS
at the radio resource assigned by the BS((4) in Fig. 2). In
response, the BS sends an HARQ acknowledgment (ACK) or
negative-acknowledgment (NACK) after THARQ sub-frames.
The BS waits for TA_M4 sub-frames and transmits Msg4 (8) after
it replies an ACK indicating that Msg3 is successfully received
(7). In contrast, the UE waits for TM3sub-frames and retransmits
Msg3 (6) if it receives an NACK (5). Similarly, the UE waits
for THARQsub-frames and sends an ACK to the BS if Msg4 is
successfully received (11). The BS waits for TM4 sub-frames
and retransmits Msg4 (10) if it does not receive an ACK for
Msg4 (9). The HARQ retransmission of Msg3 and Msg4 can be
resolution timer TCR (unit: sub-frames) whenever it transmits Msg3. The UE declares a random-access failure and reverts to step 1 to retransmit its random-access attempt if the contention resolution timer expires. Note that Msg 3 and Msg 4 are used for carrying connection setup signalling messages as well as for contention resolution. In some cases, the BS may have a chance to decode the same preamble transmitted by multiple UEs and reply a response message. These UEs will transmit their own Msg3 on the same dedicated resource and then realize the random-access failure after the expiry of the contention resolution timer.
Let R be the number of RAOs reserved by the BS in each
random-access slot; NRAR be the maximum number of RARs
that can be carried in a response message; NUL be the maximal
number of MTC devices that can be acknowledged within the
random-access response window (NUL NRARWRAR);pf be
the HARQ retransmission probability for Msg3 and Msg4; and
pn be the preamble detection probability of the nth preamble
transmission (1 n NPTmax). In LTE, pn is expressed as [2]
1 1 , n n p e (1)
which models the power ramping effect. Table I summarizes the random-access related system parameters defined in [2] and used in this paper.
When the group paging message is received, all MTC devices should transmit their first preambles at the first random-access slot. The MTC devices should perform backoff
and retransmit new preamble up to (NPTmax-1) times if the
random accesses fail. For each preamble transmission, each
MTC device may spend up to (TRAR+WRAR+WBO) sub-frames
before retransmitting a new preamble. Hence, the number of
random-access slots reserved for group paging (Imax) is
expressed as
_ 1 1 RAR RAR BO . max PTmax RA REP T W W I N T (2)The paging access interval of group paging starts from the first
random-access slot and ends at the Imaxth random-access slot. In
other words, the length of the paging access interval is
_1 Imax 1 TRA REP sub-frames.
B. Analytical Model
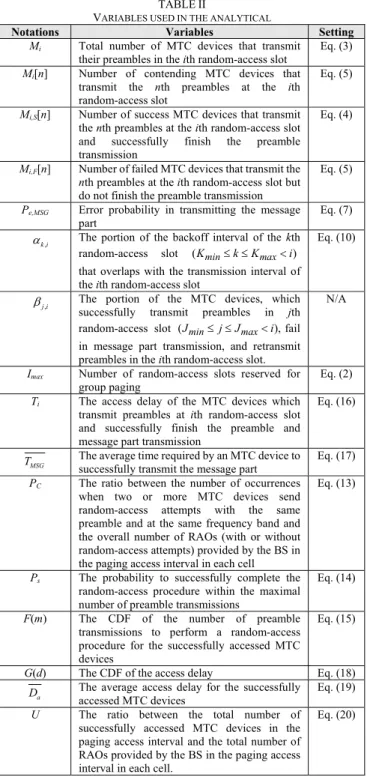
In the following, an analytical model is presented to estimate the numbers of contending, success, and failed MTC devices in each random-access slot during a paging access interval. The performance metrics of group paging are then derived based on the estimated number of MTC devices. Table II summarizes the
variables to be used in the proposed analytical model. Let Mi[n]
be the number of contending MTC devices that transmit the nth
preambles at the ith random-access slot; Mi,S[n] be the number
of success MTC devices that transmit the nth preambles at the
ith random-access slot and successfully finish the preamble
transmission (that is, the preambles are not collided, detected
by the BS, and indicated in RARs); and Mi,F[n] be the number
of failed MTC devices that transmit the nth preambles at the ith
random-access slot but do not finish the preamble transmission (that is, the preambles are collided; not collided but not detected by the BS; or, not collided, detected by the BS but not indicated
in RARs). Let Mi be the total number of MTC devices that
transmit their preambles in the ith random-access slot, which is
the summation of all contending MTC devices. That is,
1 [ ]. PTmax N i i n M M n
(3)In [1], we showed that the number of MTC devices with
preamble transmissions that have not collided for Mi MTC
devices and R RAOs at the ith random-access slot can be
approximated by
i
M R i
M e . Among these, M n Mi[ ] / i of the
MTC devices transmit their nth preambles that are detected
with a probability of pn. Therefore, [ ]
i
M R
i n
M n e p MTC devices are detected. All of the detected MTC devices can receive the acknowledgment messages if the total number of
detected MTC devices does not exceed NUL (i.e.,
1 [ ] i PTmax M N R i n UL n M n e p N
). Otherwise, the BS randomly sendsthe acknowledgment messages to NUL detected MTC devices.
In this case, the number of MTC devices that can receive the acknowledgment messages is proportional to the number of detected MTC devices that belong to the same category. Hence,
Mi,S[n] can be determined as
1 , 1 [ ] , if [ ] , [ ] [ ] , otherwise. [ ] i PTmax i i i PTmax M N M R R i n i n UL n M i S R i n UL M N R i n n M n e p M n e p N M n M n e p N M n e p
(4)The number of failed MTC devices is equal to the number of contending MTC devices minuses the number of success MTC devices. That is,
, , 1 1 [ ] [ ] [ ] [ ](1 ), if [ ] , [ ](1 ) , otherwise. [ ] i PTmax i PTmax i F i i S M N M R R i n i n UL n n i N UL i n n M n M n M n M n e p M n e p N p M n N M n p
(5)Note that Mi S, [ ]n is the number of success MTC devices that
transmit the nth preambles at the ith random-access slot and
successfully finish the preamble transmission. These MTC devices will immediately transmit the messages through the dedicated channel indicated in the RAR.
The number of MTC devices that transmit the nth preambles
max max min min max min , , , , , , , [ ] [ 1] [ 1] [ 1]. K J i k i k F j i e MSG j S k K j J K k i k F k K M n M n p M n M n
(6)Equation (6) comprises two parts: MTC devices with preamble transmissions that failed and those with message transmissions
that failed. The first part of Eq. (6) (Mk,F[n-1]) represents a
situation where the MTC devices transmit the (n-1)th
preambles at the kth random-access slot but they fail to
complete the preamble transmission. Among these MTC
devices with preamble transmissions that failed, ak,i of them
will perform random backoff and retransmit the nth preambles
at the ith random-access slot. Kmin and Kmax denote the minimal
and maximal values of k, respectively. Hence, we accumulate
the possible cases of k from Kmin to Kmax to obtain the number of
MTC devices with preamble transmissions that failed. The
second part of Eq. (6) (Pe,MSGMj,S[n-1]) denotes a situation
where the MTC devices transmit the (n-1)th preambles at the
jth random-access slot, finish the preamble transmission, and
fail in messages part (Msg 3 and Msg 4) trans transmission
mition at the error probability Pe,MSG. Among these MTC
devices with message transmissions that failed, j,i of them will
perform random backoff and retransmit the nth preambles at the
ith random-access slot. Jmin and Jmax denote the minimal and
maximal values of j, respectively. Hence, we accumulate the
possible cases of J from Jmin to Jmax to obtain the number of
MTC devices with preamble transmissions that failed. Note that the message transmission is failed if Mgs3 transmission
exceeds NHARQ times, or Msg3 transmission is success but Mgs4
transmission exceeds NHARQ times. Therefore, Pe,MSG can be
derived as
1 , 0 1 . HARQ HARQ HARQ N N j N e MSG f f f f j P p p p p
(7)In LTE, NHARQ is a constant of 5 [17], pf= 0.1 is assumed in [2],
and j i, 1, which obtains a small value for Pe,MSG. Hence, the
second term in Eq. (6) is negligible.
ak,i, Kmin, and Kmax in Eq. (6) can be derived based on the
timing diagram given in Fig. 1. The MTC device, in which the
preamble transmission is failed at the kth random-access slot,
may retransmit a new preamble at the ith random-access slot
only if the backoff interval of the kth random-access slot is
overlapped with the transmission interval of the ith
random-access slot. Therefore, ak,i is the portion of the backoff
interval of the kth random-access slot that overlaps with the
transmission interval of the ith random-access slot (k<i). As
shown in Fig. 1, the MTC devices which transmit their
preambles at the kth random-access slot at time
k 1
TRA REP_ will recognize their random-access failureafter (TRAR+WRAR) sub-frames. Each failed MTC device starts
random backoff at time
k 1
TRA REP_ (TRARWRAR) 1 .Therefore, the backoff interval of the kth random-access slot
starts from time
k 1
TRA REP_ TRARWRAR1 and endsat time
k 1
TRA REP_ TRARWRARWBO. The MTCdevices transmit their preambles at the ith random-access slot if
their backoff counters reach zero during the interval between
the (i-1)th random-access slot and the ith random-access slot.
Therefore, the transmission interval of the ith random-access
slot is
i2
TRA REP_ 1,
i 1
TRA REP_ .The minimal value of k (Kmin) is obtained when the right
boundary of the kth random-access slot backoff interval reaches
the left boundary of the ith random-access slot transmission
interval (i.e.,
Kmin 1
TRA REP_ TRARWRARWBO 1
i2
TRA REP_ )). Therefore, Kmin is expressed as
BO _ 1 ( W ) 1 RAR RAR . min RA REP T W K i T (8)The maximal value of k (Kmax) is obtained when the left
boundary of the kth random-access slot backoff interval
exceeds the right side boundary of the ith random-access slot
transmission interval (i.e., 1
Kmax
TRA REP_ TRARWRAR
_ 1 i 1 TRA REP).Hence, _ 1 . RAR RAR max RA REP T W K i T (9)ak,i can be determined based on k in three cases shown in the
lower part of Fig. 1. In the first case, the right boundary of the backoff interval is within the transmission interval (i.e.,
i2
TRA REP_ 1
k 1
TRA REP_ TRARWRARWBO
i 1
TRA REP_ ). In this case, Kmin k i
_
RAR RAR BO
RA REP
T W W
T
and the overlapped region start from the
left boundary of the transmission interval and end at the right boundary of the backoff interval. In the second case, the transmission interval is fully overlapped with the backoff
interval; thus, the length of the overlapped region is TRA_REP. In
the third case, the left boundary of the backoff interval is within
the transmission interval (i.e.,
i2
TRA REP_ 1
k1
_ 1 1 _ ).
RA REP RAR RAR RA REP
T T W i T In this case,
_ 1 RAR RAR max RA REP T W i k K T and the overlapped region
start from the left boundary of the backoff interval and end at
the right boundary of the transmission interval. ak,i is the ratio
between the overlapped region and the backoff interval and is expressed as
_ _ _ _ _ _ , _ _ 1 2 , if , , if ( 1) , 1 1RA REP RAR RAR BO RA REP BO
RAR RAR BO min
RA REP
RA REP RAR RAR BO RAR RAR
BO RA REP RA REP
k i
RA REP RA REP RAR RAR B k T T W W i T W T W W K k i T T T W W T W i k i W T T i T k T T W W _ , if 1 , 0, otherwise. O RAR RAR max RA REP T W i k K T (10)
Initially, all of the M/K MTC devices transmit their first
preambles at the first random-access slot. Hence, the initial
conditions can be set by M1 = M1[1] = M/K and M1[n] = 0 for
1.
n Let i=1 in Eq. (4), therefore, we derive
/ 1 / / 1, 1 1 , if 1 and , [ ] , if 1 and , 0, if 1. M K R UL UL M k M K S R R UL M N n e p N K M n M M e p n e p N K K n (11)
Let i=1 in Eq. (5), we obtain
/ 1 / / 1, 1 1 , if 1 and , [ ] (1 ), if 1 and , 0, if 1. M K R UL UL M K M K F R R UL M N n Me p N K K M n M M e p n e p N K K n (12)
For i2, Mi,S[n], Mi,F[n], and Mi[n] can be recursively
obtained from Eqs. (4), (5), and (6), respectively.
C. Performance Metrics
The collision probability, access success probability, statistics of number of preamble transmissions, statistics of access delay, average access delay, and the utilization of RAOs obtained in a paging access interval are chosen as the performance metrics in this paper to evaluate the performance
of group paging. The collision probability, PC, is defined as the
ratio between the number of occurrences when two or more MTC devices send random-access attempts with the same preamble and at the same frequency band and the overall number of RAOs (with or without random-access attempts)
reserved by the BS [2]. That is, PC is the ratio between the total
number of collided RAOs and the total number of reserved RAOs. In each random-access slot, the number of collided
RAOs is equal to the number of reserved RAOs (R) minus the
number of success RAOs ( )
i
M R i
M e and the number of idle
RAOs. [1] shows that the number of idle RAOs at the ith
random-access slot can be obtained from a one-shot
random-access with Mi MTC devices contending for R RAOs,
and can be approximated by .
i
M R
Re The total number of
collided RAOs in a paging access interval is obtained from the sum of the number of collided RAOs from the first
random-access slot to the Imaxth random-access slot. Hence, PC
is expressed as 1 ( ) . i i max M M I R R i i C max R M e Re P I R
(13)The access success probability, PS, is the probability to
successfully complete the random-access procedure within the
maximal number of preamble transmissions [2]. That is, PS is
the ratio between total number of successfully accessed MTC devices and the average group size in a cell. The number of
successfully accessed MTC devices that transmit the nth
preambles at the ith random-access slot is equal to
Mi,S[n](1-Pe,MSG). The total number of successfully accessed MTC devices is the sum of successfully accessed MTC devices
in all random-access slots. Hence, PS is expressed as
, , , 1 1 1 1 [ ](1 ) [ ] . /
max PTmax max PTmax
I N I N i S e MSG i S i n i n S M n p K M n P M K M
(14)Let m be the number of preamble transmissions to perform a
random-access procedure for the successfully accessed MTC devices. The “statistics of number of preamble transmission”
(F(m)) is the cumulative distribution function (CDF) of m [2].
F(m) is the ratio between the number of successfully accessed
MTC devices that transmit no more than m preambles and the
total number of successfully accessed MTC devices. Hence,
F(m) is expressed as , , , 1 1 1 1 , , , 1 1 1 1 [ ](1 ) [ ] ( ) . [ ](1 ) [ ] max max
max PTmax max PTmax
I m I m i S e MSG i S i k i k I N I N i S e MSG i S i m i m M k p M k F m M m p M m
(15)Let d be the access delay for each random-access procedure
between the first random-access attempt and the completion of the random-access procedure for the successfully accessed
MTC devices. Let G(d) be the CDF of the access delay, which
is the ratio between the number of the successfully accessed
MTC devices observed before time d and the total number of
successfully accessed MTC devices [2]. Let Ti be the access
delay of MTC devices that transmit preambles at the ith
random-access slot and successfully complete the preamble and
message transmission. Ti comprises the time required to
transmit the preamble (i.e., ( 1)i TRA REP_ ), receive the RAR
(i.e., TRARWRAR), and transmit the message. That is,
_
( 1) ( ) ,
i RA REP RAR RAR MSG
T i T T W T (16)
where TMSG is the average time required by an MTC device to
successfully transmit the message. Consider an MTC device
that successfully transmits the message using u HARQ
transmissions of Msg3 and v HARQ transmissions of Msg4
and v Msg4 is equal to 1+(u-1)(THARQ+TM3)+THARQ and
TA_M4+(v-1)(THARQ+TM4)+THARQ, respectively. The probability
that an MTC device that successfully transmits the message
using u HARQ transmissions of Msg3 and v HARQ
transmissions of Msg4 is u 1
1
v 1
1
. f f f f P P P P Hence, MSG T is expressed as
1 1 1 1 3 _ 4 4 2 2 1 1 1 1 1 1 ( ) 1 ( ) 1 HARQ HARQ HARQ HARQ N N u v MSG f f f f u v M HARQ HARQ A M M HARQ HARQ N N u v f f u v T P P P P u T T T T v T T T P P
3
4 _ 4 1 1 . ( ) 1 M M HARQ A M u T v T u v T T (17) For the successfully accessed MTC devices that completetheir random-access procedure at time d, the average time they
complete the preamble transmission is
( RAR RAR MSG) d T W T or the _ ( ( RAR RAR MSG) 1)th RA REP d T W T T
random-access slot. G(d) is estimated by
_ _ ( ) 1 , , 1 1 , , 1 1 ( ) 1 , 1 1 , 1 1 [ ] 1 ( ) [ ] 1 [ ] . [ ] RAR RAR MSG RA REP PTmax max PTmax RAR RAR MSG RA REP PTmax max PTmax d T W T T N i S e MSG i n I N i S e MSG i n d T W T T N i S i n I N i S i n M n p G d M n p M n M n
(18)Let Da be the average access delay for the successfully
accessed MTC devices (unit: sub-frame). Da is the total
access delay for all successfully accessed MTC devices normalized by the total number of successfully accessed MTC devices. The total access delay for the successfully accessed
MTC devices that transmit the last preambles at the ith
random-access slot is , , 1 [ ](1 ) PTmax N i S e MSG i n M n p T
. Hence, Da is expressed as , , , 1 1 1 1 , , , 1 1 1 1 [ ](1 ) [ ] . [ ](1 ) [ ]max PTmax max PTmax
max PTmax max PTmax
I N I N i S e MSG i i S i i n i n a I N I N i S e MSG i S i n i n M n p T M n T D M n p M n
(19)Finally, the utilization of RAOs (U) is defined as the ratio
between the total number of successfully accessed MTC devices and the total number of reserved RAOs. The total
number of successfully accessed MTC devices in the ith
random-access slot is , , 1 [ ](1 ). PTmax N i S e MSG n M n p
U is expressed as , , , 1 1 1 1 [ ](1 ) [ ] .max PTmax max PTmax
I N I N i S e MSG i S i n i n max max M n p M n U I R I R
(20)III. NUMERICAL RESULTS
Computer simulations were conducted on top of a C-based simulator to verify the effectiveness of the proposed analytical model. The simulations were developed based on a Monte-Carlo approach. In the simulations, each point
represented the average value of 107 samples. We used a
computer equipped with Intel Core2 Quad CPU Q9500 2.83GHz processor and 6GB RAM. The time used for calculating the performance metrics in all cases was less than 1 ms. Each sample was obtained by performing group paging in a paging access interval. In group paging, we may adjust design
parameters of the average group size per cell (M/K), the
reserved RAOs per random-access slot (R), the maximal
number of preamble transmission (NPTmax), and the backoff
window size (WBO) to meet the service quality constraints of the
access success probability (PS), the average access delay (Da),
and/or the collision probability (PC). For simplicity, WBO was
fixed in all of the simulations.
In the simulations, M/K MTC devices are assumed to initiate
all random-access attempts. The background traffic caused by
Poisson-distributed H2H UEs at an average rate (λ) of 0, 8, and
128 calls/s are considered. [2]. The RACH parameters defined in Table 2.2.1.1 of [2] and the processing latency specified in Table B.1.1.1-1 of TR 36.912 [20] were used as a baseline in the simulations. The settings of the parameters used in the simulation are summarized in Table I.
Two scenarios were investigated. Scenario I was used to
verify the accuracy of the analytical model. We considered a
case that a BS reserves 54 RAOs in each random-access slot (R
= 54) to page a group size of 10 to 1000 MTC devices per cell
(M/K = 10 to 1000) with or without H2H traffic and the results
are shown in Figs. 3 to 7. Different values of R were
investigated but the results are not shown on the figures. The results show that the proposed analytical model can accurately estimate the performance metrics of group paging for various
combinations of M/K, R, and NPTmax. Scenario II was designed
to study the effect of the design parameters and the tradeoffs among design strategies according the given service quality constraints. Based on this study, a BS can properly select the
design parameters of R and NPTmax to minimize the total number
of reserved RAOs according to the target group size (M/K) and
the specified service quality constraints (PS). The results are
shown in Figs. 8 to 12.
a
D , F(m), and G(d) are shown in Figs. 3 to 7, respectively.
Symbols and lines in Figs. 3 to 7 are used to present simulation
and analytic results, respectively. The analytical results of PC,
PS, Da, F(m), and G(d) were obtained based on Eqs. (13), (14),
(19), (15), and (18), respectively. In Figs. 3 to 5, various NPTmax
were evaluated. In Figs. 6 and 7, NPTmax=10 was used. In Figs. 3
to 7, all of the analytical results coincided with the simulation results, which verified the accuracy of the analysis. Fig. 3
demonstrates that the collision probability, PC, can be
decreased by increasing NPTmax. Fig. 4 shows the access success
probability, PS, as a function of the average group size, M/K. As
shown in Fig. 4, the BS can support a group size up to four
hundred per cell (M/K = 400) and all of the MTC devices
successfully completed the random-access procedure (PS = 1)if
NPTmax=10. However, the group size reduced to ten (M/K = 10)
for a target access success probability of PS = 1if NPTmax=3. Fig.
5 shows the average access delay for the successfully accessed
MTC devices, Da. For smaller group size (M K/ 50), the
average access delay is almost identical for different values of
NPTmax. As the group size increases, a smaller NPTmax results in a lower average access delay because less MTC devices can finish their random-access procedures. Fig. 6 shows the CDF of
the number of preamble transmissions, F(m), for the
successfully accessed MTC devices. The number of preamble transmissions increase in conjunction with the number of MTC devices per cell. In Fig. 6, the CDF value that equals to one does not imply that all of the MTC devices complete the random-access procedure because only successfully accessed MTC devices are considered. Fig. 7 shows the CDF of the
access delay, G(d), for the successfully accessed MTC devices.
Similarly, the access delay increases in conjunction with the number of MTC devices per cell. The proposed analytical model maintains system validity at an extremely high H2H rate of 128 calls/s; thus, our assumption that the effect of H2H traffic can be ignored in the analysis is supported. The difference between the simulation and analytic results shown in Figs. 3 to 7 is because of the error of the approximation model proposed in [1] that has been adopted to estimate the number of successful and collided devices in each random-access slot.
In Scenario II, the analytical results of group paging for various design parameters are shown in Figs. 8 to 12. Fig. 8
shows the utilization of RAOs as a function of R and M/K for
NPTmax=10. This figure can be used to obtain the proper values
of R and M/K to maximize U. The maximal value of U, as
shown in Fig. 8, is approximately 0.2, which implies that, in the optimal case, a successfully accessed MTC device requires five RAOs to complete the random-access procedure. For a fixed
value of M/K, U first increases and subsequently decreases
when R increases. For smaller values of R, the utilization of
RAOs (U) is low because only a small number of MTC devices
can complete the random-access procedure due to high
collisions. Therefore, U subsequently increases with R because
the number of successful access MTC devices increases
quickly. U approaches its maximal value when R reaches a
specific value. A further increase of R results in a decreased
value of U because more RAOs are reserved, but they are not
used. Similarly, for a fixed value of R, U first increases
and subsequently decreases when M/K increases. U increases
in conjunction with M/K because the number of successful
access MTC devices increases. U decreases after M/K exceeds
a certain value because the number of successful access MTC devices rapidly decreases because of collision.
Figure 9 shows a surface indicating the feasible region of the total number of reserved RAOs to ensure a 0.9 access success
probability (PS = 0.9) for various R and M/K with NPTmax=10.
The total number of reserved RAOs is equal to R I max and is
proportional to R and NPTmax. From Eqs. (2) and (19), the access
delay is proportional to NPTmax. Hence, a higher NPTmax results in
an increased access delay for the MTC devices. In general, the
number of required RAOs is increased if R or M/K is increased.
The minimal value of R required to support the maximal value
of M/K is located at the right-hand-side edge of the surface as
shown in Fig. 9, which is referred to as the optimal edge. The
optimal edges of the feasible regions for various NPTmax with
PS=0.9 are shown in Fig. 10. Fig. 10 can be viewed as
two-dimensional figures as shown in Figs. 11 and 12. Fig. 11 and 12 show the optimal edges of the feasible regions
indicating the total number of reserved RAOs and R for various
M/K to ensure PS=0.9, respectively. The optimal value of NPTmax
that minimizes the total number of reserved RAOs can be
obtained from Fig. 11. A smaller value of NPTmax will be chosen
if several NPTmax have the same total number of reserved RAOs.
It is because that the access delay can be reduced if a smaller
NPTmax is chosen. From Fig. 11, it can be found that NPTmax=4 for
M/K smaller than 7; NPTmax=5 is a good choice for M/K ranging
from 7 to 250; NPTmax=6 is the appropriate choice for M/K
ranging from 250 to 325; NPTmax=7 is a favorable option for
M/K ranging from 325 to 390; NPTmax=8 is the efficient setting
for M/K ranging from 390 to 458; NPTmax=9 is preferred for M/K
ranging from 458 to 522; and NPTmax=10 should be set for M/K
higher than 522. The optimal value of R can be subsequently
obtained from Fig. 12 based on the target group size M/K and
the optimal value of NPTmax obtained from Fig. 11. Fig. 12 also
shows that several NPTmax may attain the same minimal total
number of reserved RAOs. The price paid for choosing a
smaller NPTmax is to reserve a larger R for each random-access
slot. The effect is similar to that pointed out in [13]. Consider the case in which the network reserves a number of preambles
(R) to page a given workload (M/K) by using the same NPTmax.
Each group of MTC devices will be paged during a paging
access interval of ImaxTRA REP_ sub-frames. For a network
with multiple paging groups, each paging group must be paged in a paging access interval that is not overlapped with the others. The network may merge multiple paging groups into a new paging group to reduce the overall access delay. The network
may page the new paging group consisting of H identical
paging groups with group size of H M K / MTC
devices/cell by using H R preambles. As shown in Fig. 10,
the number of reserved preambles is proportional to the offered
workload for all NPTmax until the workload reaches a certain
IV. CONCLUSIONS
Group paging is one of the approaches proposed for alleviating the RAN overload problem resulting from the simultaneous accesses of mass MTC devices. This paper presents analytical models to estimate the collision probability, access success probability, average access delay, CDF of preamble transmissions, CDF of access delay, and utilization of RAOs of group paging in a paging access interval. All of the factors specified in the 3GPP evaluation methodology [2] such as the power ramping effect, backoff window size, limited number of UL grants per RAR, and the HARQ of message transmissions have been considered in the proposed model. Numerical results demonstrate that the proposed model can accurately predict the performance metrics. A possible approach to utilize the proposed model to determine the optimal group size and required radio resource based on the given target success access probability is also presented. The results demonstrate that the tradeoffs and design strategies of group paging can be achieved by properly adjusting the design
parameters for various paging cells (K) and workload (M). The
analytical model is applicable to other radio access networks adopting a similar random-access procedure such as WiMAX and can be used by network operators to dimension the required resources in random-access channels.
REFERENCES
[1] C. H. Wei, R. G. Cheng, and S. L. Tsao, “Modeling and estimation of one-shot random access for finite-user multichannel slotted ALOHA systems,” IEEE Commun. Letter, vol. 16, no. 8, pp. 1196-1199, Aug. 2012.
[2] 3GPP TR 37.868, “RAN improvements for machine-type communications,” v. 1.0.0, Aug. 2011.
[3] 3GPP R2-104873, “Comparing push and pull based approaches for MTC,” Institute for Information Industry (III), Coiler Corporation, RAN2#71, Aug 2010.
[4] 3GPP R2-112071, “Evaluation on push based RAN overload control schemes,” Huawei and HiSilicon, RAN2#73bis, April 2011.
[5] 3GPP R2-104870, “Pull based RAN overload control,” Huawei and China Unicom, RAN2#71, Aug. 2010.
[6] 3GPP R2-113198, “Further analysis of group paging for MTC,” ITRI, RAN2#74, May 2011.
[7] J. C. Arnbak and W. Van Blitterswijk, “Capacity of slotted ALOHA in Rayleigh-fading channels,” IEEE J. Select. Areas Commun., vol. 5, pp. 261–269, Feb. 1987.
[8] L. Kleinrock and S. S. Lam, “Packet switching in a multi-access broadcast channel: Performanc evaluation,” IEEE Trans. Commun., vol. 23, no. 4, pp. 410-423, Apr. 1975.
[9] I. Rubin, “Group random-access discipline for multi-access broadcast channels,” IEEE Trans. Information Theory, vol. 24, pp. 578-592, Sep. 1978.
[10] H. H. Tan and H. Wang, “Performance of multiple parallel slotted ALOHA channels,” in Proc. INFOCOM, pp. 931–940, Mar. 1987. [11] V. Naware, G. Mergen, and L. Tong. “Stability and delay of finite user
slotted ALOHA with multipacket reception,” IEEE Trans. on Information Theory, vol. 5, no. 7, pp. 2636-2656, July 2005.
[12] P. R. Jelenkovic and J. Tan. “Stability of finite population aloha with variable packets,” Technical Report arXiv:0902.4481v2, 2009. [13] Y. J. Choi, S. Park, and S. Bahk, “Multichannel random access in
OFDMA wireless network,” IEEE J. Select. Areas Commun., vol. 24, no. 3, pp. 603-613, Mar. 2006.
[14] P. Zhou, H. Hu, H. Wang, and H. H. Chen, “An efficient random access scheme for OFDMA systems with implicit message transmission,” IEEE Trans. on Wireless Commun., vol. 7, no. 7, pp.2790-2797, July 2008. [15] L. Kleinrock and F. Tobagi, “Packet switching in radio channels, Part I –
Carrier sense multiple-access modes and their throughput – delay characteristics,” IEEE Trans. Commun., vol. 23, pp. 1400–1416, Dec. 1975.
[16] R. G. Cheng, C. H. Wei, S. L. Tsao and F. C. Ren, “RACH collision probability for machine-type Communications,” IEEE 75th Vehicular Technology Conference, May 2012..
[17] 3GPP TS 36.321, “Evolved universal terrestrial radio access (E-UTRA): Medium access control (MAC) protocol specification,” v. 9.3.0, June 2010.
[18] 3GPP R1-061369, “LTE random-access capacity and collision probability,” Ericsson, RAN1#45, May 2006.
[19] 3GPP TS 36.211, “Evolved universal terrestrial radio access (E-UTRA): Physical channels and modulation,” V10.2.0, June 2011.
[20] 3GPP TR 36.912, “Feasibility study for further advancements for E-UTRA (LTE-Advanced),” v. 10.0.0, March 2011.
[21] 3GPP R1-060584, “E-UTRA random access,” Ericsson, RAN1#44, Feb 2006.
TABLEI
RANDOM-ACCESS RELATED SYSTEM PARAMETERS
Notations Definitions Settings in
simulation M/K Average number of MTC devices in a cell 10~1000
WBO Backoff window size(unit: sub-frame) BI + 1 NUL Maximal number of MTC devices that can
be acknowledged within the
random-access response window NRAR x WRAR
TRA_REP Interval between two successive
random-access slots (unit: sub-frame)
TRA_REP =5 if
PRACH Configuration
Index = 6
R Total number of preambles in a
random-access slot 54
NPTmax Maximal number of preamble
transmission
10
NRAR Maximal number of RAR that can be
carried in a response message 3
TCR Contention resolution timer (unit:
sub-frame) 48
WRAR Length of the random-access response
window (unit: sub-frame) 5
BI Backoff indicator (unit: sub-frame) 20
pf HARQ transmissions for Msg3 and Msg4 10% NHARQ Maximal number of HARQ transmission
for Msg3 and Msg4 5
pn Preamble detection probability of the nth
preamble transmission pn 1 e1n TRAR Processing time required by a BS to detect
the transmitted preamble (unit: sub-frame) 2
THARQ Time interval required for receiving
HARQ ACK (unit: sub-frame) 4
TM3 Gap of Msg3 retransmission (unit:
sub-frame)
4
TA_M4 Gap of monitor Msg4 (unit: sub-frame) 1 TM4 Gap of Msg4 retransmission (unit:
TABLEII
VARIABLES USED IN THE ANALYTICAL
Notations Variables Setting
Mi Total number of MTC devices that transmit
their preambles in the ith random-access slot Eq. (3)
Mi[n] Number of contending MTC devices that
transmit the nth preambles at the ith random-access slot
Eq. (5)
Mi,S[n] Number of success MTC devices that transmit
the nth preambles at the ith random-access slot and successfully finish the preamble transmission
Eq. (4)
Mi,F[n] Number of failed MTC devices that transmit the nth preambles at the ith random-access slot but do not finish the preamble transmission
Eq. (5)
Pe,MSG Error probability in transmitting the message
part Eq. (7)
k i, The portion of the backoff interval of the kth
random-access slot (Kmin k Kmaxi) that overlaps with the transmission interval of the ith random-access slot
Eq. (10)
j i, The portion of the MTC devices, which
successfully transmit preambles in jth random-access slot (Jmin j Jmaxi),fail in message part transmission, and retransmit preambles in the ith random-access slot.
N/A
Imax Number of random-access slots reserved for
group paging Eq. (2)
Ti The access delay of the MTC devices which
transmit preambles at ith random-access slot and successfully finish the preamble and message part transmission
Eq. (16)
MSG
T The average time required by an MTC device to successfully transmit the message part Eq. (17) PC The ratio between the number of occurrences
when two or more MTC devices send random-access attempts with the same preamble and at the same frequency band and the overall number of RAOs (with or without random-access attempts) provided by the BS in the paging access interval in each cell
Eq. (13)
Ps The probability to successfully complete the
random-access procedure within the maximal number of preamble transmissions
Eq. (14)
F(m) The CDF of the number of preamble transmissions to perform a random-access procedure for the successfully accessed MTC devices
Eq. (15)
G(d) The CDF of the access delay Eq. (18)
a
D The average access delay for the successfully
accessed MTC devices Eq. (19)
U The ratio between the total number of successfully accessed MTC devices in the paging access interval and the total number of RAOs provided by the BS in the paging access interval in each cell.
Eq. (20) Kmaxth TRA_REP TRA Data transmission Radio frame t kth ith
transmission interval of the ith random-access slot
1st G rou p p agi ng me ss age
Can be used for other random-access channels or data transmission
TRA_REP
. . .
0
t
_
( 1) RA REP RAR RAR 1
tk T T W
Time-frequency mapping of physical random-access transmission
(Scheduled) Data transmission Random-access preamble Guard time . . . Ban d wi dth of ra ndom acce ss channe l 2rd _
( 1) RA REP RAR RAR BO tk T T W W _ ( 2) RA REP1 t i T t ( 1)i TRA REP_ Data transmission Kminth
backoff interval of the
kth random-access slot
TRARWRAR backoff interval of the
Kminth random-access slot
TRARWRAR
backoff interval of the
Kmaxth random-access slot
TRARWRAR . . . . . . . . . WBO WBO WBO random-access slot
overlapped region of backoff interval and transmission interval
Fig. 1. The timing diagram of physical random-access transmission of LTE.
Fig. 2 Two-step random-access (the numbers describe different events during a random-access procedure) [21]. FIG.3Collision probability 101 102 103 10−4 10−3 10−2 10−1 100 M/K
Pc Sim NPTmax=10 (with H2H traffic λ=8)
Sim N
PTmax=10 (with H2H traffic λ=128)
Sim N
PTmax=10 (without H2H traffic)
Sim N
PTmax=5 (without H2H traffic)
Sim N
PTmax=3 (without H2H traffic)
Ana N
PTmax=10 (without H2H traffic)
Ana NPTmax=5 (without H2H traffic)
Ana N
Fig. 4 Access success probability
Fig. 5 Average access delay
Fig. 6 CDF of preamble transmission
Fig. 7 CDF of access delay.
Fig. 8 Utilization of RAOs.
Fig. 9 A surface indicating the feasible region of R and M/K to ensure PS=0.9
for NPTmax=10.
Fig. 10 The optimal edges of the feasible regions for various NPTmax with PS=0.9.
Fig. 11 The optimal edges of the feasible regions indicating the required RAOs for various M/K with PS=0.9.
101 102 103 10−2 10−1 100 M/K Ps
Sim NPTmax=10 (with H2H traffic λ=8)
Sim NPTmax=10 (with H2H traffic λ=128)
Sim N
PTmax=10 (without H2H traffic)
Sim N
PTmax=5 (without H2H traffic)
Sim NPTmax=3 (without H2H traffic)
Ana N
PTmax=10 (without H2H traffic)
Ana N
PTmax=5 (without H2H traffic)
Ana NPTmax=3 (without H2H traffic)
101 102 103 0 20 40 60 80 100 120 140 160 180 M/K Da (ms)
Sim NPTmax=10 (with H2H traffic λ=8)
Sim NPTmax=10 (with H2H traffic λ=128)
Sim NPTmax=10 (without H2H traffic)
Sim N
PTmax=5 (without H2H traffic)
Sim N
PTmax=3 (without H2H traffic)
Ana NPTmax=10 (without H2H traffic)
Ana N
PTmax=5 (without H2H traffic)
Ana N
PTmax=3 (without H2H traffic)
1 2 3 4 5 6 7 8 9 10 0 0.1 0.2 0.3 0.4 0.5 0.6 0.7 0.8 0.9 1
Number of preamble transmission
F(m)
Ana M/K=101 (without H2H traffic) Ana M/K=102 (without H2H traffic) Ana M/K=103 (without H2H traffic) Sim M/K=101 (without H2H traffic) Sim M/K=102 (without H2H traffic) Sim M/K=103 (without H2H traffic) Sim M/K=103 (with H2H traffic λ=8) Sim M/K=103 (with H2H traffic λ=128) 0 50 100 150 200 250 300 0 0.1 0.2 0.3 0.4 0.5 0.6 0.7 0.8 0.9 1 Access delay(ms) G(d)
Ana M/K=101 (without H2H traffic)
Ana M/K=102 (without H2H traffic)
Ana M/K=103 (without H2H traffic)
Sim M/K=101 (without H2H traffic)
Sim M/K=102 (without H2H traffic)
Sim M/K=103 (without H2H traffic)
Sim M/K=103 (with H2H traffic λ=8)
Sim M/K=103 (with H2H traffic
λ=128) 100 200 300 400 500 600 1 7 13 19 25 31 37 43 49 54 0.05 0.1 0.15 0.2 M/K R U 0.02 0.04 0.06 0.08 0.1 0.12 0.14 0.16 0.18 0.2 0 100 200 300 400 500 600 1 7 13 19 25 31 37 43 49 540 500 1000 1500 2000 2500 3000 M/K R
Total number of reserved RAOs
P s=0.9 NPTmax=10 Ps=0.9 NPTmax=9 Ps=0.9 NPTmax=8 P s=0.9 NPTmax=7 P s=0.9 NPTmax=6 Ps=0.9 NPTmax=5 Ps=0.9 NPTmax=4 0 100 200 300 400 500 600 0 500 1000 1500 2000 2500 3000 M/K
Total number of reserved RAOs
Ps=0.9 NPTmax=10 Ps=0.9 NPTmax=9 P s=0.9 NPTmax=8 P s=0.9 NPTmax=7 P s=0.9 NPTmax=6 Ps=0.9 NPTmax=5 Ps=0.9 NPTmax=4