California Public Utilities Commission
Public Utilities Code Section 747 Report to
the Governor and Legislature
Electric and Gas Utility Cost Report
Contents
1.
Introduction
4
2.
General Rate Case Revenue Requirements
9
3.
Power
Procurement
15
4.
Demand Side Management & Customer Programs
22
5.
Bonds
&
Regulatory
Fees
27
6.
Natural Gas Utility Revenue Requirements
30
Figures
1.1 2010 Rate Components 5
1.2 Trends in System Average Rates and Inflation 5
1.3 2010 Demand Side Management Expenses 6
1.4 2010 IOU Revenue Requirement Summary 7
1.5 2010 Rate Base 8
1.6 Trends in Rate Base 8
2.1 2010 General Rate Case Revenue Requirements 9
2.2 2010 Distribution Revenue Requirements 10
2.3 Trends in Distribution Revenue Requirement 11
2.4 Trends in Generation Revenue Requirement 11
2.5 2010 Generation Revenue Requirement 11
2.6 Revenue Requirements for UOG Sources 12
2.7 Trends in Weight Average Rate of Return 13
2.8 Trends in Return on Equity 13
2.9 Trends in Transmission Revenue Requirements 14
3.1 2010 Energy Supply 15
3.2 Trends in Purchased Power Revenue Requirement 17
3.3 Trends in Purchased Power Supply 17
3.4 Average Cost of RPS Sources and Total Energy Portfolio 19
3.5 Average Cost for Purchased Power 20
4.1 2010 Demand Side Management Expenses 22
4.2 Costs and Savings for Energy Efficiency Programs 23 4.3 Costs and Savings for Demand Response Programs 24
4.4 2010 Low Income Program Expenses 25
4.5 Trends in Low Income Program Expenses 26
5.1 Trends in Bond Expenses 27
5.2 2010 Bond Expenses 28
5.3 2010 Regulatory Fees 28
6.1 2010 Gas Revenue Requirement Summary 30
6.2 Trends in PG&E Gas Utility Revenue Requirements 30 6.3 Trends in SoCal Gas Utility Revenue Requirements 31 6.4 Trends in SDG&E Gas Utility Revenue Requirements 31
6.5 Historic Gas Utility Revenue Requirements 31
I. Introduction
Enacted as AB 67 in 2005, PU Code 747 (b) requires the California Public Utilities Commission (CPUC or the Commission) to prepare a written report on the costs of programs and activities conducted by the four major electrical and gas companies regulated by the Commission. The report is to be submitted to the Governor and the Legislature by April 1st of each year and is required to include the following:
1) Each program mandated by statute and its annual cost to ratepayers.
2) Each program mandated by the commission and its annual cost to ratepayers. 3) Energy purchase contract costs and bond-related costs incurred pursuant to Division
27 of the Water Code.
4) All other aggregated categories of costs currently recovered in retail rates as determined by the commission.
This report is submitted by the Commission to fulfill the above statutory requirements of Section 747 (b).
Background
The State of California has been a national leader in gas and electric energy policy, setting innovative mandates for market restructuring, renewable energy, demand side management, and greenhouse gas regulation. With the implementation of these policies, the utilities’ cost structures and rate setting process have become increasingly complex. The funds that the utility is
authorized to collect in rates to meet all its expenses — commonly referred to as revenue requirements — are approved through several different regulatory proceedings. The California Legislature passed AB 67 in 2005to establish an annual reporting requirement that would identify the costs to ratepayers of all utility programs and activities.
Similar to the 2009 AB 67 Report, this Report provides a detailed narrative of various energy policies in California to provide the reader with the necessary context to understand what drives electric and gas rates. The report presents a breakdown of all of the major components that contribute to gas and electric rates along with charts and tables showing how these costs and rates have varied over time since 2003.
The Report presents an analysis of the authorized revenue requirements and cost analyses for the four California investor-owned utilities: Pacific Gas & Electric (PG&E), Southern California Edison (SCE), San Diego Gas & Electric (SDG&E) and Southern California Gas Company (SoCal Gas). “Authorized revenue requirements” are the amounts of revenues that the utilities are authorized to collect from customers. Using sales forecasts, the rates are set to collect the authorized revenue requirement. To the extent that actual sales end up being different from forecasted sales, the utilities may end up collecting more or less than the authorized revenue requirements. Discrepancies between authorized revenue requirements and actual revenues and expenses are captured through balancing account mechanisms, which “true-up” the actual
revenue to the authorized revenue requirement in the following year. Thus, the utilities in the end only collect authorized revenue requirements.
Overview
Electric Utility Costs
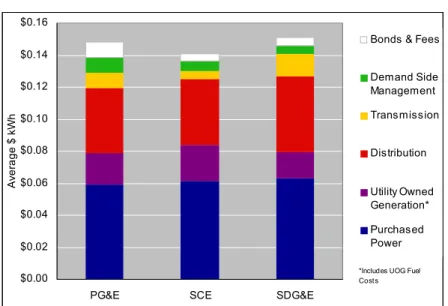
Electric generation and energy procurement is the largest component of electric rates.
Generation, provided through utility owned generation and purchased power sources, collectively accounts for 51% of the total revenue requirement.
Figure 1.1: 2010 Rate Components
$0.00 $0.02 $0.04 $0.06 $0.08 $0.10 $0.12 $0.14 $0.16
PG&E SCE SDG&E
A ver a ge $ k W h
Bonds & Fees Demand Side Management Transmission Distribution Utility Owned Generation* Purchased Power
*Includes UOG Fuel Costs
System Average Rate increases have tracked inflation. Between the years of 2003 and 2010, the system average rates increased at an annual average of 1.9%, compared with the 2.4% average annual inflation rate since 2003. Figure 1.2 shows the trend in average electric rates for PG&E, SCE and SDG&E. In 2010, PG&E’s system average rate was 15.3¢/kWh, SCE’s was 14.3¢/kWh effective June 1, 2010 and SDG&E’s was 15.9¢/kWh.1
Figure 1.2: Trends in System Average Rates
$-$0.05 $0.10 $0.15 $0.20 2003 2004 2005 2006 2007 2008 2009 2010 $ / kW h
PG&E SCE SDG&E 2003 Inflation-adjusted rate
1 The above referenced system average rates were proposed in the following investor-owned-utility filings:
Demand side management has been a cost effective method to meet new demand.
Demand response and energy efficiency programs provide ratepayer savings that are greater than the program costs. Based on the Commission’s cost/benefit studies of demand response and energy efficiency verification reports, ratepayer savings have outweighed ratepayer costs by over $500 million. Savings result from avoided energy procurement expenses, as well as deferred investment in transmission and distribution. In addition to energy efficiency and demand response, the CPUC has a distributed generation as a demand side management program as well The cost/benefit study for distributed generation programs is a one-time report scheduled to be released in mid-2011. This is one component of a several-part cost effectiveness study also including net energy metering and the California Solar Initiative (CSI) program.
Table 1.3: 2010 Demand Side Management Expenses (000)
PG&E SCE SDG&E
Costs Savings Costs Savings Costs Savings
Energy Efficiency* $461,439 $629,395 $459,228 $708,422 $90,039 $134,064 Demand Response $84,528 $134,741 $71,162 $113,355 $16,585 $25,767
Total Costs/Savings $545,966 $764,136 $530,390 $821,778 $106,624 $159,831
* From CPUC Energy Efficiency Verification Reports. Energy efficiency includes low income energy efficiency programs.
Renewable Portfolio Standard (RPS) eligible energy remains a small but growing component of the revenue requirements. PG&E, SCE, and SDG&E collectively served 18% of their retail electricity load with renewable power in 2010. Since 2003, 1,702 MW of new renewable capacity has been installed as a result of the RPS program. More projects
– over 1,000 MW – have come online since 2003 under short-term contracts, but the RPS program is not generally credited with incenting the development of these projects. The CPUC has approved 184 renewable energy contracts for over 16,000 MW of renewable capacity. The CPUC approved one quarter of these contracts in 2010.
Gas Utility Costs
Total natural gas utility costs in 2010 increased moderately from last year, but are still lower than the five year average.
Revenue requirements for natural gas transmission, distribution and storage systems have also increased moderately in recent years.
Costs authorized by the CPUC for natural gas public purpose programs have increased 25% since 2006, primarily due to significant increases for energy efficiency and low-income energy efficiency.
The remainder of this report provides a breakdown of the various cost components and identifies the components that have experienced the greatest increase. In addition to the detailed summary tables provided throughout the text, Appendix A provides summaries of the IOU revenue
requirements organized according to the rate components typically shown on customer bills.
Determining Revenue Requirements
Due to the varied nature of the utility costs and the multitude of energy policy programs, the determination of revenue requirements and rate-setting process at the CPUC has grown more complex over time. Some categories of costs are determined in the general rate cases, while others are determined through the Energy Resource Recovery Account (ERRA). In addition, budgets for each program area are determined in separate program proceedings.
The utilities earn a rate of return or profit only on items of cost that are capitalized (e.g. assets and equipment). For many cost categories such as purchased power and fuel cost, they are only reimbursed for their cost. There is no mark-up or profit on the cost. These cost items are commonly referred to as pass-through costs. The revenue requirements the utilities are authorized to collect from customers are determined chiefly in the following forums:
1. General rate cases at the CPUC
2. Transmission rate cases at the Federal Energy Regulatory Commission (FERC). The CPUC is required to allow recovery of all FERC authorized costs.
3. Energy Resource Recovery Account (ERRA) proceedings where the Commission reviews each utility’s fuel and power purchase cost forecasts and passes through the revenue requirements without allowing any profit or mark-up to the utility.
4. Specific program area proceedings where the program budget is determined.
Categorization of Utility Costs
Utility costs or revenue requirements are categorized into three major categories: generation, distribution and transmission. This categorization not only reflects major areas of utility operations but is also used to decide which customer classes would pay for which categories of costs. The latter is important because some utility customers do not receive full or bundled service from the utility. Instead they may generate their own power on site or buy power from a non-utility source (e.g. electricity service providers or ESPs or a community choice aggregator). Such customers are not charged for the generation cost by the utility and pay only the
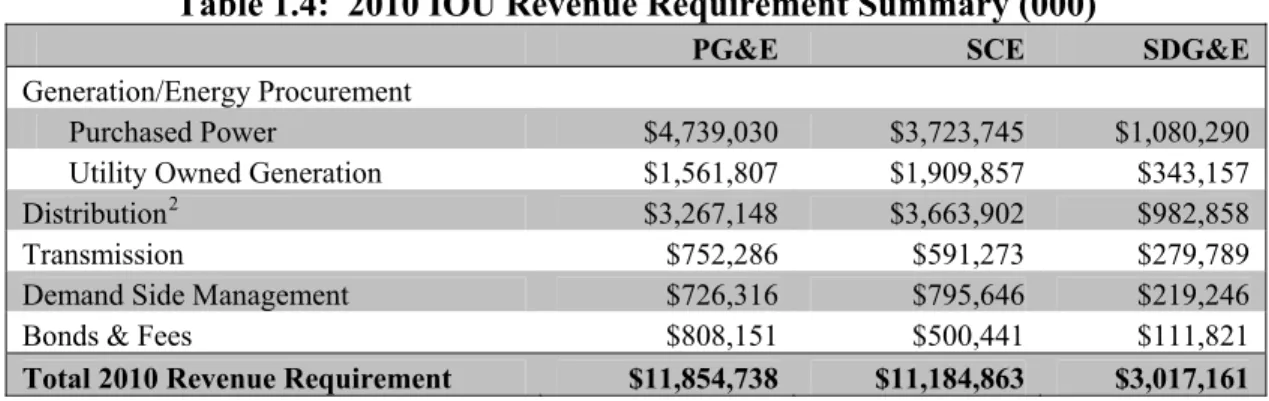
transmission and distribution cost. Additionally, some large customers may be receiving service at transmission voltage level and do not use the utility distribution system.
Table 1.4: 2010 IOU Revenue Requirement Summary (000)
PG&E SCE SDG&E
Generation/Energy Procurement
Purchased Power $4,739,030 $3,723,745 $1,080,290 Utility Owned Generation $1,561,807 $1,909,857 $343,157 Distribution2 $3,267,148 $3,663,902 $982,858
Transmission $752,286 $591,273 $279,789
Demand Side Management $726,316 $795,646 $219,246 Bonds & Fees $808,151 $500,441 $111,821
Total 2010 Revenue Requirement $11,854,738 $11,184,863 $3,017,161
Rate Base
The rate base is the book value of the generation, distribution and transmission infrastructure owned and operated by the utility after depreciation. Other things equal, a higher rate base results in a higher net income for the utility and vice versa as the utilities’ total return is based on the remaining book value of their assets or rate base. As assets are depreciated over time, the rate base declines. Rate base increases when utilities build new plant and infrastructure or make capital additions and improvements that are treated as capital improvements. Changes in rate base also result in changes in depreciation allowance the utility is authorized to collect. From 2003 to 2010, IOU rate base increased from $22.3 billion to $33.5 billion, leading to the increases in the GRC revenue requirements. The increase is driven mostly by distribution infrastructure upgrade investments.
Figure 1.5: 2010 Rate Base Figure 1.6: Trends in Rate Base
-2 4 6 8 10 12 14 16
PG&E SCE SDG&E
R a te B a se ( $ B illion)
Generation Distribution Transmission
-5 10 15 20 25 30 35 2003 2004 2005 2006 2007 2008 2009 2010 R ate Ba se ( $ B ill io n)
II. General Rate Case (GRC) Revenue Requirements
The costs that can be fairly accurately predicted and budgeted are examined and approved by the Commission in General Rate Case proceedings (GRCs). These proceedings usually are on a 3 year cycle for the major utilities even though sometimes the interval may be longer than 3 years. In the GRC proceedings, the Commission sets a pre-specified revenue requirement for the first year called the “test year” with pre-specified formulaic adjustments for the following years (commonly called attrition years) until the next GRC decision goes into effect.
If the utilities’ actual expenditures turn out to be more or less than the level adopted by the Commission in a GRC proceeding, the utilities’ authorized revenue requirement stays the same unless it was specified differently. This GRC ratemaking with pre-specified budgets is adopted with the goal to provide utilities an incentive to stay within the approved budgets. With this ratemaking treatment, utility profits suffer if they spend more than the GRC authorized revenue requirement and vice versa.
Approximately 45% of the utilities’ revenue requirements are set in general rate cases at the CPUC and at FERC. The remaining 55% consists of pass-through costs determined to be reasonable by the CPUC. The transmission revenue requirement is determined by the Federal Energy Regulatory Commission (FERC) in transmission owner rate cases following similar test year rate making.
GRC revenue requirements are generally categorized as Distribution Revenue Requirement, Transmission Revenue Requirement and Utility Owned Generation. Each of these categories is comprised of major cost elements such as operations and maintenance (O&M), depreciation, return on rate base and taxes. Table 2.1 below summarizes the total GRC revenue requirements broken down into major cost elements for the three major electric utilities.
Table 2.1: 2010 General Rate Case Revenue Requirements (000)
PG&E SCE SDG&E
Operations and Maintenance $1,933,573 $1,978,951 $466,066
Depreciation $1,148,688 $1,194,692 $316,259
Return on Rate Base $909,993 $1,187,557 $251,958
Taxes $617,138 $758,290 $178,960
Total $4,609,392 $5,119,489 $1,213,243
(Excludes FERC determined transmission revenue requirements)
Operations and Maintenance (O&M): These costs include all operations and maintenance costs such as facility upgrades and additions, staffing costs for utility owned generation plants and the distribution system. The utilities are required to maintain their systems in accordance with the Commission’s safety and reliability standards and industry best
practices, but the Commission does not dictate as to where the utilities must spend the money and how much. Depending on how they manage various projects and prioritize the budgets, the utilities may end up spending more or less than the Commission’s authorized O&M budget. In the GRC proceedings, the Commission undertakes a thorough review of O&M separately for generation and distribution related facilities and for general plant.
Depreciation: All of the capital investment in utility facilities and assets is financed by the utilities using their own funding sources. The capital they spend on financing these assets is returned to them over specified time periods in the form of depreciation allowance.
Depreciation spreads the ratepayers’ cost of the physical electric plant and systems over its useful life.
Return on Rate Base: Because the utilities provide the upfront financing for all capitalized items of expenses, the Commission provides them a rate of return on their invested capital. Rate of return is the weighted average cost of debt and shareholder equity. The Commission allows a fair and reasonable return that is sufficient to allow continued flow of needed capital. Rate of return was formerly determined in each utility’s GRC, but today the
Commission conducts a separate cost of capital proceeding to determine the rate of return for all of the major energy utilities. The utilities’ actual rate of return may be more or less than the rate of return authorized by the Commission, depending on how well the utilities manage their authorized GRC revenue requirements. If they are able to keep their costs below the forecasted costs and authorized revenues, they can boost their profits above the authorized level and vice versa.
In addition to the authorized rate of return, the Commission has instituted some incentive
programs such as the energy efficiency Risk/ Reward Incentive Mechanism (RRIM) and the gas cost incentive mechanism whereby the utilities share in the savings or cost reductions with ratepayers. The utilities are not allowed a mark-up or profit on purchased power and fuel costs which are pass through costs.
Distribution Revenue Requirement
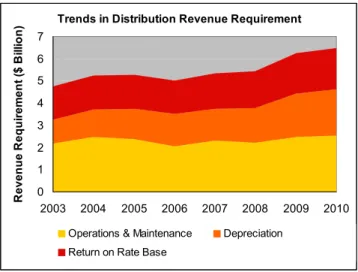
Since 2003, the total distribution revenue
requirement has increased from $5.94B to $8.05B. Over that same time period depreciation expenses have experienced the greatest increase among the distribution revenue requirements, with a 13.9% average annual growth rate. O&M and Return on Rate Base increased by 2.3% and 3.3%
respectively. During this period, the increases in distribution costs were primarily due to capital additions and infrastructure improvements to the distribution system. These distribution
infrastructure investments led to increases in rate base, as discussed on page 8.
Table 2.2: 2010 Distribution Revenue Requirements (000)
PG&E SCE SDG&E
Operations and Maintenance $1,080,678 $1,121,470 $339,523
Depreciation $893,272 $908,606 $286,477
Return on Rate Base $753,390 $910,893 $197,220
Total $2,727,340 $2,940,969 $823,220
Trends in Distribution Revenue Requirement
0 1 2 3 4 5 6 7 2003 2004 2005 2006 2007 2008 2009 2010 R ev e nue R equi re m e nt ( $ B illio n )
Operations & Maintenance Depreciation
Utility Owned Generation (UOG) Revenue Requirement
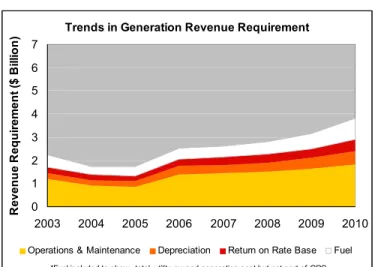
The revenue requirement for utility owned generation includes O&M costs, depreciation and return on rate base related to these facilities. As the old generating plants depreciate, these costs go down over time, unless new plants are built by the utilities or capital improvements are made to the existing facilities. UOG revenue requirement experienced some recent increases due to the nuclear steam generator replacements by SCE and PG&E and with the addition of some peaking capacity. In 2006, some Administrative and General Expenses were recategorized as generation expenses in the GRC. Because of this, O&M expenses for generation increased in 2006 while they decreased for distribution.
While the majority of the UOG revenue requirement is authorized in the GRC, fuel costs are authorized annually through ERRA because the fuel prices fluctuate with the market. Following restructuring and divestiture of fossil-fueled generation, UOG today accounts for 38.7% of the combined utility supply portfolio and 11.1% of their combined revenue requirements.
Table 2.5: 2010 Generation Revenue Requirements (000)
PG&E SCE SDG&E
Operations and Maintenance $852,895 $857,480 $126,543
Depreciation $255,416 $286,086 $29,782
Return on Rate Base $156,603 $276,665 $54,738
Total $1,264,914 $1,420,231 $211,063
Utility owned generation for PG&E consists primarily of hydro-electric and nuclear power (Diablo Canyon) plants. SCE’s UOG portfolio consists primarily of coal (with a joint ownership stake in Four Corners Generating Facility in Arizona) and nuclear. SCE’s reliance on coal has substantially decreased since the Mohave Generating Station has been taken out of service. SDG&E and SCE hold joint ownership in San Onofre Nuclear Generating Station.3 SCE also
holds partial ownership in Palo Verde Nuclear Generator in Arizona. Due to capital investment in new steam generators, nuclear generation revenue requirements have increased the most among UOG sources, at an average annual increase of 4.8% per year.
The utilities divested most of their natural gas generation capacity in 1998, but SCE and SDG&E have recently constructed natural gas peaking plants which have resulted in increases in UOG revenue requirements.
3 In addition to the list of UOG resources above, SCE also owns and operates a diesel generating facility on Santa
Catalina Island. Since the island’s load is not connected to the grid, the supply and demand are not included in the forecasts, but the expense is included in the revenue requirements.
Trends in Generation Revenue Requirement
0 1 2 3 4 5 6 7 2003 2004 2005 2006 2007 2008 2009 2010 R even u e R eq u ir em en t ( $ B ill io n )
Operations & Maintenance Depreciation Return on Rate Base Fuel
Besides the O&M, depreciation and return authorized in GRC proceedings and fuel costs, nuclear generation also requires the following additional costs, which are collected as separate revenue requirements:4
Fees for Disposal and storage of spent nuclear fuel are required by the US Department of Energy for temporary and permanent storage facilities
Nuclear decommissioning of generating plants at the end of their lives.
Figure 2.6: 2010 Revenue Requirements of UOG Sources
0.0 0.2 0.4 0.6 0.8 1.0 1.2 1.4 1.6 1.8
PG&E SCE SDG&E
R ev enu e R equ ire m en t ($ B ill io n)
Coal Large Hydropower
Nuclear Natural Gas
Authorized Rate of Return
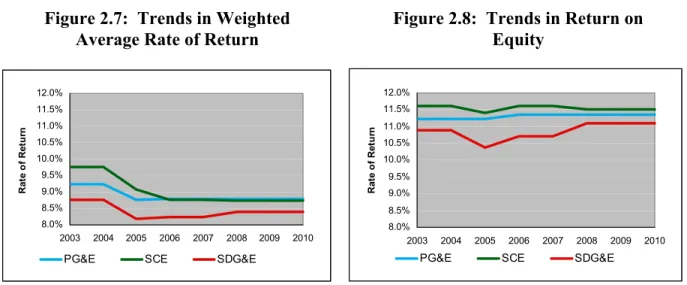
The following charts show the rate of return authorized by the Commission since 2003 for each utility. They do not include the rate of return authorized by the FERC for IOU transmission systems. It only includes return authorized by the CPUC for utility owned generation and distribution. As Table 2.7 shows the weighted average rate of return has declined from 2003 to 2010. The decline is driven mostly by the lower cost of debt in the last few years.
4 Nuclear Decommissioning and DOE Decommissioning &Disposal expenses are listed in the Bonds & Fees
8.0% 8.5% 9.0% 9.5% 10.0% 10.5% 11.0% 11.5% 12.0% 2003 2004 2005 2006 2007 2008 2009 2010 Ra te o f Re tu rn
PG&E SCE SDG&E
8.0% 8.5% 9.0% 9.5% 10.0% 10.5% 11.0% 11.5% 12.0% 2003 2004 2005 2006 2007 2008 2009 2010 Ra te o f Re tu rn
PG&E SCE SDG&E
Transmission Revenue Requirements
As part of energy restructuring, the California Independent System Operator (CAISO) was created and given operational control over the utilities’ high voltage lines on January 1, 1998. With that, the authority for determining transmission revenue requirements was transferred to FERC. The transmission revenue requirements authorized by FERC involve the same major revenue requirement components (O&M, depreciation and return on rate base) as the general rate cases at the CPUC. However, most of the time, the transmission revenue requirement at FERC is reached through settlements and adopted as a “black box” number without a breakdown of the components. Therefore, the Commission does not have the same information to report and analyze for transmission as it does for generation and distribution.
The transmission revenue requirements vary significantly for each utility. One reason for the difference is that each utility defines high voltage lines somewhat differently. PG&E defines all power lines at 60kV and above as transmission and includes them in the transmission revenue requirement, while SCE and SDG&E respectively include all lines above 200kV, and at 69kV and above in transmission revenue requirement. For this reason, transmission constitutes a larger percentage of PG&E and SDG&E’s costs than that of SCE.
Transmission revenue requirement for the three utilities have experienced varied annual growth rates since 2003. Individually, PG&E’s transmission revenue requirement increased at a 3.7% annual average, SCE’s at 14.9% and SDG&E’s at 2.7%.5
5 Includes Transmission Owner Ratecase Revenues, Reliability Services, Transmission Access Charges (TAC) and
CWIP (SCE only). Note each IOU has a different interpretation of what voltage level represents the line of demarcation between transmission and distribution.
Figure 2.7: Trends in Weighted Average Rate of Return
Figure 2.8: Trends in Return on Equity
Figure 2.9: Trends in Transmission Revenue Requirements6 0 200 400 600 800 1,000 1,200 2003 2004 2005 2006 2007 2008 2009 2010 ($ in m ill ions )
PG&E SCE SDG&E
6 Figure 2.9: Reliability Services was the largest contributor to the 2005 spike, which was due to intra-zonal
congestion costs (MLCC and MOO waivers) incurred in 2004, the result of congestion issues experienced at Sylmar and a lower SCIT limit. See CAISO 2005 Annual Report, April 2006, pgs. (6-5 and 6-7)
III. Power Procurement Costs
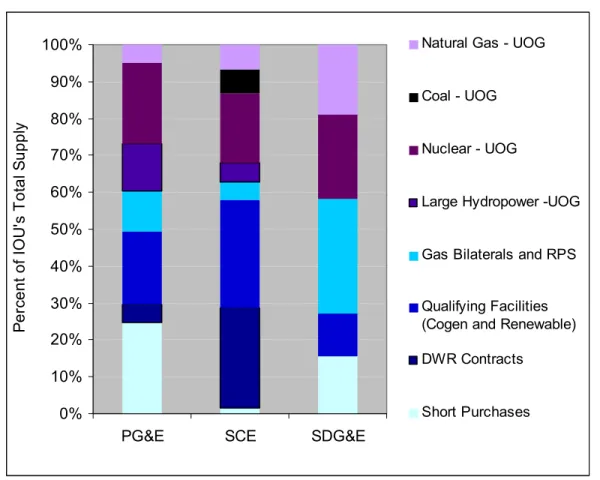
Generation revenue requirement includes all the revenue requirements associated with utility owned generating (UOG) facilities, discussed in Chapter 2, as well as purchased power costs. Upon electric restructuring, utilities divested almost all of their fossil fueled generating plants and have been relying mainly on purchased power for incremental electricity needs. In 2010, purchased power accounted for 71.4% of the total generation revenue requirement while utility owned generation revenue requirement comprised only 28.6%.
Out of total energy generation costs, power purchases represent the largest component,
accounting for 36.6% of the total revenue requirements. There is no mark-up for the utilities or profit in purchased power expenses. Recovery of these costs is authorized through the Energy Resource Recovery Account (ERRA) proceedings and not through the GRCs.
Figure 3.1: 2010 Energy Supply
0% 10% 20% 30% 40% 50% 60% 70% 80% 90% 100%
PG&E SCE SDG&E
P er cent of I O U 's T ot al S uppl y
Natural Gas - UOG
Coal - UOG
Nuclear - UOG
Large Hydropower -UOG Gas Bilaterals and RPS Qualifying Facilities (Cogen and Renewable) DWR Contracts
Short Purchases
Background
Heavy reliance on power purchases instead of utility owned power plants began with the enactment of AB 1890, which restructured the electric utility industry in California and created the Independent System Operator (CAISO) and the Power Exchange (PX). To create a
competitive electricity market where non-utility suppliers would compete with the utilities in the generation market, utilities were exhorted to divest at least 50% of their fossil generation. The CPUC provided a rate of return incentive to the utilities to encourage them to divest. As part of
this program, the utilities did divest themselves of a substantial part of their fossil-fueled generation.
During the Energy Crisis of 2000-2001, utilities were more exposed to spiking market prices for electricity, due to divestiture of generation. Authorized utility rates (which were frozen at pre-restructuring June 1996 levels) were no longer sufficient for the utilities to cover the high prices of purchased electricity; PG&E filed for bankruptcy and SCE and SDG&E both faced substantial financial uncertainty. Given the financial situation of the utilities in January 2001, the legislature enacted AB 1X, which authorized the Department of Water Resources (DWR) to enter into power purchase contracts to stabilize the energy markets.
In 2002, the legislature enacted AB 57 to return energy procurement responsibilities to the utilities. An essential component of the stability of energy markets was Resource Adequacy (RA)—the measure to ensure that the investor owned electric utilities would arrange for sufficient generation beforehand to meet load growth. The legislation also required the
Commission to adopt a Long Term Procurement Plan to ensure sufficient resource availability over time. Additionally, AB 57 established guidelines for procurement solicitations, cost
recovery of power purchases and integrating renewable resources into long term planning. Also, SB 1078 (2002) required the utilities to procure renewable resources as a percentage of their total retail sales. The statute also requires each IOU to hold an annual solicitation to procure power purchase contracts for renewable power.
As part of the reforms following the Energy Crisis, the CAISO has redesigned its market structure and rules. The initiative is called the Market Redesign and Technology Upgrade (MRTU). MRTU went operational in the spring of 2009. With MRTU, market price is
determined using many (approx 3,000) dispersed locations or nodes instead of the earlier zonal pricing system. It also established local market power mitigation in areas with constrained transmission capacity. These changes should make the electricity industry more efficient by accurately and transparently pricing generation and identifying areas where transmission upgrades may be cost effective.
Types of Purchased Power
DWR Contracts:These are long term contracts that the Department of Water Resources (DWR) entered into on behalf of the IOU’s customers during the Energy Crisis when the three largest investor-owned electric utilities were no longer creditworthy. Each year, DWR submits its revenue requirement with the Commission for adoption and subsequent collection from ratepayers through the DWR Power Charge. The total energy supply provided by DWR has been decreasing since 2003 as the contracts expire. The majority of the contracts will expire by 2012, and the final contracts are scheduled to expire by 2015. There is also a DWR bond charge that is collected separately in electric rates. As discussed further below, these bonds were issued to repay the money the State spent to purchase power during the early days of the Energy Crisis.
Qualifying Facilities (QFs):
Qualifying Facilities are generators that qualify to sell power to the utilities under the Federal Public Utilities Regulatory Policies Act (PURPA). These facilities have to meet the Federal Energy Regulatory Commission's requirements for ownership, size and efficiency to qualify as QFs. PURPA requires investor-owned utilities (IOUs) to interconnect with and purchase power from Qualifying Facilities (QFs) at rates that reflect costs the utility avoids by buying QF power instead of procuring power from other sources. In California, the avoided cost is the amount the utility would have incurred to build new gas-fired generation but for the existence of the QFs.7 Figures 3.2 and 3.3 break out QF supply and revenue requirements for cogeneration and
renewable energy. The renewable energy supply meets the requirements for the Renewable Portfolio Standard. The total energy supply provided by all Qualifying Facilities, cogeneration and renewable, has decreased by 11.7% since 2003 as older contracts expire, and the QF power related revenue requirement has decreased by 7.3% since 2003.
0 2 4 6 8 10 12 14 2003 2004 2005 2006 2007 2008 2009 2010 R ev enu e R equ ir em ent ($ B ill io n DWR Renewables--QF Cogeneration--QF Renewables--RPS Natural Gas Contracts Spot Market Purchases
-20 40 60 80 100 120 140 2003 2004 2005 2006 2007 2008 2009 2010 E lec tr ic S uppl y G W h ( 000 ) DWR Renewables--QF Cogeneration--QF Renewables--RPS Natural Gas Contracts Spot Market Purchases
Bilateral Contracts:
Bilateral contracts are the standard method for new energy procurement today. These contracts are entered into directly between the utility and an independent power supplier, which may be a generator or a trader. The utilities select new contracts through an open solicitation (Request for Offers or RFO) process, which is reviewed by “Procurement Review Groups” created within the CPUC’s procurement proceedings.
Bilateral contracts represent a larger part of the utility power procurement portfolio now as the utilities need to replace expiring DWR contracts as load grows. Because these are mostly long-term contracts, bilateral contracts cost more in c/kWh compared to spot market purchases and short term contracts. The revenue requirements from bilateral contracts have increased over 23.9% annually, and the average cost (c/kWh) for bilateral contracts has increased by 19.9%,
7 QF costs include Competition Transition Charges (CTC). For a breakout, see table in Appendix A.
Figure 3.2: Trends in Purchased Power Revenue Requirements
Figure 3.3: Trends in Purchased Power Supply (GWh)
making this the most costly form of energy procurement in the market.8 There are a few factors that, in combination, help to explain this trend. First, in 2004, Commission Decision 04-10-035 and 04-01-050 required LSEs to maintain a Planning Reserve Margin 15% above peak load for all months of the year, which increased the utilities’ capacity requirements. The increased capacity requirements are primarily met through contracts with natural gas fueled
generators. Because resources held in reserve are over and above expected load, they may not operate during the year, making them very expensive on a per kWh basis. Secondly, natural gas prices spiked in 2006 as a result of Hurricane Katrina in the Gulf of Mexico gas producing region. Although gas prices had dropped by 2009, the utilities’ 2009 revenue requirements did not drop accordingly because they were based on high gas price forecasts during 2008. Natural gas price volatility has reverted in recent years.
A significant amount of electric capacity is only needed for a few peak hours each year, as approximately 10 percent of electric demand occurs for less than 200 hours per year. Natural gas fueled generation is often the resource best able to supply peaking capacity. Peaking
capacity is generally higher in c/kWh cost because it is used in only few peak hours per year and thus costs are spread over fewer hours. Increased use of wind and solar generation increases the need for peaking capacity to fill in at times when the wind is not blowing or the sun is not shining.
Renewable Energy Procurement:
SB 1078 established the Renewable Portfolio Standard (RPS) in 2002, requiring the state to meet 20% of its electricity demand from Eligible Renewable Energy Resources by 2010, and to
maintain 20% renewables thereafter.9 Eligible resources include wind, solar photovoltaics, solar thermal, tidal wave, small hydroelectric, geothermal, biodiesel, biomass, and biogas. In 2008, Governor Schwarzenegger expanded the RPS by Executive Order, raising the renewables goal to 33% of the state’s energy requirements by 2020. The RPS mandate has made renewable energy central to the state’s core procurement planning. Renewable energy revenue requirements remain a relatively minor component in the total revenue requirement at present, 9.1% in 201010 because much of the contracted capacity has not come on line yet. Figures 3.2 and 3.3 show the
renewable energy revenue requirement and supply, respectively. Qualifying Facilities contracts comprise the majority of the RPS-eligible resources that are currently supplying the utilities, while new RPS-eligible resources are now generally procured through competitive contracts. As of 2010, the average cost of renewable energy is slightly above the prices of the remaining energy portfolio, as seen in Figure 3.4. The Commission forecasts that the cost for additional renewable sources will rise, as lower cost opportunities are exhausted and higher cost resources have to be tapped.
8 Bilaterals represent natural gas contracts only
9 The RPS was subsequently modified by SB 107 in 2006 and SB 1036 in 2007. 10 Renewable energy includes RPS and QF
Figure 3.4: Average cost of RPS eligible sources and total energy portfolio 0.05 0.06 0.07 0.08 0.09 0.10 0.11 2003 2004 2005 2006 2007 2008 2009 2010 A ve rag e C os t ( $ /k W h ) Renewable energy (RPS and QF) Total energy portfolio
Other Power Purchases:
There are additional power purchase mechanisms to ensure that the utilities have secured sufficient capacity to balance load across the grid and meet peak load requirements. These include both sales and purchases, which combined accounted for 6.2% of the revenue requirement in 2010.11
Capacity Contracts: The utilities are required to maintain a 15-17% planning reserve margin for generating capacity to handle unplanned outages and situations where actual peak load may be above the forecast. This means that all Load Serving Entities,
including utilities, have to make sure that they have 15% more capacity resources than their forecasted load.12 The resource adequacy requirement ensures that the IOUs have contracts that have reserved supply resources months in advance to ensure that the capacity will be available to meet their load.
Spot market purchases: The term spot market purchases broadly refers to power that the utilities buy from the CAISO’s Day-Ahead and Hour-Ahead markets to balance system on a day to day basis. IOUs use the spot market to balance their forecasted load requirement for the following day through transactions that may occur in the CAISO market or
independently. Spot market purchases accounted for 11% of the revenue requirement.
Net long sales: These are sales that the utilities make when they have more supply resources compared to their forecasted load. Such sales reduce ratepayer costs by selling excess
capacity not likely to be needed. In most years, their spot market sales are greater than the IOUs’ spot market purchases.
11Utility options for market transaction are defined in D. 02-10-062. A breakout of margin sales and purchases is
Confidential/privileged information pursuant to applicable provisions of D.06-06-066, G.O. 66-C and PUC Code Sec. 583 and Sec. 454.5(g).
Inter-utility Exchange Agreements: Traditionally, regulated utilities enter into seasonal and long-term inter-utility exchange agreements (IUE) with other regulated utilities and other load-serving entities. Through bilateral negotiation the specific terms are crafted to best fit the resources and needs of both parties. Payment is typically in the form of non-cash
exchanges of capacity and energy balanced to reflect the seasonal and locational value of the power. Different peaking times in the northwest and southwest lead to large-scale
transactions.
Real Time Market and Reliability Services: CAISO has certain agreements with generators to provide reliability services. The ISO spreads its costs of procuring these reliability services among the load serving entities. In addition, the ISO buys power in the real time market to balance the load and bills the load serving entity whose short supply necessitated the real time purchases.
Factors driving generation costs
Energy generation and procurement costs can vary significantly over time due to a number of factors that influence energy costs. Figure 3.5 shows the average costs of various types of purchased power.
Figure 3.5: Average Cost for Purchased Power13
0.00 0.02 0.04 0.06 0.08 0.10 0.12 0.14 0.16 0.18 2003 2004 2005 2006 2007 2008 2009 2010 $ / kWh 0.00 1.00 2.00 3.00 4.00 5.00 6.00 7.00 8.00 9.00 G as P ri ce ($ / M etr ic C u b ic F t) Natural Gas Contracts Renewables-RPS Renewables-QF Cogeneration-QF DWR Net Short Purchases Gas Price
The following factors influenced energy costs in 2010:
Peaking and firming capacity. Generation sources for peaking and firming load is gas-fired because gas-fired units are quick start units. Because peaking capacity is used only over a
13 The average cost for each resource represents both energy and capacity. On an energy-only basis, RPS exceeds
few peak hours in the year, the cost /kWh is high. Lately, the utilities have added such new peaking capacity to help meet overall capacity requirements. As a result, UOG natural gas fired generation cost is high.
Bilateral contracts. Bilateral contracts can be a higher cost resource since these are long term resources where the supplier tries to recover all costs of the generating plant through the single contract. In comparison, spot and short term purchases are sometimes lower because the supplier has an existing resource and is willing to sell at less than full cost to minimize loss. With the lessons learned from events leading to the Energy Crisis, the Commission and the Legislature have determined that it is not prudent for the utilities regulated by the
Commission to rely on spot market purchases excessively, but instead should have a more diverse portfolio. That is why the Commission requires long term resource planning and resource adequacy. The main reason spot market prices are lower is that the utilities are buying very little in the spot market, so there is more supply than demand in the spot market at times. One can also think of the higher price of long term contracts as a “hedging cost” or “hedging premium” over spot market prices to ensure certainty and stability of prices in the future.
Natural gas prices. Gas prices make natural gas generation more volatile than other forms of generation. Spot market purchases, DWR contracts, cogeneration QFs, natural gas bilateral contracts, and UOG natural gas generation have greater fluctuations than the other
generation. The cost of natural gas fired generation peaked in 2006 with the spike in gas prices after Hurricane Katrina. Gas prices have come down substantially since then.
Depreciation costs. Older, utility owned baseload generation costs less now because the utilities have already substantially recovered their investment in these plants. As a result, ratepayers do not have to pay high amounts of depreciation and rate of return on these assets any more. Because UOG hydroelectric, coal and nuclear facilities are all older plants their costs are between $0.032 and $0.053/kWh.
IV. Demand Side Management & Customer Programs
Demand Side Management involves various programs and activities on the customer side of the meter to curtail or shift demand for electricity through energy efficiency, demand response, and distributed generation. In 2003, the CPUC and the CEC adopted the Energy Action Plan to establish goals for the state’s energy strategy.14 The plan established that cost effective energy efficiency and demand response are at the top of the loading order--the preferred means for meeting the state’s growing energy needs--followed by renewable energy and distributed generation.
The revenue requirements for demand side management primarily consist of offering financial incentives through customer programs to encourage the development of demand side
management, and the administrative costs to manage these programs. In order to achieve the goals established in the Energy Action plan, spending on demand side management has experienced a 52% average annual increase since 2003, as CSI, AMI and demand response programs were initiated, and energy efficiency programs doubled in size. Cost/benefit studies have shown that in total, the collective costs of these programs are less than the financial savings created by reducing the demand for additional generation. In total, demand side management programs combined account for 5.7% of the total revenue requirement, however the revenue requirement does not incorporate the savings. For the most recent cycle, when savings are accounted for, demand side management programs collectively provide over $500 million annually in net savings15 to ratepayers.
In addition to demand side management, California also mandates customer programs to provide rate discounts and energy efficiency improvements for low-income customers.
Table 4.1: 2010 Demand Side Management and Customer Program Costs (000)
PG&E SCE SDG&E Total
Energy Efficiency: Public Goods Charge $120,670 $100,415 $35,640 $256,726 Energy Efficiency: Procurement charge $250,725 $297,252 $43,127 $591,104 Demand Response $84,528 $71,162 $16,585 $172,275
AMI $107,498 $93,599 $64,757 $265,854
California Solar Initiative $141,405 $110,000 $25,000 $276,405 Self Generation Incentive Program $30,186 $28,000 $10,035 $68,221
Total $735,012 $700,429 $195,144 $1,630,585
14 The Energy Action Plan was updated in 2005 and 2008.
15 Net Savings based on annual budgeted costs and benefits reported in Demand Response Cost/benefit Study Total
Energy Efficiency
In 2003, the California Energy Action Plan set energy efficiency at the top of the loading order, determining that the state should maximize all cost-effective energy
efficiency investment over both the short- and long-term. In D.04-09-060, the Commission translated this policy into specific annual and cumulative numerical goals for electricity and natural gas savings by utility service territory. These goals are updated periodically by the Commission as provided for in that decision. The Commission-adopted energy savings goals are expressed in terms of annual and cumulative gigawatt hours,
million-therms and peak megawatt load reductions. Prior to 2006, energy efficiency programs had largely been funded by the Public Goods Charge (PGC)16 as authorized by Public Utilities (PU) Code Sections 381 and 399. In addition to the energy efficiency budget
supported by the Public Goods Charge, additional funds for spending on cost-effective energy efficiency programs are also collected through the procurement component of rates. As a result, the aggregated annual budget for energy efficiency increased from $283 million in 2003 to $847 million in 2010. The Commission’s 2006-2008 Energy Efficiency Verification Reports have determined that the average annual ratepayer savings due to energy efficiency programs totaled $1.2 billion for the 2006-2008 funding cycle. The evaluated total resource cost (TRC) based cost-effectiveness ratio for the 2009 programs was 1.47, meaning that for every dollar spent on EE, $1.47 in benefits were received. California’s $786 million IOU ratepayer investment in energy efficiency for the 2009 Bridge Funding Period resulted in over 3,000 GWh, 28 million therms, and over 540 MW in energy savings for program participants in 2009.17 Approximately 60 percent of those savings would not have occurred without program intervention. The total budget for the 2010-2012 cycle is $3.1 billion. During 2010, there were 12 Statewide18 energy efficiency programs in California directed at residential, commercial, industrial, and agricultural sectors.
16 Public Good Charge established in D.04-09-060 17 Retrieved from the 2009 EE Evaluation Report, p.54
18 For 2010-2012, the Commission adopted 12 Statewide programs, but each of those programs has sub-programs.
All tolled, and inclusive of 3rd party and government partnerships, the total number of programs is over 200.
Figure 4.2 Annual Costs and Savings for Energy Efficiency
2010-2012 Budget Cycle 0 100 200 300 400 500 600 700
PG&E SCE SDG&E
C os t/ S av ings ( $ M ill ions )
Demand Response
Demand response is a resource where end-use electric customers reduce their electricity usage during peak periods or shift that usage to another time period, in response to a price signal, a financial incentive, an environmental condition or a reliability signal. Demand response saves ratepayers money by reducing the need to build power plants, or avoiding the use of older, less efficient power plantsthat would otherwise be necessary to meet peak demand. The reduction in peak demand also lowers the price of wholesale energy, and in turn, retail rates. Demand response goals are met through customer programs and metering infrastructure upgrades.
Demand Response customer programs: These programs are primarily aimed at large commercial and industrial customers that can shed load as an immediate or day ahead response. Customers are provided bill
credits or payments to participate in programs, and customers are called to curtail load on designated peak days. Demand response programs can meet the needs for system reliability, or peak capacity management. The 2009-2011 Cost/Benefit analysis found that demand response programs create a total ratepayer savings of $274 million annually. 19
Advanced Metering Infrastructure (AMI): The AMI initiative is a statewide effort to upgrade all customers to an electronically integrated network, which enables greater
communication and control system technologies to manage energy use. The benefits of AMI are threefold. By providing price and usage information, it helps the customers to make better-informed decisions about energy use so that they can optimize their electricity consumption and reduce their bills. Secondly, it lowers the utilities’ operating costs by reducing the need for manual meter reading. Third, it allows for faster outage detection and restoration of service by a utility when an outage occurs and therefore, less disruption to a customer’s home or business.
Distributed Generation:
Ratepayers fund two distributed generation programs that provide financial incentives to
participating customers. The cost/benefit study for distributed generation programs is a one-time report scheduled to be released in mid-2011. This is one component of a several-part cost effectiveness study also including net energy metering and the California Solar Initiative (CSI) program.
California Solar Initiative: Established in 2006, CSI provides both up-front payments as well as payments stretched out over the projects' first five years, based on performance, for the installation of photovoltaic solar systems for residential and commercial customers up to
19 Figure 4.3 reflects the budgets reported by PG&E, SCE and SDG&E for various DR programs including their
2009-2011 Demand Response Portfolio applications.
Figure 4.3 Costs and Benefits for Demand Response Programs
-20 40 60 80 100 120 140 160
PG&E SCE SDG&E
Co st /S a vin gs ($ M ill io n s)
1 MW. The CSI Program has a budget of $2.167 billion over 10 years, and the goal is to reach 1,940 MW of installed solar capacity by the end of 2016. In SDG&E service territory, the CSI program is being implemented by the California Center for Sustainable Energy (CCSE).
Self Generation Incentive Program (SGIP): Established in 2001, SGIP provides up-front, capacity-based incentives for the installation of eligible distributed energy resources which include fuel cells, wind turbines, and energy storage coupled with either of these two generators.
Low Income Programs
California IOUs provide two ratepayer-funded programs for low-income customers: CARE rate discounts and the Energy Savings Assistance Program.
Table 4.4: 2010 Low Income Program Expenses (000)
PG&E SCE SDG&E Total
CARE Discount $548,615 $228,440 $33,124 $810,179
CARE Administrative Expenses $7,448 $5,412 $2,177 $15,038 Low Income Energy Efficiency $90,044 $61,561 $11,272 $162,876
Total $646,107 $295,413 $46,573 $988,093
California Alternative Rates for Energy (CARE): The CARE program provides rate discounts for qualifying low-income customers. The rate discount was increased from 15% to 20% by Commission decision D.01-06-010 in 2001. In addition, during the Energy Crisis, legislation exempted CARE customers from certain DWR power costs and kept Tier 1 and Tier 2 residential rates frozen at pre-restructuring levels per AB 1X. Additionally, CARE customers do not have Tiers 4 and Tier 5 rates for high consumption levels as non-CARE customers do. As a result, the CARE discount increased substantially above 20% for CARE customers with usage above Tier 1 and Tier 2.
CARE costs have two components—CARE program administration cost and the cost of the discount itself. CARE program administration costs total approximately $20 million per year. The CARE discount is a much larger amount and is paid by non-CARE customers. A higher CARE discount does not result in a higher revenue requirement for the utility, but it does affect the rate that non-CARE customers pay. The PG&E CARE discount in 2010 was $548 million, compared to SCE at $228 million. A major reason that PG&E’s CARE discount is higher is that PG&E only has Tiers 1 and Tier 2 for CARE customers whereas SCE and SDG&E have three tiers, making PG&E’s CARE discount at high levels of consumption higher.20 CARE discount costs have had a 21% average annual increase since 2003.
Figure 4.5: Trends in Low Income Program Expenses -200 400 600 800 1,000 2003 2004 2005 2006 2007 2008 2009 2010 C o s t ( $ M illio n ) CARE Discount CARE Administrative Expenses
Low Income Energy Efficiency
Energy Savings Assistance Program:21 The program was mandated by legislation in 1990 as
PU Code 2790, which requires gas and electric corporations to perform home weatherization services for low-income households, and defines those services to include the installation of HVAC measures, lighting measures, water heating conservation measures, and infiltration measures which include caulking and weather stripping. Weatherization services may also include other building conservation measures, energy efficiency appliances and energy education programs. Energy Savings Assistance Program is considered a low-income program for
policymaking purposes, because the program’s purpose is to improve the welfare of California’s low-income population, by subsidizing and managing energy efficiency improvements for low income residences. The program accounts for 0.6% of the Revenue Requirement, and its net savings were included in the total savings calculated for the Energy Efficiency Verification Report.
V. Bonds and Regulatory Fees
The $1.2 billion revenue requirement for bonds constitutes the ongoing costs to ratepayers for the energy crisis of 2000-2001. During the era of electric restructuring, the State and the utilities issued a series of bonds to amortize ratepayer impacts of energy restructuring and the energy crisis related costs. Since the energy crisis, bond costs have decreased from a peak at $2 billion aggregated revenue requirement in 2004 to $1.2 billion in 2010.
Figure 5.1: Trends in Bond Expenses
0.0 0.5 1.0 1.5 2.0 2.5 2003 2004 2005 2006 2007 2008 2009 2010 R even u e R eq u ir emen t ( $ B
illion) EnergyRecovery
Bonds Rate Reduction Bonds DWR Bond Charges
Rate Reduction Bonds were issued is 1998 and paid back in full in 2007. AB 1890, the
legislation that established the terms of Energy Restructuring, authorized these bonds to provide an immediate reduction in electric rates. Among other things, the legislation froze electric rates at their June 1996 levels, and reduced rates for residential and small commercial customers by 10%.
DWR Bonds were issued by the California Department of Water Resources in 2003 to recover costs incurred by the State of California during the energy crisis. A $7.9 billion balance remains outstanding on the DWR bonds, to be repaid by 2022.22
Regulatory Asset/ Energy Recovery Bonds: As part of the CPUC and PG&E bankruptcy settlement agreement, PG&E was authorized to recover $2.1 billion as a Regulatory Asset. The Energy Recovery Bonds were issued by PG&E in 2003 to reduce the financing cost of the Regulatory Asset to ratepayers. But for the bonds, the Regulatory Asset would be financed at PG&E’s weighted cost of capital which was higher than the cost of debt. The Energy Recovery Bonds are due to mature in 2012.
Table 5.2: 2010 Bond Expenses (000)
PG&E SCE SDG&E Total
DWR Bond Charges $411,133 $391,013 $96,861 $899,007
Rate Reduction Bonds $0 $0 $0 $0
Energy Recovery Bonds $437,282 n/a n/a $437,282
Total $848,415 $391,013 $96,861 $1,336,289
Fees, Incentives and Voluntary Programs:
Fees include a variety of charges levied by federal, state and local governments. For example, the CPUC fee reimburses the state for the cost of regulating the utilities. Incentives offer a financial inducement for utilities to achieve certain policy goals that may not be effectively accomplished through regulatory directives alone. An example is the Risk/Reward Incentive Mechanism (RRIM) for promoting energy efficiency and the Performance Based Ratemaking (PBR)
incentives. Voluntary programs such as the Climate Smart program are non-mandatory programs that the utilities offer to customers who want to do more for the environment than the various mandated programs. In total, this entire category of expenses accounted for 0.92% of the Revenue Requirement in 2010, a total of $232 million.
Table 5.3: 2010 Regulatory Fees
PG&E SCE SDG&E Total
Fees $0
CPUC fee* $20,645 $20,024 $0 $40,669
Environmental Enhancement $10,103 $0 $0 $10,103
Research and Development and
Deployment $35,218 $28,244 $6,210 $69,672
Nuclear Decommissioning $25,697 $45,929 $9,350 $80,976
Spent Nuclear Fuel $0 $6,603 $948 $7,551
DOE D&D Fees $0 $0 $0 $0
Nuclear Decommissioning FF&U $0 $609 $110 $719
Incentives $0
AEAP Incentive $0 $25,652 $0 $25,652
Non-Utility Affiliate Credit/RCRA Offset $0 ($11,132) $0 -$11,132
Performance-Based Regulations $0 $0 $0 $0
Franchise Fee & Uncollectible Surcharge $0 $8,451 $0 $8,451
Voluntary Programs $0
Low Emission Vehicle Program $0 $0 $0 $0
Climate Smart $0 $0 $0 $0
Total $91,662 $124,380 $16,618 $232,660
* SCE and SDG&E do not include the CPUC fee in the consolidated Revenue Requirement, and instead collect the fee as a separate charge on the utility bill.
Definition of Fees:
CPUC Fee: This is the annual fee to recover the CPUC’s operating costs.
Franchise Fees: Fees paid by a privately owned utility to cities and counties for the right to use or occupy public streets, roads, and for permission to provide service in their
jurisdictions. These fees are then redistributed to the cities and counties.
Uncollectibles: Includes accounts receivable that have defaulted or cannot be collected
Nuclear Decommissioning: Nuclear decommissioning funds are established for the safe removal of nuclear facilities from service and the reduction of residual radioactivity to a level that permits termination of the NRC license and release of the property for unrestricted use.
Catastrophic Events Memorandum Account: An account established to enable a utility to recover the costs associated with the restoration of service and utility facilities affected by a catastrophic event (e.g. an earthquake) or state of emergency declared by competent federal or state authorities.
Hazardous Substance Mechanism (HSM): An account that provides a mechanism for allocating historical hazardous waste costs (such as from old-time coal to gas plants) among shareholders and ratepayers, including the allocation of insurance recoveries, if any.
Environmental Enhancement: A (PG&E only) program established by the PG&E bankruptcy settlement to provide environmental enhancement of a dedicated watershed, which was donated to a public trust as part of the settlement.
Non-Utility Affiliate Credit/ Reduced Capital Recovery Amount (RCRA) Offset:
Mechanism that initially provided for additional annual nuclear depreciation expense of $75 million, which was offset by suspending annual distribution depreciation expense of $75 million, in accordance with D.94-05-068. Requirement was modified by D.99-10-057, and D.02-04-016.
Incentives:
Annual Earnings Assessment Proceeding(AEAP) Incentive: Incentives received by a
utility, based on a portion of the net present value of the savings achieved by ratepayers participating in energy efficiency programs.
Performance-Based Regulation Incentive: The mechanism enables the investor owned utilities to earn rewards on energy efficiency programs in amounts comparable to what the companies would otherwise earn through supply side investments. The decisions establish a performance standard for the utilities, under which the utilities earn incentives if their energy efficiency program portfolios achieve certain quantitative energy efficiency savings goals.
Voluntary Programs:
Climate Smart: (PG&E only) A voluntary program where PG&E customers can elect to pay a monthly premium to offset greenhouse gas emissions associated with energy usage. Program administrative and marketing costs are recovered through distribution rates.
VI. Natural Gas Utility Ratepayer Costs
The CPUC determines the reasonableness of operational costs, cost allocation among customer classes and rate design for Pacific Gas and Electric Company (PG&E), Southern California Gas Company (SoCalGas) and San Diego Gas and Electric Company (SDG&E). Unlike electricity, the CPUC does not set an annual authorized revenue requirement for gas procurement costs. Core gas procurement costs are recovered in utility gas procurement rates which are adjusted monthly.
Natural gas utility costs may be categorized into the following three main components: 1) core procurement costs, 2) costs of operating the natural gas utility system and providing customer services, and 3) costs associated with gas public purpose programs (PPP).
Table 6.1: 2010 Gas Revenue Requirement Summary by Key Components (000)
PG&E SoCalGas SDG&E Total
Core Procurement $2,327,868 $1,656,802 $202,211 $4,186,881 Transportation $1,541,446 $1,880,826 $299,774 $3,722,046 Public Purpose Programs $246,480 $269,412 $37,568 $553,460
Totals $4,115,794 $3,807,040 $539,553 $8,462,387
For 2010, total natural gas utility costs have increased moderately from last year, but are still lower than the previous five years, due primarily from a significant decrease in the price of natural gas since mid-2008. As the tables below show, cost trends for transportation and public purpose programs show moderately steady increases year to year since 2006.
Figure 6.2: Trends in Gas Utility Revenue Requirements
-2 4 6 8 10 12 2006 2007 2008 2009 2010 R even u e R eq u ir em en ts ( $B ill io n )
Figure 6.3: Trends in Gas Utility Revenue Requirement Components -2 4 6 8 10 12 2006 2007 2008 2009 2010 R even u e R eq u ir em en ts ( $B ill io n s)
Core Procurement Transportation Public Purpose Programs
Table 6.4: Historic Gas Utility Revenue Requirement Summary (000)
2006 2007 2008 2009 2010 Core Procurement $6,011,301 $5,410,391 $5,753,175 $3,647,509 $4,181,481 Transportation $3,441,321 $3,464,554 $3,595,241 $3,556,641 $3,722,046 Public Purpose Programs $443,860 $375,358 $429,897 $531,482 $553,460 Total $9,898,488 $9,252,310 $9,780,321 $7,735,632 $8,456,987
Table 6.5: Percent Change in Gas Utility Revenue Requirements (2006 to 2010)
Core Procurement Transportation Public Purpose Programs
PG&E -24% 13% 22%
SoCalGas -68% 4% 17%
SDG&E -74% 3% 27%
Core Gas Procurement
The major natural gas utilities recover procurement costs as a component called the gas
procurement rate. The gas procurement rate is changed every month to reflect the most current price of natural gas. The procurement rates are changed routinely through utility advice letter filings with the CPUC. Core gas procurement costs in 2010 increased by 15% over last year, but remain relatively low compared to the five year average. Overall, natural gas core procurement costs have decreased by 30% since 2006. In 2010, the core gas procurement costs were about 49% of the total utility gas costs.
Although core gas customers--primarily residential and small commercial customers--in California have the option to choose a non-utility natural gas supplier, natural gas utilities in California provide procurement service for over 95% of core customers. Almost all larger, “noncore” natural gas consumers--industrial customers or electric generators--procure their own natural gas supplies using non-utility suppliers.
Core procurement costs include the various costs associated with procuring natural gas supplies for a utility’s core gas customers, such as the cost of the commodity, interstate pipeline capacity
costs, and other costs. The major component of core procurement costs is the cost of the commodity itself.
Due to a significant decrease in the price of natural gas since mid-2008, the state’s natural gas utilities’ procurement costs have drastically fallen since mid-2008. As the following table shows, natural gas utility procurement costs are at their lowest level in recent years. This has resulted in the lowest total core gas procurement rates in at least the last five years.
Neither the Commission nor the FERC regulates the wholesale price of natural gas. The
decrease in the price of natural gas has resulted from developments in the natural gas commodity market.
Figure 6.6: Revenue Requirements for Utilities Natural Gas Core Procurement
0.0 0.5 1.0 1.5 2.0 2.5 3.0 3.5 2006 2007 2008 2009 2010 $ B illi on s
PG&E SDG&E SoCalGas
Table 6.7: Historic Revenue Requirements for Core Procurement Summary (000)
2006 2007 2008 2009 2010
PG&E $2,879,519 $2,705,231 $3,022,339 $2,020,976 $2,327,868 SoCalGas $2,779,781 $2,331,536 $2,330,774 $1,441,099 $1,656,802 SDG&E $352,001 $373,624 $400,062 $185,434 $202,211
Total $5,659,300 $5,036,767 $5,353,113 $3,462,075 $3,984,670
Gas Transmission, Distribution and Storage costs
The Commission authorizes natural gas distribution utilities’ revenue requirements for operating their extensive natural gas transmission, distribution and storage systems and for providing various customer services. These costs have moderately increased in recent years. In 2010, gas transportation costs were about 44% of the total utility gas costs. The bulk of these revenue requirements are primarily determined by the CPUC in two types of major proceedings: general rate cases for PG&E, SoCalGas and SDG&E, and PG&E transmission and storage proceedings. The following table shows that total authorized revenue requirements for transmission,
distribution, storage, and customer services, combined under the “transportation” category, have been fairly steady in recent years, increasing by 8% from 2006 through 2010. Overall, each of the three utilities showed moderate increases from 2009 to 2010. In total, the distribution costs increased by 5% from last year.