Abstract:
SMEs are crucial for economic health in both high and low-income economies worldwide. In Brazil, they are responsible for around 50% of the national GDP. However, SMEs face considerable barriers such as difficulties in financing international activity, identifying opportunities and making appropriate contacts in their target markets. This paper investigates the adherence of both lean and green practices for the development of new products (NPD), as means to improve their efficiency (lean perspective) and manufacture environment-friendly products (green perspective). Through a systemic review, we present 16 lean and green enablers for NPD operations: 1-continuous improvement, 2-cross-project knowledge transfer, 3-definition of value and value stream, 4-ecodesign tools and green dynamic capabilities, 5-knowledge and learning, 6-life cycle assessment, 7-materials selection, 8-process standardization, 9-product variety management, 10-rapid prototyping, simulating and testing, 11-responsibility-based planning control, 12-set-11-responsibility-based engineering, 13-simultaneous engineering, 14-specialist career path and workload levelling, 15-strong project manager, and 16-supplier integration. These elements comprise a structure of building blocks to evaluate lean and green practices. Thus, we propose a model that ranks the incidence of these practices regardless of the NPD organization level. Using two MCDM tools: AHP and fuzzy-TOPSIS, each enabler is evaluated considering the SMEs context in Brazil. Firstly, AHP defines the relative importance of 14 SMEs´ characteristics. Secondly, we applied an expansion of the TOPSIS technique, adequate when the values of each alternative are not clearly determined. Therefore, we organized a structured interview consisting of 224 evaluations made by the SMEs´ NPD stakeholders. We carried out this diagnosis in three companies from southern Brazil, analysing their NPD operations, which is useful to stablish a future improvement agenda.
Keywords: new product development, NPD, lean NPD, green product development, GPD, multicriteria evaluation, AHP, fuzzy-TOPSIS.
1. Introduction
A substantial amount of work has been done to assess the role that small and medium sized enterprises (SMEs) play in GDP growth and employment. SMEs are crucially important for economic health in both high and low-income economies worldwide. Evidence also demonstrates that when SMEs become internationalized, their contribution to their home
economy increases. Considerable barriers need to be overcome by SMEs, since they can face difficulties in financing international activity, identifying opportunities and making appropriate contacts in their target markets (EdinburghGroup, 2014).
In developing countries, as is the case of Brazil, there is an indication that earnings rise with firm size for workers with similar characteristics. Moreover, jobs in SMEs are less stable and secure than those in larger enterprises. Additionally, SMEs are less likely to offer training to their workers compared to large firms. Finally, SMEs contribute comparatively less to GDP than to employment, because they are, on average, less productive than large firms (WTO, 2016). WTO also estimates that SMEs in developing countries are 70% less productive than large companies. The lower productivity is often attributed to SMEs´ inability to take advantage of economies of scale, the difficulties they face in getting access to credit or investment, the lack of appropriate skills, and their informality.
SMEs are responsible for around 50% of Brazil´s GDP (SEBRAE, 2014). The relative importance of SMEs is negatively correlated with economic growth. In addition, the human capital embodied in SMEs may be more important for economic growth than their relative size (Cravo, 2012). Motivated by SMEs´ strategic importance for emerging economies, this paper investigates the adherence of both lean and green practices for the development of new products (NPD), as means to improve their efficiency (lean perspective) and manufacture environment-friendly products (green perspective). The research questions are:
- Which are the practices, in the SMEs´ context, that promote the lean and green integration in NPD operations?
- How can these practices, grouped as enablers, be addressed considering SMEs´ characteristics?
This paper has the following structure. In section 2 we identify, through a systematic literature review, which are the lean and green enablers for NPD. In section 3 we propose a lean and green evaluation model for NPD operations in SMEs based on these enablers. The methodology involves the use of multiple criteria decision making (MCDM). In section 4, using this model, we present three case studies, explaining how SMEs may assess their NPD operations from the point of view of both efficiency (lean) and environmental responsibility (green). Finally, section 5 summarizes the results, as well as presents the implications of future research.
2. Lean and Green for NPD
Researchers in lean and green have been using systematic literature reviews (SLRs) to support their research questions. It is possible to identify precise results of systemic studies such as the examination of existing gaps and the basis for the definition of terms and concepts (Baumann et al., 2002; De Medeiros et al., 2014; Garza-Reyes, 2015; Gosling and Naim, 2009; Johansson and Sundin, 2014; Morioka and de Carvalho, 2016). SLR is a method whose purpose is to select relevant studies from a particular field of interest, evaluating them objectively to extract evidence and contributions (Denyer and Tranfield, 2009). Also, systemic reviews support the development of concepts from a large number of previous studies and translate a research question into a bibliographical portfolio (Tranfield et al., 2003). Therefore, a theoretical basis is constructed from relevant knowledge with precision, transparency and scientific rigor (Tranfield et al., 2003). In our case, we used the SLR strategy to identify the lean and green enablers in the NPD context, aiming to deliver replicable, exclusive and aggregative research results.
Based on Denyer and Tranfield (2009), this review is developed in five steps: i) research questions formulation, ii) locating studies, iii) study selection and evaluations, iv) analysis and synthesis, and v) reporting and using results. The introduction (section1) presents the research questions (step i). We describe steps ii, iii, and iv subsequently in this section. The fifth step is the proposition of an evaluation model in section 3.
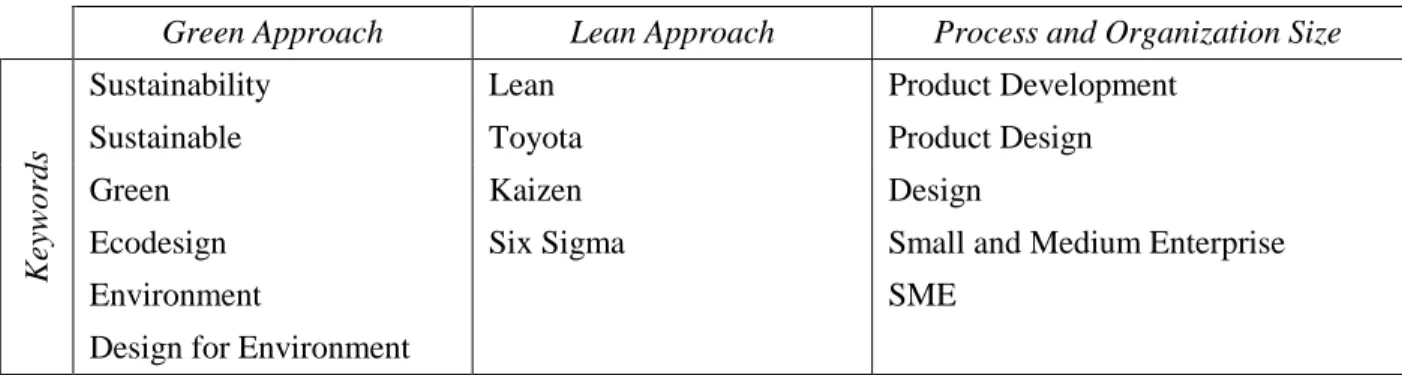
In ii) locating studies we selected the databases ScienceDirect and Scopus, restricting the search to the last ten years and publications with keywords in the titles and/or abstracts. According to Figure 1, we adopted the advanced search method, defining the type and year of publication. The query string input method (field codes) is chosen in both databases through the search fields used to specify the terms of interest. The three research axes (knowledge domains) are I- green approach, II- lean approach and III-Process and organization size. These axes comprise clusters of keywords. Thus, each of them has its respective keywords (search strings). Table 1 shows the combination of these keywords. We previously tested such combinations in the databases, which were inspired by previous systematic reviews of (Baines et al., 2006; Baumann et al., 2002; Johansson and Sundin, 2014; Martínez León and Farris, 2011).
Table 1. Research Axis (Knowledge Domains)
Green Approach Lean Approach Process and Organization Size
K
ey
w
ords
Sustainability Lean Product Development
Sustainable Toyota Product Design
Green Kaizen Design
Ecodesign Six Sigma Small and Medium Enterprise
Environment SME
Design for Environment
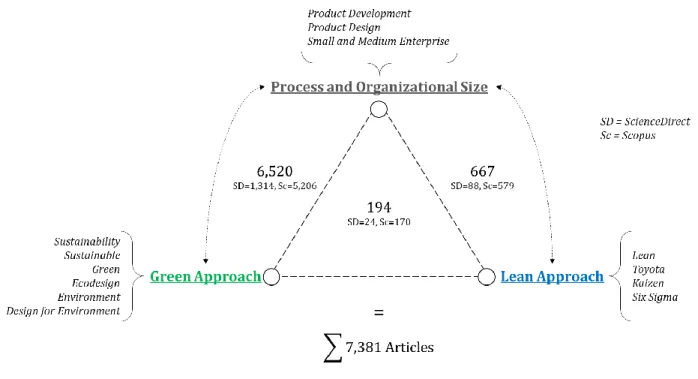
The combinations of the 15 keywords totalled 102 searches, which resulted in a collection of 7,381 articles. Initially, we combined the first two axes with the third, according to Figure 2. Combining the keywords of the green approach with processes and size of the organization, we found 6,520 publications. Similarly, the combination of the lean approach keywords with processes and organization size resulted in 667 items. Finally, to connect the three axes simultaneously, we combined all keywords, which resulted in 194 articles.
Figure 2. Locating studies step.
In iii) study selection and evaluations, six filters reduced this vast portfolio to a collection of publications aligned with the research questions. The first filter discarded duplicate items, which mostly occurred through synonyms, such as 'Small and Medium Enterprises' and SMEs, as well as 'Design for Environment' and DfE. This first filter reduced the initial collection to 4,146 publications. The terms lean and green are used in areas such as health, biology, agriculture, and chemistry, whose observed content is more focused on technology. Thus, the second filter, discarding items from these areas, resulted in 3,567 articles. The third filter excluded publications on lean and green related to SMEs, which instead of explicitly focusing on product development operations, were linked to supply chain and manufacturing operations, reducing the portfolio to 3,170 articles.
A crucial point of the systematic review, the fourth filter eliminated the articles by reading titles and abstracts. We discarded items that dealt with themes not aligned with our research objectives, dealing with specific unrelated issues. This process was the most exhaustive
filter, reducing the portfolio to 235 publications. Therefore, we ranked them according to the number of citations. Articles cited less than ten times were excluded. Thus, the fifth filter reduced them to 78 publications.
Through a 5-point Likert scale, the sixth filter compacts the number of publications to 18, keeping articles with a maximum score, by reading the whole documents. This criterion eliminated items not aligned with the research questions, considering: (1) ‘not aligned’, (2) ‘slightly aligned’, (3) ‘partially aligned’, (4) ‘moderately aligned’ and (5) ‘extremely aligned’. Among the articles discarded, we reassessed the articles ‘partially aligned’ and ‘moderately aligned, reincorporating six articles.
iv) analysis and synthesis correspond to the extraction and treatment of information from these papers. This step begins by classifying the publications that address lean (11), green (11), and both (2). Next, we listed the tools and techniques that involve these approaches in product development. This set of artifacts subsidized the conversion of the portfolio into the elements of a framework. Among the tools listed, the most important are the use of checklists to manage product development, the standardization of operations during the development process, the use of life-cycle assessment to quantify the impacts associated with products, processes, and the classic tools from the lean and green literature.
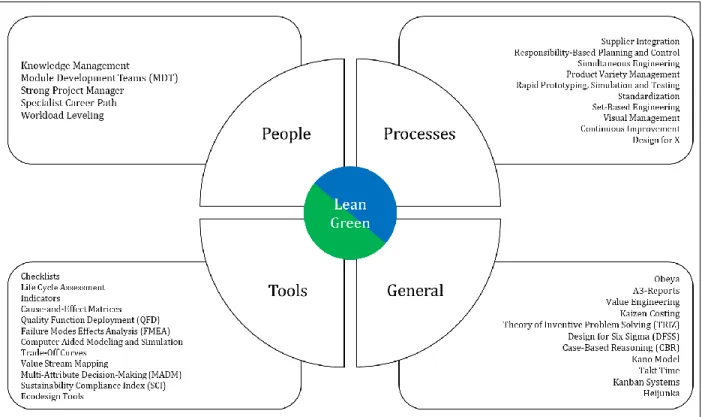
Figure 4 groups all the techniques and procedures observed in four dimensions (general, processes, people, and tools), following the classification of Johansson and Sundin (2014). In this framework, it is possible to identify the scope of each procedure involved in NPD. We emphasize that in this classification we assign them considering the best adherence of each element to one of these dimensions. Among these techniques and procedures are several tools
from Toyota's product development, such as a strong project manager (Hoppmann et al., 2011; Khan et al., 2013; Martínez León and Farris, 2011; Wang et al., 2011), process standardization
(Hoppmann et al., 2011; Nepal et al., 2011; Welo, 2011) specialist career path and workload levelling (Hoppmann et al., 2011). On the other hand, classic lean manufacturing tools are also adequate to the NPD, and are therefore lean applications in this new context, such as value engineering and value stream mapping (Anand and Kodali, 2008; Johansson and Sundin, 2014; Khan et al., 2013; Letens et al., 2011; Martínez León and Farris, 2011; Tyagi et al., 2015b; Wang et al., 2011; Welo, 2011), and continuous improvement (Anand and Kodali, 2008; Nepal et al., 2011; Welo, 2011).
The tools and techniques (Figure 3) are the operational means to achieve the lean and green in NPD. There are similarities between these tools and their objectives. As examples: (i) obeya (big rooms) technique and module development teams (MDT) facilitate the adoption of simultaneous engineering; (ii) A3 reports and trade-off curves try to maximize the cross-project knowledge transfer; and (iii) quality function deployment (QFD) and value stream mapping (VSM) work on mapping and creating customer value. Based on these convergences and similarities, we grouped these tools (Table 2) to identify the general characteristics, which we call 'enablers' (Figure 4), which promote lean/green in NPD operations. These groups of tools (enablers), analogous to Khan et al. (2013), structure the building blocks of the lean and green NPD model for SMEs. In our opinion, this measure, besides organizing the information of the SLR, is adequate to evaluate such characteristics in small companies. As there are several tools, the use of these enablers allows mapping the lean/green practices in these companies.
Figure 3. Lean and Green techniques and procedures.
Table 2. The Enablers, Related Tools and Techniques
The Lean-Green Enablers Related Tools and Techniques
① Continuous Improvement
Knowledge Management Continuous Improvement Kaizen Costing
Indicators
Design for Six Sigma (DFSS)
② Cross-Project Knowledge
Transfer
A3-Reports Checklists
Trade-Off Curves
③ Definition of Value and Value
Stream
Value Stream Mapping (VSM) Takt Time
Value Engineering Kano Model
Quality Function Deployment (QFD) Design for Six Sigma (DFSS)
Cause-and-Effect Matrices
④ Ecodesign Tools and Green
Dynamic Capabilities
Ecodesign Tools
Sustainability Compliance Index (SCI) Design for X
⑤ Knowledge and Learning Case-Based Reasoning (CBR)
Theory of Inventive Problem Solving (TRIZ)
⑥ Life Cycle Assessment Life Cycle Assessment tools
⑦ Materials Selection Cause-and-Effect Matrices
⑧ Process Standardization A3-Reports
⑨ Product Variety Management Standardization
Product Variety Management Procedures
⑩ Rapid Prototyping, Simulating
and Testing
Computer Aided Modelling and Simulation
Rapid Prototyping, Simulation and Testing Procedures
⑪ Responsibility-Based Planning
Control
Visual Management
Responsibility-Based Planning and Control Procedures Kanban Systems
⑫ Set-Based Engineering
Set-Based Engineering Procedures
Multi-Attribute Decision-Making (MADM) Failure Modes Effects Analysis (FMEA)
⑬ Simultaneous Engineering
Module Development Teams (MDT) Obeya
Simultaneous Engineering Procedures Design for Six Sigma (DFSS)
Kanban Systems
⑭ Specialist Career Path and
Workload Levelling
Heijunka
Specialist Career Path Workload Levelling
⑮ Strong Project Manager Value Chief-Engineer
⑯ Supplier Integration Supplier Integration Procedures
The losses reduction is a consequence of the endless search for process improvement, efficiency increase, and striving for perfection (Welo, 2011). These activities lead to continuous improvement, which must regularly be promoted in organizations, representing a metastable system, i.e., the way in which these improvements occur should not be abrupt and punctual, but longitudinal and gradual (Womack et al., 1990). Concerning NPD operations and regardless of the organization size, this lean element fits in as a verification step. The pursuit of perfection occurs through the adoption and subsequent verification of potential solutions in pilot projects. Gantt charts, performance indicators, audits and benchmarking are some tools that assist the implementation and verification process (Anand and Kodali, 2008). In addition to using these tools, continuous improvement also lies in understanding the relationships and trade-offs between waiting time, product performance, development and production costs, and business performance, and then identifying which points to intervene (Welo, 2011).
The teams may use the accumulated experience of best practices from previous projects to design new products. That is, although a product is innovative, some of its subsystems have solutions already known, tested and validated. In this sense, cross-project knowledge transfer
knowledge. Hoppmann et al. (2011) argue that these systematic actions range from simple checklists to sophisticated tools such as web-based repositories. The success of using these procedures is contingent upon the number of barriers (which should be minimal) to update this information. In the context of SMEs, the use of checklists is welcome due to the limitation of human resources, because there are not enough collaborators for replication of all the best practices and prevention of faulty solutions.
The definition of value in NPD translates into ideal processes where products are designed from the customers´ needs, with good quality, reduced manufacturing costs and adequate time to market (Anand and Kodali, 2008). Definition of value and valuestream come from the context of lean manufacturing and should be evaluated cautiously in NPD. While the losses and value are explicit and measurable in manufacturing, there is no precise separation between them in NPD (Welo, 2011). For example, in observing the value flow in production, iterations are considered losses, whereas in NPD, successive and coordinate iterations translate into value (Tyagi et al., 2015a). Restricting value generation to SMEs, Matt and Rauch (2013) identify value streaming mapping (VSM) as a successful method applied in small businesses. This tool explores the generation and definition of value through tools such as brainstorm, fishbone diagrams, fault tree analysis, 5-why´s, failure mode and analysis of effects, and Pareto diagrams (Tyagi et al., 2015b).
There is a synergic relationship between green and lean. Both, in the context of high competitiveness, seek to reduce costs and minimize the use of resources. Green systems pursue this efficiency by designing products with eco-friendly components (Vinodh and Rathod, 2010). In NPD, both concepts also aim to reduce waste, although with a different focus. Lean emphasizes waste regarding operations that do not add value to the products, whereas the green
approach denotes physical losses, observing the materials and the maximization of their use, as well as reuse and recycling practices (Johansson and Sundin, 2014).
Ecodesign tools and green dynamic capabilities are means to achieve these objectives. Bovea and Pérez-Belis (2012) proposed a classification of ecodesign tools according to their approaches: qualitative, semi-quantitative and quantitative techniques, which range from checklists to complex matrices that involve inputs in ERP software, manufacturing processes, and product development, as well as life cycle analysis (LCA). Ecodesign tools facilitate the integration of environmental needs into the NPD process. The application of these tools varies according to the complexity, quality and time required for their implementation. Regarding the application of these tools in the SMEs´ context, Chen and Chang (2013) observed that the improvement of green dynamic capabilities and green transformational leadership positively influence the products´ performance concerning the environment.
Knowledge and learning are associated with the ability of organizations to retain tacit knowledge to apply it in their NPD operations, i.e., knowledge should belong to the organization and not to a department or a project team (Welo, 2011). This enabler also stands out for SMEs, since human resources are relatively scarce when compared to large companies. SMEs lacking this capacity may lead to a gap in their NPD processes, intensified by the employees´ turnover. Thus, in a lean approach, the tacit knowledge of an engineering experience must always be transferred to the next generations of project team collaborators through active learning, continuously questioning the reasons for their decisions and turning checklists into playbooks.
NPD and its inherent design and development activities should determine all the consequences of the products´ usability. Life cycle assessment (LCA) integrates environmental issues with the effects of products, from manufacturing to their final disposal (Gmelin and
Seuring, 2014). Focusing on green products, Johansson and Sundin (2014) organized several studies that use LCA in NPD, using metrics such as energy use, toxicity, recyclability, etc. Thus, combining all the environmental aspects that arise in the steps of a conventional NPD, Wang et al. (2015) proposed an LCA approach that involves the initial design stages and their consequences throughout the life of a product: materials selection, manufacturing, distribution, usage, and end-of-life. A complete assessment of the environmental issues, still in the design phases, demands time, resources, and massive use of data that are often outside companies (Baumann et al., 2002; Gmelin and Seuring, 2014). In the case of SMEs, simplified LCA methods may overcome this barrier and lead to satisfactory results (Daddi et al., 2016; Kurczewski, 2014; Moreno et al., 2011; Vinodh and Rathod, 2010; Witczak et al., 2014).
Materials selection is associated with LCA, ecodesign tools and green dynamic capabilities, since the consequences of a correct determination of materials influence the recycling and disposal operations in the natural environment. In NPD, choosing materials is a starting point for adopting green practices, adding environmental requirements. In the multicriteria method for adopting green practices in the NPD of Wang et al. (2015), the first phase consists of material selection. Similarly, Zarandi et al. (2011) proposed a simplified methodology for the materials selection, filtering the alternatives through the green approach. This tool fits well with the reality of SMEs because it requires small databases.
Process standardization, whose roots are in lean manufacturing, has multiple objectives: high productivity, balanced lines, a minimum level of work-in-process inventory, and reduced variability (Nepal et al., 2011). In an NPD environment, it consists of standardizing all periodic activities, as well as defining a sequence of evaluation steps (gates) (Hoppmann et al., 2011). This enabler has a healthy relationship with continuous improvement, since striving for
perfection holds a way to maintain the stability of the achieved gains in standardization. Consequently, it also has an intimate connection with definition of value and value stream, since standardizing eliminates or prevents losses, maximizing value generation (Welo, 2011).
Product variety management consists of standardizing parts, modules, and sub-assemblies. Make-or-buy analyses convert manufactured items into purchased ones, making use of commodities (bolts, bearings, etc.), reusing existing components, and defining modular components and product platforms. The adoption of these practices, whenever possible, reduces the total project time, excluding the period of testing, validation, and manufacturing related to these components/systems (Hoppmann et al., 2011). The standardization of parts/systems due to this enabler offers extra benefits to NPD processes, such as improving the project flow. However, the implementation of standardization at the engineering level requires an analysis of previous, ongoing and future projects (Letens et al., 2011). Considering the difficulties inherent to SMEs, critical components may be available and reserved as a contingency, since they are used/shared in distinct projects.
There are many uncertainties during the early stages of NPD, both over market expectations and the engineering design. The lean approach in NPD advocates the use of physical prototypes from the initial stages of the development process to verify both product acceptance and validation of integration between modules and subassemblies, as well as to test failure modes (Hoppmann et al., 2011; Nepal et al., 2011). At the engineering level, the required iterations are closely linked to the use of rapid prototyping, simulation and testing, converging to the final product. If correctly applied, the adoption of virtual prototypes (CAD) is encouraged to validate both the geometric issues and failure modes of some components (Letens et al., 2011).
In SMEs, this option is particularly welcome since they have limited resources for their NPD operations.
Responsibility-based planning control relates closely to the inherent characteristics of SMEs. In vertical planning, the project team does not have access to the overall schedule. Otherwise, in the control of plan based on individual responsibility, managers define the milestones, while the project team is autonomous to program its workflows, estimate the duration of activities and give feedback to managers on the feasibility of the proposed schedules (Hoppmann et al., 2011). On the other hand, the participation of the project team is not limited to the elaboration of schedules, but also to decisions related to product development and problem solving (Khan et al., 2013).
Set-based engineering means to consider sets of projects and solutions throughout the development, and discarding, under multiple criteria, those solutions that are inferior to the others (Hoppmann et al., 2011; Letens et al., 2011; Martínez León and Farris, 2011). This approach, in a lean perspective, minimize the uncertainties, since instead of converging fast to a project under a single idea/concept, set-based engineering evaluates a group of hypotheses. Due to the iteration cycles inherent to NPD, and by observing the alternatives, engineers should consider the use of virtual prototyping, reducing costs of physical structures. Generally speaking, set-based engineering avoids 'optimization of a bad idea'.
The techniques of overlapping activities known as simultaneous engineering (or concurrent engineering) are widely used by lean approaches (Letens et al., 2011). The NPD steps are executed sequentially, in which the next step starts before the current one ends. Additionally, future actions are completed as soon as the requirements for them are available (Hoppmann et al., 2011). The starting point for coordinating the parallelism of tasks is to define
module development teams. Therefore, obeya-type meetings should involve all stakeholders in the NPD's preliminary stages. Despite its benefits, concurrent engineering may create risks, such as schedule, cost and quality risks. Concerning this problem, Wu et al. (2010) proposed a risks analysis procedure due to the application of simultaneous engineering in NPD, on the following aspects: technological, human resources, financial, organizational, strategy, planning, and communication. Finally, simultaneous engineering is considered the primary enabler for lean practices in NPD (Khan et al., 2013). However, for companies with an engineering-to-order (ETO) approach, there is no control over several initial decisions (already performed by the clients) and the simultaneous engineering application may be challenging (Kumar and Wellbrock, 2009).
In companies with a traditional NPD structure, project team engineers tend to assume management roles after some time and experience. In lean NPD, these engineers should stay in their areas of expertise, enabling the other lean characteristics in NPD, such as knowledge acquisition for problem-solving, continuous improvement and knowledge transfer between projects (Hoppmann et al., 2011). As in lean production, these engineers become specialists by executing the same practices in different projects and contexts. This process allows the gradual improvement of the technique, besides the accumulation of knowledge (Letens et al., 2011). Therefore, the companies should motivate their specialists´ development by implementing
specialist career path and workload levelling, also assuring their team members´ activities are equally/fairly balanced during the NPD operations.
The chief engineer is responsible for the value definition, representing the voice of the customers (VOC) at all stages of the development process. A strong project manager should promote the integration of all areas of the team members, make the final decisions and define the
milestones of the NPD projects schedules (Welo, 2011). The chief engineer, besides being a manager, plays a key role in technical details (Hoppmann et al., 2011). The teams managed by the chief engineer are composed of experienced and cross-functional professionals, including, according to the lean view, suppliers who participate in some phases of the NPD process (Nepal et al., 2011). The chief engineer, besides being responsible for adding value to the product, is the instrument to achieve the organizations´ objectives (Welo, 2011).
Finally, suppliers are traditionally observed as external stakeholders to the NPD process. In a lean environment, these individuals are connected to the project team, supporting the development of parts, modules, and sub-assemblies. Consequently, the distance between the project team and the suppliers is considerably reduced. In companies with supplier integration, certain suppliers have employees working permanently within the physical structures of their customers (Hoppmann et al., 2011). Under the green perspective, this enabler plays a vital role in strategy for sustainability. The integration between suppliers and project team promotes environmental outcomes (Johansson and Sundin, 2014).
3. Lean and Green NPD: An Evaluation Model for SMEs
The evaluation is based on the 16 lean and green enablers that emerged from the systematic review. The central idea is to analyse the importance of these enablers in the context of SMEs. The model consists of hierarchizing these elements, when submitted to the scenario of each SME observed. The high-placed elements reflect the best lean and green characteristics of an SME, while worst-case elements suggest weaknesses in product development processes and operations or enablers that are not explored by SMEs. Consequently, the result is a diagnosis that presents both lean and green strengths (maximizing efficiency and prioritizing environmental
responsibility in product design) and mainly points out where these companies need to evolve their NPD operations.
This diagnosis occurs through a structured interview, capturing the qualified stakeholders' opinion concerning each SME, using multicriteria decision making (MCDM) methods to hierarchize the 16 enablers. These methods are widely used to aid decision making, since they prioritize options through a set of pre-established criteria (Saaty, 2008). In general, the primary MCDM stages consist of: establishing the criteria, defining the alternatives, evaluating these alternatives, applying a method of analysis and defining an optimal or near-ideal alternative (Opricovic and Tzeng, 2004).
In this case, we consider as criteria the peculiar characteristics usually attributed to SMEs. They can be positive or negative, as the organization size may or may not favour NPD processes and operations. As alternatives, we consider the 16 enablers. The interview procedure consists of questions that ask how each enabler (alternative) relates to each characteristic (criterion). Unlike typical applications of MCA, whose purpose is to choose a single option, we are interested in the ranking of enablers for each unit of analysis (an SME). In fact, the evaluation should occur in the context of each company. Thus, its stakeholders can use the results to evolve their NPD operations in a lean/green path.
Our approach evaluates NPD operations from the lean and green perspective regardless of the type of business or product, structure and level of organization/formalization of the NPD. For example, aluminium SME-companies in southern Brazil are immature in the NPD perspective (Adamczuk and Tan, 2017), devoid of a defined sector or roles in the development of new products. However, their product development 'happens' independently of this absence of
formalization. Our procedure, hierarchizing the enablers, allows a future improvement agenda for these companies. This also occurs where there are structured NPD sectors. Of course, the difference lies in this agenda. While for less structured companies there is a 'long way', for better-organized companies it means a refinement of their NPD operations.
The evaluation criteria are the intrinsic characteristics of the SMEs´ structure. With this premise in mind, Table 3 presents the main differences between SMEs and large companies, as the first column constitutes the list of 14 criteria that our model uses to classify the 16 enablers.
Table 3. SMEs and Large Organizations Comparison: Criteria for Lean and Green Enablers Evaluation.
SMEs Large Organizations
(Ghobadian and Gallear, 1997; Leithold et al., 2016;
Nicholas et al., 2011)
Flat with few layers of management
Criterion 1: ‘benefit criterion’, less layers mean easy vertical integrations and promote team spirit and teamwork.
Hierarchical with several layers of management
(Ghobadian and Gallear, 1997; Millward and Lewis,
2005)
Failure to understand the importance of product design
Criterion 2: ‘cost criterion’ because it delays the use of tools and techniques that could be beneficial to the NPD process.
Product design well established and integrated with other areas
(Ghobadian and Gallear, 1997; Nicholas et al.,
2011)
Flexible structure and information flow
Criterion 3: ‘benefit criterion’, flexible structures can reduce the distance between the stakeholders.
Rigid structure and information flows (Ghobadian and
Gallear, 1997; Nicholas et al.,
2011)
High incidence of innovativeness
Criterion 4: ‘benefit criterion’, the lack of formal operations increases the
susceptibility of innovations. Low incidence of innovativeness (Ghobadian and Gallear, 1997; Nicholas et al., 2011)
Individual creativity encouraged
Criterion 5: ‘benefit criterion’, the creativity is linked more to the individual than to the teamwork.
Individual creativity stifled (Ghobadian and Gallear, 1997; Leithold et al., 2016; Nicholas et al., 2011)
Limited access to human resources
Criterion 6: ‘cost criterion’ because the teams are overloaded.
Good access to human resources
(Ghobadian and Gallear, 1997; Millward and Lewis,
2005)
Limited time to realize innovation projects
Criterion 7: ‘cost criterion’, the innovation process demands time and resources.
Well-structured and standardized innovation process (Ghobadian and Gallear, 1997; Leithold et al., 2016; Millward and Lewis,
2005; Nicholas et al., 2011)
Limited financial resources
Criterion 8: ‘cost criterion’, NPD projects require resources (money, people,
infrastructure).
Good access to financial resources
(Ghobadian and Gallear, 1997; Nicholas et al.,
2011)
Low degree of formalization
Criterion 9: ‘cost criterion’ because many of the NPD tasks are executed by one person, and documentation is considered a waste of time. High degree of formalization (Ghobadian and Gallear, 1997; Nicholas et al., 2011)
Negligible resistance to change
Criterion 10: ‘benefit criterion’ because it makes the organization more adaptive and assertive to changes.
High degree of resistance to change
(Ghobadian and Gallear, 1997; Nicholas et al.,
2011)
Personnel authority high
Criterion 11: ‘cost criterion’ because in general the top management is not
technically qualified and often can be very conservative.
Personnel authority low
(Ghobadian and Gallear, 1997; Nicholas et al.,
2011)
Rapid response to environmental change
Criterion 12: ‘benefit criterion’ because it makes the organization more adaptive.
Slow response to environmental change (Ghobadian and Gallear, 1997; Nicholas et al., 2011)
Top management close to point of delivery
Criterion 13: ‘benefit criterion’, the top management can detect the wastes in real time.
Top management far from point of delivery (Ghobadian and
Gallear, 1997; Nicholas et al.,
2011)
Top management very visible
Criterion 14: ‘benefit criterion’ because it offers the top management the opportunity to build a strong personal relationship.
Top management visibility limited
Two MCDM tools were considered: Analytic Hierarchy Process (AHP) and fuzzy technique for order of preference by similarity to ideal solution (Fuzzy-TOPSIS). We present the AHP in this section until its completion, whereas just the structure of the Fuzzy-TOPSIS is discussed since this step depends on in loco evaluations in SMEs. In this article, we test the
model in three companies (Section 4). The first tool (AHP) defines the weight of each criterion (Table 3), the relative importance among the SMEs´ characteristics. The second tool is an expansion of the TOPSIS technique, adapted to abstract situations when the values of each alternative are not clearly defined (Chen, 2000). The association of these tools for element classification was previously used for NPD operations, such as the example of Lin et al. (2008), where the AHP determined the weights of the customer's needs, while TOPSIS performed the comparison of the project alternatives. As shown in Figure 5, we propose an NPD evaluation in SMEs. Finally, through case studies, the model can be tested, which we present in Section 4.
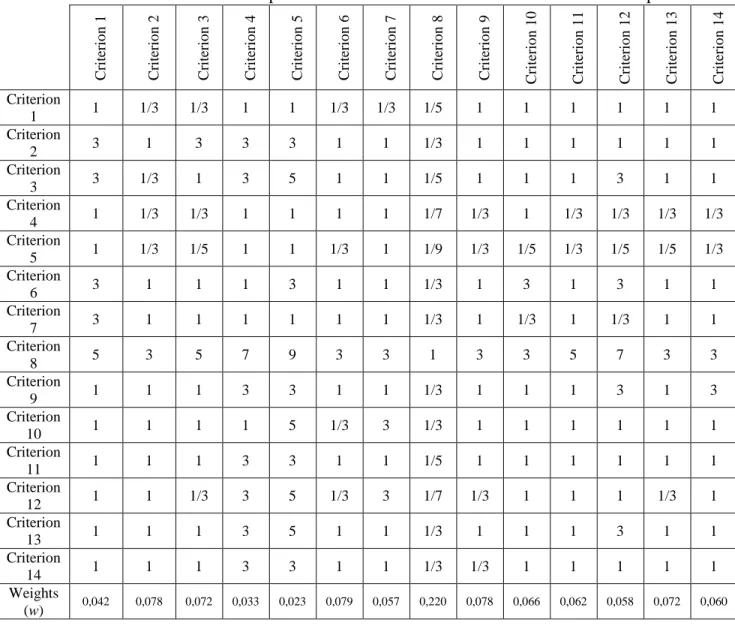
3.1Analytic-Hierarchy Process (AHP): Relative Importance of SMEs´ Characteristics The AHP consists of a selection method using paired comparisons performed by one or more experts. This method has three principles: building the hierarchy, setting the priorities and checking the logical consistency (Saaty, 2008). We established the relative importance of each criterion over the others (14 criteria in Table 2), adopting the numerical scale proposed by Saaty (2008, 1990). First, we use the decision matrix 𝑚 × 𝑚, where each entry 𝑎𝑖𝑗 represents the importance of the 𝑖𝑡ℎ criterion relative to the 𝑗𝑡ℎ criterion, and m represents the number of criteria (𝑚 = 14). It makes a comparison between a verbal scale and another with numerical values, where ‘1’ means i and j are equally important, ‘3’ is i slightly more important than j, ‘5’
is i more important than j, ‘7’ is i stronger relative importance than j, and finally, ‘9’ means that i has absolute relative importance than j.
We performed the consensus judgments (Table 3), and each element of the matrix 𝑎𝑖𝑗
reflects the comparison between the criteria i and j. Where, 𝑖, 𝑗 ∈ 𝑁 and 1 ≤ 𝑖, 𝑗 ≤ 14.
𝐴 = [
1
𝑎
121/𝑎
121
…
𝑎
1𝑛… 𝑎
2𝑛⋮
⋮
1/𝑎
1𝑛1/𝑎
2𝑛⋮
⋮
… 1
]
(1)𝑎
𝑖𝑗. 𝑎
𝑗𝑖= 1
(2)We performed the judgments (Table 4) where each element of the matrix 𝑎𝑖𝑗 reflects the comparison between the criteria i and j. As such criteria are general characteristics of SMEs, we understand that this assessment requires a holistic or systemic perception rather than a strict vision the SMEs´ stakeholders may have. We felt comfortable to make such assessment based on our professional and academic background on NPD and lean and green. This decision, associated
with the case studies presented in Section 4, mostly justifies the 'Latin aspect' of this paper. These weights represent the reality of Brazilian SMEs. In future applications, other experts should revise these AHP weights considering other contexts.
Table 4. AHP Matrix: Relative Importance of SMEs´ Characteristics related to NPD Operations
C riter io n 1 C riter io n 2 C riter io n 3 C riter io n 4 C riter io n 5 C riter io n 6 C riter io n 7 C riter io n 8 C riter io n 9 C riter io n 10 C riter io n 11 C riter io n 12 C riter io n 13 C riter io n 14 Criterion 1 1 1/3 1/3 1 1 1/3 1/3 1/5 1 1 1 1 1 1 Criterion 2 3 1 3 3 3 1 1 1/3 1 1 1 1 1 1 Criterion 3 3 1/3 1 3 5 1 1 1/5 1 1 1 3 1 1 Criterion 4 1 1/3 1/3 1 1 1 1 1/7 1/3 1 1/3 1/3 1/3 1/3 Criterion 5 1 1/3 1/5 1 1 1/3 1 1/9 1/3 1/5 1/3 1/5 1/5 1/3 Criterion 6 3 1 1 1 3 1 1 1/3 1 3 1 3 1 1 Criterion 7 3 1 1 1 1 1 1 1/3 1 1/3 1 1/3 1 1 Criterion 8 5 3 5 7 9 3 3 1 3 3 5 7 3 3 Criterion 9 1 1 1 3 3 1 1 1/3 1 1 1 3 1 3 Criterion 10 1 1 1 1 5 1/3 3 1/3 1 1 1 1 1 1 Criterion 11 1 1 1 3 3 1 1 1/5 1 1 1 1 1 1 Criterion 12 1 1 1/3 3 5 1/3 3 1/7 1/3 1 1 1 1/3 1 Criterion 13 1 1 1 3 5 1 1 1/3 1 1 1 3 1 1 Criterion 14 1 1 1 3 3 1 1 1/3 1/3 1 1 1 1 1 Weights (w) 0,042 0,078 0,072 0,033 0,023 0,079 0,057 0,220 0,078 0,066 0,062 0,058 0,072 0,060
According to the sequential AHP steps, matrix normalization 𝐴𝑁𝑜𝑟𝑚 is obtained through the quotient between 𝑎𝑖𝑗 and the sum of the elements of column 𝑗.
Then, the criteria weight vector w (that is an m-dimensional column vector) is built by averaging the entries on each row of 𝐴𝑁𝑜𝑟𝑚, as follow:
𝑤
𝑖= ∑
𝑚𝜀=1𝑎̅
𝑖𝜀/ 𝑚
(4)Given the number of criteria (𝑚 = 14), judgments may be inconsistent. According to Alonso and Lamata (2006), we found consistency index (CI) of 0.100 and consistency ratio (CR) of 0.063 - which is adequate (Saaty, 2008). Calculated as follows:
𝐶𝐼 =
𝜆𝑚𝑎𝑥−𝑚𝑚−1 (5)
𝐶𝑅 =
𝐶𝐼𝑅𝐼 (6)
Where 𝜆𝑚𝑎𝑥 means the average of the elements of the vector whose 𝑖𝑡ℎ element is the ratio of the 𝑗𝑡ℎ element of the vector 𝐴 . 𝑤 to corresponding element of the vector w. The value from RI is an empiric value (1,58), as defined by Stein and Mizzi (2007).
The consistency is also proper by both harmonic consistency index (HCI) – 0.066 – and harmonic consistency ratio (HCR) – 0.042 (Stein and Mizzi, 2007), calculated as follows:
𝐻𝐶𝐼 =
(𝐻𝑀−𝑚)(𝑚+1)𝑚(𝑚−1) (7)
𝐻𝐶𝑅 ≈
𝐻𝐶𝐼Thus, we present the weight of each characteristic inherent to the structure of the SMEs related to NPD operations, the average local priorities (vector w), the weights needed to evaluate the 16 enablers in the Fuzzy-TOPSIS procedure.
3.2Fuzzy-TOPSIS: Hierarchization of the Enablers Lean and Green
Each lean and green enabler is an alternative in Fuzzy-TOPSIS and the evaluation consists in establishing the relative importance to the 14 characteristics of a determined enabler. These evaluations should be performed by specialists/stakeholders such as project managers, business relations managers, production managers, and other decision-makers of a particular SME. To convert the abstract data with the stakeholders, we used the scale proposed by Chen (2000). This scale, which resembles a 7-point Likert scale, consists in assigning fuzzy numbers to the linguistic variables (Table 4). That is, a value of the linguistic scale for each alternative is defined in light of the previously described Criteria (AHP). This linguistic scale converts an abstract statement into a set of fuzzy triangular numbers 𝑥̃𝑖𝑗 = (𝑎𝑖𝑗, 𝑏𝑖𝑗, 𝑐𝑖𝑗), which intersect each other through linear congruences.
Table 4. Linguistic Variables for the Ratings (Chen, 2000).
Linguistic Variable (𝑎𝑖𝑗, 𝑏𝑖𝑗, 𝑐𝑖𝑗) Very Poor (VP) (0,0,1) Poor (P) (0,1,3) Medium Poor (MP) (1,3,5) Fair (F) (3,5,7) Medium Good (MG) (5,7,9) Good (G) (7,9,10) Very Good (VG) (9,10,10)
As Chen (2000) proposed, the linear scale transformation is used to transform the various criteria scales into a comparable scale. Therefore, we can obtain the normalized fuzzy decision matrix, denoted by 𝑅̃.
𝑅̃ = [𝑟̃
𝑖𝑗]
𝑚 × 𝑛
(9)
Where B and C are the set of benefit and cost criteria (Table 2), and:
𝑟̃
𝑖𝑗= (
𝑎𝑖𝑗 𝑐𝑗∗,
𝑏𝑖𝑗 𝑐𝑗∗,
𝑐𝑖𝑗 𝑐𝑗∗) , 𝑗 ∈ 𝐵
(10)
𝑟̃
𝑖𝑗= (
𝑎𝑗 − 𝑐𝑖𝑗,
𝑎𝑗− 𝑏𝑖𝑗,
𝑎𝑗− 𝑎𝑖𝑗) , 𝑗 ∈ 𝐶
(11)
𝑐
𝑗∗=
max 𝑐
𝑗
𝑖𝑗𝑖𝑓 𝑗 ∈ 𝐵
(12)
𝑎
𝑗−=
min 𝑎
𝑖𝑗𝑗
𝑖𝑓 𝑗 ∈ 𝐶
(13)
Using the criteria weight vector w (from AHP), we can construct the weighted normalized fuzzy decision matrix as:
𝑉̃ = [𝑣̃
𝑖𝑗]
𝑚 ×𝑛
(14)
𝑣̃
𝑖𝑗= 𝑟̃
𝑖𝑗(. )𝑤
(15)
Thus, we have a structured interview consisting of 224 evaluations distributed among the experts (16 enablers x 14 characteristics for each SME) with questions as follows: ‘Considering the current practices in your company regarding the enabler Ali, establish a relation of these
he/she answers the questions related to specific criteria. Each question is contextualized so much as necessary by the interviewer. The triangular fuzzy numbers form the fuzzy decision matrix and determine the fuzzy weight of each criterion. These numbers are normalized and the fuzzy positive ideal solution (FPIS) and the fuzzy negative ideal solution (FNIS) are determined. The distance from each alternative is calculated from FPIS and FNIS, respectively.
𝐹𝑃𝐼𝑆 = (𝑣̃
1∗, 𝑣̃
2∗, … , 𝑣̃
𝑛∗)
(16)𝐹𝑁𝐼𝑆 = (𝑣̃
1−, 𝑣̃
2−, … , 𝑣̃
𝑛−)
(17)Where, 𝑣̃𝑗∗= (1,1,1) and 𝑣̃𝑗− = (0,0,0). The distance of each alternative from FPIS and FNIS can be currently determined as:
𝑑
𝑖∗= ∑
𝑛𝑗=1𝑑(𝑣̃
𝑖𝑗, 𝑣̃
𝑗∗)
(18)𝑑
𝑖−= ∑
𝑛𝑗=1𝑑(𝑣̃
𝑖𝑗, 𝑣̃
𝑗−)
(19)Finally, the hierarchy of each enabler under each characteristic is defined according to the closeness coefficient (𝐶𝐶𝑖), the rank order of all alternatives (Chen, 2000; Vahdani et al., 2011).
𝐶𝐶
𝑖=
𝑑𝑖−4. Case Studies
Three SMEs are investigated to test the lean-green NPD model. The first was the company Alpha, which has an informal NPD process and a build to order (BTO) production of aluminium kitchenware. Differently, the other companies, respectively Beta and Gamma, have well established NPD structures and complex products (compared to Alpha) and produce under the engineering to order (ETO) strategy. We applied the evaluation through structured interviews, described in the methodology, conducted with the managers of the three organizations. Thus, the responses related to the lean/green enablers on the 14-SME criteria resulted in a Fuzzy-TOPSIS hierarchy of Chen (2000), which reflects the extent of these elements in each company (Table 6). Subsections 4.1 to 4.3, based on qualitative data provided by the stakeholders, highlight some results of Table 6.
Table 6. The Lean and Green NPD Evaluation Results
Enablers Enterprise Alpha (02 stakeholders) Enterprise Beta (02 stakeholders) Enterprise Gamma (04 stakeholders)
𝐶𝐶𝑖 Rank 𝐶𝐶𝑖 Rank 𝐶𝐶𝑖 Rank
𝐴𝑙1 Continuous Improvement 0.569 2 0.448 7 0.257 12
𝐴𝑙2
Cross-Project Knowledge
Transfer 0.400 9 0.412 9 0.568 3
𝐴𝑙3
Definition of Value and Value
Stream 0.423 7 0.383 10 0.306 9
𝐴𝑙4
Ecodesign Tools and Green
Dynamic Capabilities 0.239 12 0.275 16 0.223 15
𝐴𝑙5 Knowledge and Learning 0.396 10 0.461 6 0.239 13
𝐴𝑙6 Life Cycle Assessment 0.234 13 0.340 12 0.479 5
𝐴𝑙7 Materials Selection 0.251 11 0.568 3 0.201 16
𝐴𝑙9 Product Variety Management 0.626 1 0.323 13 0.610 1
𝐴𝑙10
Rapid Prototyping. Simulating
and Testing 0.405 8 0.498 5 0.403 8 𝐴𝑙11 Responsibility-Based Planning Control 0.517 3 0.428 8 0.582 2 𝐴𝑙12 Set-Based Engineering 0.182 14 0.286 15 0.271 11 𝐴𝑙13 Simultaneous Engineering 0.182 14 0.640 2 0.278 10 𝐴𝑙14
Specialist Career Path and
Workload Levelling 0.182 14 0.294 14 0.430 7
𝐴𝑙15 Strong Project Manager 0.443 6 0.671 1 0.542 4
𝐴𝑙16 Supplier Integration 0.456 5 0.546 4 0.226 14
4.1Enterprise Alpha
Member of a local productive arrangement (LPA), a cluster of companies of the aluminium sector, this organization is family managed and has a portfolio of more than 400 items. Company Alpha manufactures utensils for stoves and kitchens, serving the local market, such as hotels, restaurants, end consumers (through grocery stores and markets), and large retailers in southern Brazil. The leading enabler is product variety management (r1), which is reasonably analysing the company's vast product portfolio. It is essential to use modular parts to manage it, as well as the massive use of commodities. Some lean characteristics are present or under implementation, such as: continuous improvement (r2); strong project manager (r6), a function carried out by one of the owners, whose primary role is to evaluate products from the customer´s point of view (final consumers, restaurant customers, chefs, etc.); responsibility-based planning control (r3), where managers set the main lead times, keeping each sector free to run their schedules; process standardization (r4), due to the recent adoption of management and
quality systems; and definition of value and value stream (r7), tools of lean practices which are expected to change the organizational culture.
There is a good supplier integration (r5), in the search for new solutions, especially for utensil accessories (cables and grippers), usually proposed by the suppliers. This fact is explained by the absence of a specialized NPD team, as well as the low complexity of the products in company alpha. Some alternatives were matched in the last position of the ranking, i.e., these are the non-existent enablers, as follows: set-based engineering (r14), simultaneous engineering (r14), and specialist career path and workload levelling (14). The NPD process is essentially informal and reactive, which means the products undergo few changes, motivated by needs observed with no defined periodicity. These changes occur when Alpha realizes that its products are losing market share (decrease in sales). Changes and improvements are incremental and there are no radical innovations, which seems natural when it comes to cooking utensils. The sources of inspiration for improvements are the technical fairs where company Alpha observes the launch of its competitors’ products.
4.2Enterprise Beta
With two operating markets, Beta is a manufacturer of secondary packaging machines, focused on the meat and pharmaceutical industries. Unlike Alpha, its organization has a well-defined NPD process, presenting products with a high degree of complexity regarding systems, subsystems, and components. The central element in Beta NPD is the strong project manager (r1), who, according to the interviewees, has a key role in maintaining customer requirements at all development stages. The value perceived by the customer is associated with the degree of automation in these machines, as well as the integration capacity with supervisory systems. The project manager is also responsible for the control and automation engineering sector, ensuring
the Beta products have all the functions, sensors and the automation level desired by the customers.
Simultaneous engineering (r2) also plays an important role, reflecting the company's ability to make 'unfinished products’. While the project team is working on elaborate and time-consuming systems, some parts are manufactured in advance such as structures, safety protections, and operating interfaces. However, due to the lack of product families (each machine is unique), managers emphasized the difficulty of replicating knowledge among projects ( cross-project knowledge transfer - r9), defining modular systems and reusing them in other projects (product variety management - r13), and specializing the project team in some systems (specialist career path and workload levelling - r14).
While set-based engineering (r15) is practically non-existent, rapid prototyping, simulations and testing (r5) are currently practiced in Beta. These two enablers are considered as opposing elements since each concept (new machine) is determined by the customers (also manufacturers). Thus, iteratively, a single alternative is executed, and consequently, a prototype is refined until it becomes the final product.
4.3Enterprise Gamma
Similarly to Beta, Gamma also has a structured NPD. Its final customers are from the meat packing industry, developing machines and production lines for meat processing. The main difference is that Gamma has a 20-product portfolio organised in product families. This may explain the strength of product variety management (r1) at Gamma since the project team develops subsystems shared with most products in each family. For example, all bearing assemblies share a cast iron structure, identical for a given family, with differences in their
internal machining as required for each machine (dimensional tolerances). There is also the sharing practice of systems with products from other families.
Responsibility-based planning and control (r2) is present at Gamma, and its project team has autonomy to execute the NPD activities. The engineers work with a strong project manager (r4), who is responsible for the product value during development, but they are free to set their work schedules and report directly to the company's directors. However, given the characteristics of the customers (the slaughterhouses), materials selection (r16) is restricted to accepted materials for products´ parts in direct contact with food. Thus, most of the equipment is made from pre-established steel alloys and composites.
There are no practices related to the adoption of ecodesign tools and green dynamic capabilities (r15). The project team works with requirements linked to descriptive memorials and pre-defined project terms. Therefore, developers are not free to adopt new materials and new design solutions that focus on the impacts to the natural environment. Also, Gamma's management is unaware of such terms as green transformational leadership and green dynamic capabilities. Curiously, Life cycle assessment (r5) is well ranked in our model. This enabler corresponds to the adoption of sustainable practices for remanufacturing, i.e., a particular family of products has a parts replacement system, where worn parts are remanufactured and delivered as new. The structure of a machine remains the same, and at the end of its useful life, it returns to the Alpha to be remanufactured and sold to small meat processing companies.
Finally, supplier integration (r14) is not adherent to Gamma, since, because the meat processing industries establish their own spare parts suppliers, the organization feels forced to embark technologies according to the bases of supply of its customers. Therefore, for a given commodity, there are several suppliers and low integration with the NPD team.
5 Conclusion
This article presents, through a systemic review, 16 lean and green enablers for product development: 1-continuous improvement, 2-cross-project knowledge transfer, 3-definition of value and value stream, 4-ecodesign tools and green dynamic capabilities, 5-knowledge and learning, 6-life cycle assessment, 7-materials selection, 8-process standardization, 9-product variety management, 10-rapid prototyping, simulating and testing, 11-responsibility-based planning control, 12-set-based engineering, 13-simultaneous engineering, 14-specialist career path and workload levelling, 15-strong project manager, and 16-supplier integration. These elements comprise a structure of building blocks to evaluate lean and green practices.
The level of NPD formalization in SMEs is heterogeneous. Thus, we propose a model that ranks the incidence of these practices regardless of the organization level. Using two MCDM tools: AHP and fuzzy-TOPSIS, each enabler is evaluated considering the SMEs context in Brazil. Firstly, AHP defines the relative importance of 14 SMEs´ characteristics. Secondly, we applied an expansion of the TOPSIS technique, adequate when the values of each alternative are not clearly determined, i.e., abstract judgments. Therefore, we organized a structured interview consisting of 224 evaluations distributed among the SMEs´ NPD stakeholders.
Our procedure hierarchizes the enablers, which is useful to establish a future improvement agenda. While for less structured companies there is a 'long way' ahead, for structured NPDs it means refinement of their operations. In this manner, we performed this diagnosis in three companies from southern Brazil, analysing their operations in both lean and green perspectives. As expected, the procedure showed versatility in the three different realities. A future research schedule can explore these lean/green enablers through longitudinal studies, as well as surveys which may determine the relationships among the 16 elements.
References
Adamczuk, G. O., & Tan, K. H. (2017). Lean and Green NPD in the Latin American Aluminium Industry. DEStech Transactions on Engineering and Technology Research, (ICPR).
Alonso, J.A., Lamata, M.T., 2006. Consistency in the Analytic Hierarchy Process: A New Approach. Int. J. Uncertainty, Fuzziness Knowledge-based Syst. 14, 445–459.
Anand, G., Kodali, R., 2008. Development of a Conceptual Framework for Lean New Product Development Process. Int. J. Prod. Dev. 6, 190–224.
Baines, T., Lightfoot, H., Williams, G.M., Greenough, R., 2006. State-Of-The-Art in Lean Design Engineering: A Literature Review on White Collar Lean. Proc. Inst. Mech. Eng. Part B J. Eng. Manuf. 220, 1539–1547.
Baumann, H., Boons, F., Bragd, A., 2002. Mapping the Green Product Development Field: Engineering, Policy and Business Perspectives. J. Clean. Prod. 10, 409–425.
Bovea, M., Pérez-Belis, V., 2012. A Taxonomy of Ecodesign Tools for Integrating Environmental Requirements into the Product Design Process. J. Clean. Prod. 20, 61–71.
Brones, F., Monteiro de Carvalho, M., 2015. From 50 to 1: Integrating Literature Toward a Systemic Ecodesign Model. J. Clean. Prod. 96, 44–57.
Chan, H.K., Wang, X., White, G.R.T., Yip, N., 2013. An Extended Fuzzy-AHP Approach for the Evaluation of Green Product Designs. IEEE Trans. Eng. Manag. 60, 327–339.
Chen, C.-T., 2000. Extensions of the TOPSIS for Group Decision-Making Under Fuzzy Environment. Fuzzy sets Syst. 114, 1–9.
Chen, Y.-S., Chang, C.-H., 2013. The Determinants of Green Product Development Performance: Green Dynamic Capabilities, Green Transformational Leadership, and Green Creativity. J. Bus. Ethics 116, 107–119.
Chen, Y.-S., Chang, C.-H., 2013. The Determinants of Green Product Development Performance Green Dynamic Capabilities Green Transformational Leadership and Green Creativity. J. Bus. Ethics 116, 107–119.
Cravo, T.A., 2012. SMEs, Growth and Space in Brazil. Inter-American Dev. Bank.
Daddi, T., Nucci, B., Iraldo, F., Testa, F., 2016. Enhancing the Adoption of Life Cycle Assessment by Small and Medium Enterprises Grouped in an Industrial Cluster: A Case Study of the Tanning Cluster in Tuscany (Italy). J. Ind. Ecol. 20, 1199–1211.
De Medeiros, J.F., Ribeiro, J.L.D., Cortimiglia, M.N., 2014. Success Factors for Environmentally Sustainable Product Innovation: A Systematic Literature Review. J. Clean. Prod. 65, 76–86.
Denyer, D., Tranfield, D., 2009. Producing a Systematic Review. SAGE Handb. Organ. Res. Methods.
Devanathan, S., Ramanujan, D., Bernstein, W.Z., Zhao, F., Ramani, K., 2010. Integration of Sustainability into Early Designs through the Function Impact Matrix. J. Mech. Des. Trans. ASME 132, 810041–810048.
EdinburghGroup, 2014. Growing the global economy through SMEs. Edinburgh Gr. 1–40.
Garza-Reyes, J.A., 2015. Lean and Green – A Systematic Review of the State of the Art Literature. J. Clean. Prod. 102, 18–29.
Ghobadian, A., Gallear, D., 1997. TQM and organization size. Int. J. Oper. Prod. Manag. 17, 121–163.
Gmelin, H., Seuring, S., 2014. Determinants of a Sustainable New Product Development. J. Clean. Prod. 69, 1–9.
Gosling, J., Naim, M.M., 2009. Engineering-to-Order Supply Chain Management: A Literature Review and Research Agenda. Int. J. Prod. Econ. 122, 741–754.
Hallstedt, S.I., 2017. Sustainability Criteria and Sustainability Compliance Index for Decision Support in Product Development. J. Clean. Prod. 140, 251–266.
Hoppmann, J., Rebentisch, E., Dombrowski, U., Zahn, T., 2011. A Framework for Organizing Lean Product Development. Eng. Manag. J. 23, 3–15.
Jabbour, C.J.C., Jugend, D., Jabbour, A.B.L. de S., Gunasekaran, A., Latan, H., 2015. Green Product Development and Performance of Brazilian Firms: Measuring the Role of Human and Technical Aspects. J. Clean. Prod. 87, 442–451.
Johansson, G., Sundin, E., 2014. Lean and Green Product Development: Two Sides of the Same Coin? J. Clean. Prod. 85, 104–121.
Khan, M.S., Al-Ashaab, A., Shehab, E., Haque, B., Ewers, P., Sorli, M., Sopelana, A., 2013. Towards Lean Product and Process Development. Int. J. Comput. Integr. Manuf. 26, 1105– 1116.
Kumar, S., Wellbrock, J., 2009. Improved New Product Development through Enhanced Design Architecture for Engineer-to-Order Companies. Int. J. Prod. Res. 47, 4235–4254.
Kurczewski, P., 2014. Life Cycle Thinking in Small and Medium Enterprises: The Results of Research on the Implementation of Life Cycle Tools in Polish SMEs - Part 1: Background and Framework. Int. J. Life Cycle Assess. 19, 593–600.
Leithold, N., Woschke, T., Haase, H., Kratzer, J., 2016. Optimising NPD in SMEs: A Best Practice Approach. Benchmarking 23, 262–284.
León, H.C.M., Farris, J.A., 2011. Lean Product Development Research: Current State and Future Directions. EMJ - Eng. Manag. J. 23, 29–51.
Letens, G.., Farris, J.A.., Van Aken, E.M.., 2011. A Multilevel Framework for Lean Product Development System Design. Eng. Manag. J. 23, 69–85.
Lin, M.-C., Wang, C.-C., Chen, M.-S., Chang, C.A., 2008. Using AHP and TOPSIS Approaches in Customer-Driven Product Design Process. Comput. Ind. 59, 17–31.
Martínez León, H.C., Farris, J.A., 2011. Lean Product Development Research: Current State and Future Directions. Eng. Manag. J. 23, 29.
Matt, D.T., Rauch, E., 2013. Implementation of Lean Production in Small Sized Enterprises. Procedia CIRP 12, 420–425.
Millward, H., Lewis, A., 2005. Barriers to Successful New Product Development Within Small Manufacturing Companies. J. Small Bus. Enterp. Dev. 12, 379–394.
Moreno, A., Cappellaro, F., Masoni, P., Amato, A., 2011. Application of Product Data Technology Standards to LCA Data. J. Ind. Ecol. 15, 483–495.
Morioka, S.N., de Carvalho, M.M., 2016. A Systematic Literature Review Towards a Conceptual Framework for Integrating Sustainability Performance into Business. J. Clean. Prod. 136, 134–146.
Nepal, B.P., Yadav, O.P., Solanki, R., 2011. Improving the NPD Process by Applying Lean Principles: A Case Study. Eng. Manag. J. 23, 52–68.
Nicholas, J., Ledwith, A., Perks, H., 2011. New Product Development Best Practice in SME and Large Organisations: Theory vs Practice. Eur. J. Innov. Manag. 14, 227–251.
Opricovic, S., Tzeng, G.-H., 2004. Compromise solution by MCDM methods: A Comparative Analysis of VIKOR and TOPSIS. Eur. J. Oper. Res. 156, 445–455.
Saaty, T.L., 2008. Decision Making with the Analytic Hierarchy Process. Int. J. Serv. Sci. 1, 83– 98.
Saaty, T.L., 1990. How to Make a Decision: The Analytic Hierarchy Process. Eur. J. Oper. Res. 48, 9–26.
SEBRAE, 2014. Participação das Micro e Pequenas Empresas na Economia Brasileira. Bibioteca do SEBRAE 106.
Stein, W.E., Mizzi, P.J., 2007. The Harmonic Consistency Index for the Analytic Hierarchy Process. Eur. J. Oper. Res. 177, 488–497.
Tranfield, D., Denyer, D., Smart, P., 2003. Towards a Methodology for Developing Evidence-Informed Management Knowledge by Means of Systematic Review. Br. J. Manag. 14, 207–222.
Tyagi, S., Cai, X., Yang, K., Chambers, T., 2015a. Lean Tools and Methods to Support Efficient Knowledge Creation. Int. J. Inf. Manage. 35, 204–214.
Tyagi, S., Choudhary, A., Cai, X., Yang, K., 2015b. Value Stream Mapping to Reduce the Lead-Time of a Product Development Process. Int. J. Prod. Econ. 160, 202–212.
Vahdani, B., Mousavi, S.M., Tavakkoli-Moghaddam, R., 2011. Group Decision Making Based on Novel Fuzzy Modified TOPSIS Method. Appl. Math. Model. 35, 4257–4269.
Vinodh, S., Rathod, G., 2010. Integration of ECQFD and LCA for Sustainable Product Design. J. Clean. Prod. 18, 833–842.
Wang, L., Ming, X.G., Kong, F.B., Li, D., Wang, P.P., 2011. Focus on Implementation: A Framework for Lean Product Development. J. Manuf. Technol. Manag. 23, 4–24.
Wang, X., Chan, H.K., Li, D., 2015. A Case Study of an Integrated Fuzzy Methodology for Green Product Development. Eur. J. Oper. Res. 241, 212–223.
Ward, A.C., Sobek, D.K., 2014. Lean Product and Process Development. Lean Enterprise Institute.
Welo, T., 2011. On the Application of Lean Principles in Product Development: A Commentary on Models and Practices. Int. J. Prod. Dev. 13, 316–343.
Witczak, J., Kasprzak, J., Klos, Z., Kurczewski, P., Lewandowska, A., Lewicki, R., 2014. Life Cycle Thinking in Small and Medium Enterprises: The Results of Research on the Implementation of Life Cycle Tools in Polish SMEs - Part 2: LCA Related Aspects. Int. J. Life Cycle Assess. 19, 891–900.