AXIS 3.0
User Documentation
Axis version 3.0 © Nexa Technologies, 2002-2004
Table of Contents
1.0 Axis 3.0 Installation
3
1.1 System Requirements
3
1.2 Installing from the web
3
1.3 Installing from a CD
4
2.0 Basics
5
2.1 System Login
5
2.2 The Axis 3.0 Interface
6
2.3 File Menu
7
2.3.1 Settings
7
2.3.1.1 Colors
7
2.3.1.2 General Setup
8
2.3.1.3 Highlighted ECN’s
9
2.3.1.4 Hot Keys
9
2.3.1.5 Orders
10
2.3.1.6 Quotes
11
2.3.1.7 Stock Shortcuts
12
2.3.2 Font
12
2.3.3 Save Settings
12
2.4 Window Menu
13
2.5 Navigation
13
2.6 Windows Management
14
2.7 Icons
15
3.0 Charts and Studies
16
3.1 Working with Axis 3.0 Charts
17
3.2 Drawing Trend and Support Lines
18
3.3 Basic Chart Settings
19
3.4 Studies
21
3.4.1 ADX
21
3.4.2 Bollinger Band
22
3.4.3 MACD
22
3.4.4 Momentum (MOM)
23
3.4.5 Moving Averages High/Low
23
3.4.6 Moving Averages
24
3.4.7 Moving Averages Bands
24
3.4.8 Moving Averages TR
25
3.4.9 On Balance Volume
25
3.4.10 Parabolic SAR
26
3.4.11 Rate of Change (ROC)
26
3.4.12 Relative Strength
27
3.4.13 Stochastic
27
3.4.14 TRIX
28
3.4.15 TSI
28
4.0 Quotes
29
4.1 Stock Boxes
29
4.1.1 Entering a Symbol
29
4.1.2 Level I Data
30
4.1.3 Level II Data
30
4.1.4 Time & Sales Prints
31
4.1.5 The Book Box
31
4.1.6 The Dome View
32
4.2 Option Boxes
33
4.2.1 Option Box Basics
34
4.2.2 The Option Montage
35
4.5 Market View
35
4.5.1 Adding and Deleting Symbols
36
4.5.2 Pop-up Menu
37
4.5.3 Setting an Alert
37
4.6 Index view
38
4.7 Symbol Lookup
39
5.0 Order Execution
40
5.1 Placing an order for a Stock
41
5.2 Placing an order for an Option
42
6.0 Account Management
44
6.1 Account Watcher Interface
44
6.2 Account Watcher Header
45
6.3 Open Order Window
46
6.4 Message Window
46
6.5 Account Info Window
47
6.5.1 Open Tab
47
6.5.2 Closed Tab
49
6.5.3 Executions Tab
50
6.5.4 Order History Tab
51
Axis version 3.0 © Nexa Technologies, 2002-2004
1.0 Axis 3.0 Installation
Axis 3.0 installation is a user friendly process designed to allow any person no matter how computer literate to install (and uninstall if necessary) the software. Just follow the detailed instructions below to install the Axis 3.0 Software.
1.1 System Requirements
Before installing Axis 3.0, be sure your system meets these minimum requirements:
ž Operating System: Windows 98 (Windows 2000 or Windows XP recommended)
ž CPU: Pentium III 500 MhZ (Pentium IV recommended)
ž Memory: 128 MB RAM (256 MB recommended)
ž Video Card: PCI or AGP video card with 32 MB RAM on the video card (more powerful video cards will further improve performance)
ž Internet Connectivity: DSL, Cable Modem or other high bandwidth solution
Attempting to operate Axis 3.0 on a PC, which does not meet the minimum requirements above, will result in system instability. Such symptoms as freezing, loss of Internet connectivity, increased lag times in the delivery of market data, and other negative consequences may be experienced.
1.2 Installing from the web
ž Follow the web link given to you by your Software Provider to download the Axis 3.0 file.
ž When prompted, select “Save file to disk”, and select an easy-to find location for the file (such as your desktop).
ž After saving the file, double-click on Axis 3.0.exe Icon (see above figure 1.0) to launch the installer.
ž Accept the license agreement, and follow the instructions to complete the installation. By Default the program will be installed in “C:\Program Files\Nexa Technologies\Axis 3.0” but the location can be altered during the installation if desired.
ž Once the install is complete, the Axis 3.0 shortcut icon will be on your desktop (see above figure 1.1), and in your Windows Start Menu.
If the Axis 3.0 installer is run and Axis 3.0 is already installed on the PC, then an uninstall process will be run instead. Once uninstall is complete, run the Axis 3.0 installer again to perform the installation.
Figure 1.0
1.3 Installing from a CD
ž Insert the CD into the CD-ROM drive.
ž If the Axis 3.0 installer does not automatically start-up, use Windows Explorer to navigate to the CD-ROM drive (frequently the D: drive), and locate the Axis 3.0 file. Double-click on
ž Axis30.exe to launch the installer.
ž Accept the license agreement, and follow the instructions to complete the installation. By Default the program will be installed in “C:\Program Files\Nexa Technologies\Axis 3.0” but the location can be altered during the installation if desired.
ž Once the install is complete, the Axis 3.0 shortcut icon will be on your desktop (see figure 1.1), and in your Windows Start Menu.
If the Axis 3.0 installer is run and Axis 3.0 is already installed on the PC, then an uninstall process will be run instead. Once the uninstall is complete, run the Axis30.exe installer again to perform the installation.
Axis version 3.0 © Nexa Technologies, 2002-2004
2.0 Basics
To learn to navigate through Axis 3.0 let’s begin with the basics. Some topics that are covered are: logging-in, setting and saving the screen layouts, menu choices and functions, icons, printing, and more.
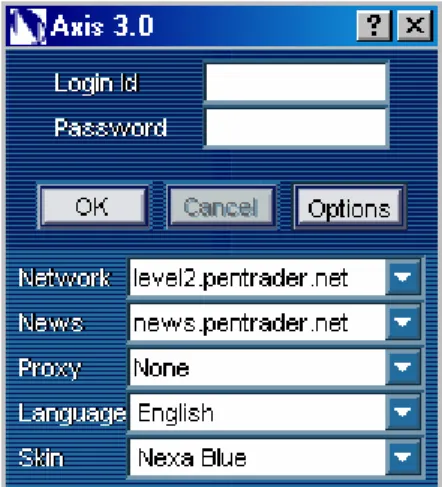
2.1 System Login
When Axis 3.0 is launched, the system login box appears after the software load is completed. Once a valid User ID and Password are entered, clicking OK will launch the Axis 3.0 interface and establish the server connection.
The “Options” button allows for the Axis 3.0 Network address to be changed before the login request is submitted. This should NEVER be changed unless specifically ordered by Technical Support. Changing the network server address can result in an inability to connect to the Axis 3.0 Servers, rendering executions and/or quote data unattainable. Exercise extreme caution with this setting.
Figure 2.2 Figure 2.1
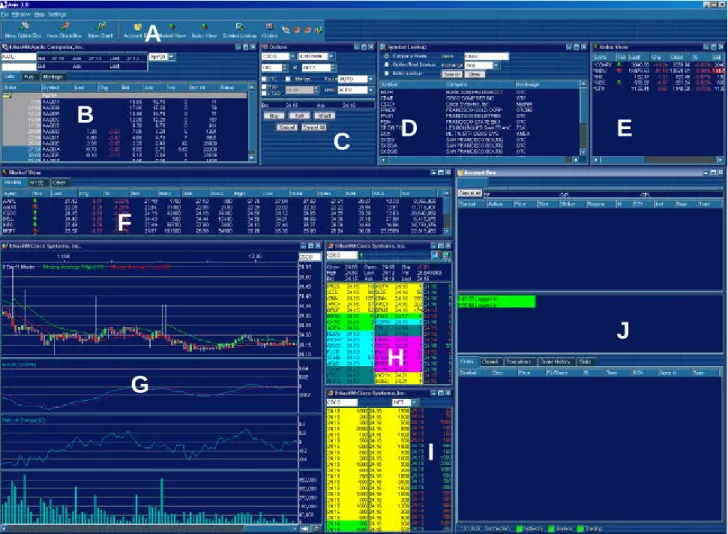
2.2 The Axis 3.0 Interface
A. Navigation Bar: allows for easy navigation of Axis 3.0 software.
B. Option Box: the Option Box is for option chain quote information. It is also possible to have a second Option Box open by clicking on the Stock Box Menu and selecting Option Box 2
C. Order Box: from which trades can be executed. It therefore includes the fields for “Number of Shares” “Price” as well as a buttons for different order types. For a more detailed description of the Execution Manager function, please refer to 4.0 Order Execution.
D. Symbol Lookup: Look up a symbol for a particular company or to find the underlying symbol for an Option symbol.
E. Index Box: shows the current real-time values of the major market indices. Please refer to 7.0 Decision Support for more details.
F. Market View: provides the ability to monitor many individual stocks with real-time Level I quotes. Please refer to 6.0 Decision Support for more details.
G. Chart Box 1: is linked to Stock Box 1 by default. This Chart Box will display detailed intra-day, daily, and weekly charts for the stock selected in Stock Box 1 or any stock symbol entered on the stock field in the chart box. In addition to basic price movement, also included are details such as volume, Relative Strength, Momentum Indicators, etc. Please refer to 6.0 Charting.
H. Stock Box 1: the Stock Box is for Level I and II quote information. It is also possible to have a second Stock Box open by clicking on the Stock Box Menu and selecting Stock Box 2.
I. Book Box: Displays All book information (i.e. INET, ARCA)
J. Account Watcher: the multiple tabs in this window provide order management, real-time portfolio tracking, and monitoring of account statistics. Status lights indicate system conditions in real time. For more detail description of the features please see 5.0 Account Watcher.
Figure 2.3: the Axis 3.0 Interface is shown here with 1 Stock Box, 1 Chart Box, 1 Option Box, and Book Box active.
A
B
C
D
H
G
E
F
I
J
Figure 2.3Axis version 3.0 © Nexa Technologies, 2002-2004
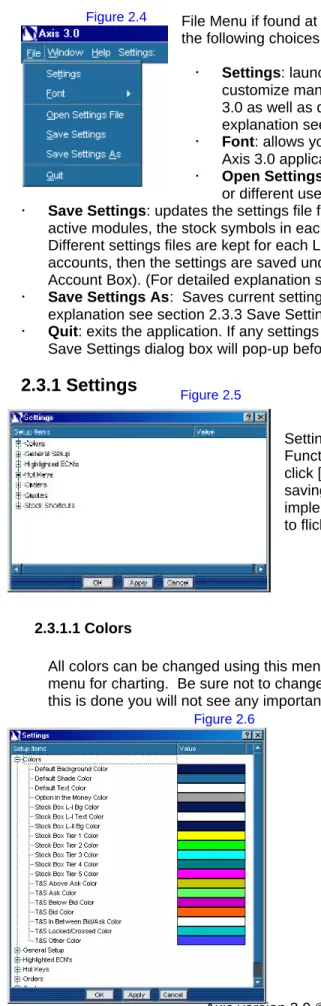
2.3 File Menu
File Menu if found at the upper left hand corner of your Axis 3.0 window. It contains the following choices:
ž Settings: launches the Settings dialog box. This utility allows you to customize many of the settings that govern the overall look and feel of Axis 3.0 as well as default values for many of the variables. (For detailed explanation see section 2.3.1 Settings)
ž Font: allows you to choose the default font, font style and font size for the Axis 3.0 application.
ž Open Settings File: Allows you to use a saved setting from a previous time or different user. (For detailed explanation see section 2.3.2 Font)
ž Save Settings: updates the settings file for the current user. This includes the size and location of all active modules, the stock symbols in each module, the setting values for all application variables, etc. Different settings files are kept for each Login ID on the local PC. If you are logged into multiple accounts, then the settings are saved under the first Login ID (the account on the left-most tab in the Account Box). (For detailed explanation see section 2.3.3 Save Settings)
ž Save Settings As: Saves current settings file under a specific name chosen by you. (For detailed explanation see section 2.3.3 Save Settings)
ž Quit: exits the application. If any settings variables have changed since they were last saved, then a Save Settings dialog box will pop-up before exiting.
2.3.1 Settings
Settings menu allows you to change Colors, General Information Functionality, and Quote Information. When changing the settings click [OK] or [Apply] to save the choices, or [Cancel] to exit without saving. Clicking either the [OK] or [Apply] buttons will instantly implement the new settings, and will therefore cause the application to flicker momentarily while Axis 3.0 is reinitialized.
2.3.1.1 Colors
All colors can be changed using this menu except colors for charting which can be found in the settings menu for charting. Be sure not to change the Background color to the same color as your text color. If this is done you will not see any important quotes or messages.
ž Default Background Color: Color of all windows background except windows with specific Color settings (i.e. Stock Boxes, Charts)
ž Default Shade Color:
ž Default Text Color: Color of Text except Text with specific Color settings.
ž Option In the Money Color: Color of option contracts that are in the money.
ž Stock Box L-I Bg Color: Color of background of level 1 information found in the stock boxes.
ž Stock Box L-I Text Color: Color of Text of level 1 information found in the stock boxes.
ž Stock Box L-II Bg Color: Color of background of level 2 information found in the stock boxes.
Figure 2.5 Figure 2.4
(2.3.1.1 Colors continued)
ž Stock Box Tier 1 Color: Color of first tier of market makers in the level 2 found in the stock boxes.
ž Stock Box Tier 2 Color: Color of second tier of market makers in the level 2 found in the stock boxes.
ž Stock Box Tier 3 Color: Color of third tier of market makers in the level 2 found in the stock boxes.
ž Stock Box Tier 4 Color: Color of fourth tier of market makers in the level 2 found in the stock boxes.
ž Stock Box Tier 5 Color: Color of fifth tier of market makers in the level 2 found in the stock boxes.
ž T&S Above Ask Color: Color of prints that are above the ask price found in the stock boxes.
ž T&S Ask Color: Color of prints that are at the ask price found in the stock boxes.
ž T&S Below Bid Color: Color of prints that are below the bid price found in the stock boxes.
ž T&S In Between Bid/Ask Color: Color of prints that are between the ask price and the bid price found in the stock boxes.
ž T&S Lock/Crossed Color: Color of prints that are between the ask price and bid price when the ask price is lower then the bid price found in the stock boxes.
ž T&S Other Color: Color of prints other than the ones just mentioned found in the stock boxes. 2.3.1.2 General Setup
General Setup is used to set the general functionality of Axis 3.0
ž Account Summary Currencies: Axis 3.0 has the ability to trade multiple stocks from different countries. Account Summary Currencies allows you to
display stocks in all primary, or secondary, only currencies.
ž Auto Switch Account Box: when logged into multiple accounts, any order placed will automatically cause the Account Box to switch to the corresponding account tab.
ž Auto Switch Order Account: when logged into multiple accounts, switching between account tabs in the
Account Box will automatically select the corresponding account in the drop-down fields of all active Stock/Option Boxes.
ž Display Net P&L: Display the P&L after commissions have been taken out.
ž Labels on navigation buttons: when checked causes the text labels to be displayed below the buttons on the Quick Start Tool Bar, as well as the module icons on the Navigator Tool Bar.
ž Sort Market View: Will sort the Market View by one of
the columns found in Market View. If not chosen then symbols will not be sorted even if you click on the column to sort the symbols.
ž Symbols on navigation buttons: when checked causes the relevant stock symbol to be displayed below each of the Chart, Stock Box, and Option Box icons on the Navigator Tool Bar.
Axis version 3.0 © Nexa Technologies, 2002-2004 2.3.1.3 Highlighted ECN’s
You can highlight a specific ECN so that it will be more visible in the level 2 section of the each Stock Box. You can select as many as 6 ECNs to highlight and choose the color in which to highlight them.
2.3.1.4 Hot Keys
Hot Keys – allows the user to Enable or Disable the Hot Keys feature in Axis 3.0, as well as set Hot Key combinations for any of the functions listed.
Enable Hot Keys – to prevent possibly costly order entry mistakes, Hot Keys are NOT enabled by default. To enable this feature check this box.
To set a Hot Key sequence for a Particular Function – click on the value to the right of the function, and then Press the desired hot key combination.
To disable a Particular Function from the Hot Keys – click on the value to the right of the function, and then press the [Delete] key to erase the Hot Key combination.
Figure 2.9
2.3.1.5 Orders
Orders manages settings related to Order Entry and default order settings in Axis 3.0:
ž Auto adjusts order size: determines whether the system will automatically adjust order size when CLOSING a position. If checked, an order to close a position which exceeds the share size of the open position will have its share size automatically changed to match the open shares available. If not checked such an order will be rejected as exceeding the available share size.
ž Auto Limit Buy Delta: enter the dollar amount to use when setting the price of an Auto Delta Limit Buy. This amount will be added to the current Best Ask to determine the Limit Buy price.
ž Auto Limit Sell Delta: enter the dollar amount to use when setting the price of an Auto Delta Limit Sell. This amount will be subtracted from the current Best Bid to determine the Limit Sell price.
ž Auto Limit Short Delta: enter the dollar amount to use when setting the price of an Auto Delta Limit Short. This amount will be subtracted from the current Best Bid to determine the Limit Short price.
ž Confirm Equity Orders: when checked will force a pop-up box to appear for every equity order. The user must then confirm the order before it is sent to the servers for execution.
ž Confirm Option Orders: when checked will force a pop-up box to appear for every option order. The user must then confirm the order before it is sent to the servers for execution.
ž Default debenture contract size: if save size always is not selected or if no size has been inputted then the default size for all TSX debenture contracts will be populated with this size in the size field.
ž Default equity size: share size that will populate an order ticket for an equity symbol by default.
ž Default future contract size: contract size that will populate an order ticket for a futures contract by default.
ž Default future contract ECN: ECN you wish to send all future contracts orders to unless otherwise selected by you. If no ECN is added here the current default is Auto. (Auto is when a ECN is selected per a set Routing path has already been chosen by the broker) Only use this function if you wish to use a particular ECN as a default other than the one found in the auto routing.
ž Default Listed ECN: ECN you wish to send all NYSE equities Orders to unless otherwise selected by you. If no ECN is add here the current default is Auto. (Auto is when a ECN is selected per a set Routing path has already been chosen by the broker) Only use this function if you wish to use a particular ECN as a default other than the one found in the auto routing.
ž Default Not-Listed ECN: ECN you wish to send all NASDAQ, OTC, OTCBB, and pink sheet orders to unless otherwise selected by you. If no ECN is added here the current default is Auto. (Auto is when a ECN is selected per a set Routing path has already been chosen by the broker) Only use this function if you wish to use a particular ECN as a default other than the one found in the auto routing.
ž Default option contract size: contract size that will populate an order ticket for an options contract by default.
ž Default Options ECN: ECN you wish to send all option contracts orders to unless otherwise selected by you. If no ECN is added here the current default is Auto. (Auto is when a ECN is selected per a set Routing path has already been chosen by the broker) Only use this function if you wish to use a particular ECN as a default other than the one found in the auto routing.
ž Display 24-hour time on orders: alters the timestamp displayed on order messages in the Axis 3.0 log, as well as in the Order History window.
ž Display date on orders: adds the date stamp to order messages displayed in the Axis 3.0 log.
ž Fill MMD on double click: fills in route and exchange on an order if an exchange is double clicked in the option montage
Axis version 3.0 © Nexa Technologies, 2002-2004
(2.3.1.5 Orders continued)
ž Fill size when dragging: allows the user to populate the share size of an order ticket by dragging a position from the Positions window in the Account Box to a Stock Box. Thus if the default equity size is 100, but the user has an open position for 500 shares of CSCO, when they drag the CSCO symbol from their positions to a Stock Box (presumably to close the position), the share size will be changed to match the open number of shares. If not selected, then the share size would remain at the default setting (100 in the example).
ž Save individual size: this instructs Axis 3.0 to remember the share size used for each specific symbol entered in an order ticket, regardless of which Stock Box is used. This “memory” persists as long as Axis 3.0 is running, but is erased when the application is shut down.
ž Save size always: causes the share size to remain static in each Stock Box as the user changes symbols. If Stock Box 1 has a share size of 500, and Stock Box 2 is set to 1000 shares, these sizes will remain consistent no matter which symbol is entered.
The share size will still vary between Equities, Options, and Futures, even when Save Size Always is checked. The share size will be preserved within all like instruments (e.g. 200 for Equities, 10 for Options, and 1 for Futures).
2.3.1.6 Quotes
Quotes controls global settings related to how market data is displayed in Axis 3.0:
ž Change is from the open: by default, the “Change” value displayed in Level I data (in the Market View, Stock Boxes, etc) is calculated vs. the previous close price. Check this box to see the Change calculated against this morning’s open price instead.
ž Display ‘#’ when decimal digits exceed max: if a quote has exceeded its max digits the following digits will be displayed as # instead of being rounded off.
ž Display Quote Time: this option will add the time of every quoted price into the Level II quote display for all Stock Boxes.
ž Display T&S time: when checked, this feature will show the timestamp on each print as it scrolls by in the Time & Sales area of each Stock Box.
ž Divide equities size by 100: same as above, but this setting will affect the quotes from the exchanges as opposed to the ECN Books.
ž Hide L1 non-local currency marks: check this setting so that the currency symbol (USD, CAD, EUR, etc) will NOT be displayed when viewing a foreign-currency symbol in the level 1 section of the Stock Box.
ž Hide L2 non-local currency marks: check this setting so that the currency symbol (USD, CAD, EUR, etc) will NOT be displayed when viewing a foreign-currency symbol in the level 2 section of the Stock Box.
ž L1 non-local currency marks on Last only: check this setting so that the currency symbol (USD, CAD, EUR, etc) will ONLY be displayed on the “Last Price” when viewing a foreign-currency symbol in any Level 1 quote display (such as Market View or the Account Box).
ž Link book: links stock boxes to the book box.
ž Maximum decimal digits: maximum number of decimal places to display on all price values in all modules (the default is 4).
ž Minimum decimal digits: minimum number of decimal places to display on all price values in all modules (the default is 2). The minimum number of decimal places will always be displayed, whereas decimal places above the minimum up to the maximum are only displayed as necessary.
ž T&S from top: instructs Axis 3.0 to show T&S prints from the top of the T&S window within each Stock Box. This is the default. Clear this checkbox if new T&S prints should appear from the bottom instead.
2.3.1.7 Stock Shortcuts
Stock Shortcuts In the Hot Keys section of the Settings Utility, up to 10 key combinations can be defined for Stock Symbols. These serve as a quick method for pulling up quotes or charts for favorite stocks. Although the key combinations are defined in the Hot Keys section, the actual symbols that each
combination represents are defined in the Stock Shortcuts section. Once these are set, and Hot Keys are enabled, the key combinations can be used in Charts and Stock Boxes to quickly call up these preferred symbols.
2.3.2 Font
All the fonts found in Axis 3.0 can be changed to suit your needs or preferences. To change the font click on file then font (see figure 2.13). There are two choices system, which is for all fonts not found in a level 2 screens or montage, and Montage. Select one of the two choices to change the font. A window will pop up. (See figure below)
You have the choice to change Font, Font Style, Size, Effects, and Script. Color of the font can be found in section 2.3.1.1 Color. Once all changes have been made click [OK] to save or [Cancel] to delete changes.
2.3.3 Save Settings
Once all settings have been made and the
windows are in positions you like then you
can save the current settings as a file to be
retrieved later. You or any one else that likes
that layout then can use the file. To open a
file click on File then Open Settings File.
Once this has been done a window will
appear. (See figure 2.15)
You must select the settings file you wish to use. Click on the file name to select then open to use that file setting.
To save a setting, click save settings. If you have not named your current setting it will default to a generic name scheme, which is ap_(your login ID).
If you use the Save Settings As you can name your setting to your own personalized name.
Figure 2.12
Figure 2.13
Figure 2.14
Axis version 3.0 © Nexa Technologies, 2002-2004
2.4 Window Menu
The Window menu is used to control the presence or absence of Axis 3.0 modules and Tool Bars, as well as special layout management features.
ž Modules: the top section of the menu lists individual Axis 3.0 modules, and allows the user to toggle them on and off. A check box to the left of a module indicates that it is active and visible within the application (although it may be hidden beneath other modules). Because there are multiple instances of the Option Box, Stock Box, and Chart modules, each of these objects has a sub-menu to the right that
allows the specific numbered instance to be toggled on or off
ž Tool Bars: the middle section of the Window menu contains the two Axis 3.0 Tool Bars: Navigator and Quick Start. These choices toggle on and off these tool bars within the header area of the application.
ž Layout Management: – the four selections in the bottom section of the menu provide different types of layout control:
ž Tile: this selection will arrange all open modules by assigning each module roughly equal screen space. All modules will be visible but their size will not necessarily make sense relative to their function.
ž Cascade: this choice will take all open modules and arrange them one on top of the other, so that the title bar for each is visible. This layout does not make sense for usability, but it can be a useful starting point to see all of the open modules so that they can then be manually moved and arranged.
ž Smart Layout: using elements of both Tile and Cascade, with more intelligence, this feature arranges the open modules in a way that tries to increase their usability. The modules are each sized and placed
according to use and importance. Additionally, if more Charts or Stock Boxes are active than can reasonably de displayed simultaneously, Axis 3.0 will Cascade the Charts and Stock Boxes within a specific area, while Tiling other modules.
ž Snap Grid: this feature toggles on and off, and helps the user line up the corners and edges of the various modules. When Snap Grid is active, and a module is resized, or dragged and dropped, it will snap into a position relative to the edges and corners of the surrounding windows.
2.5 Navigation
The Navigator Tool Bar is activated by either selecting it from the Window menu, or by right-clicking in the Axis 3.0 application header area and selecting it from the drop-down menu that appears. This Tool Bar contains an icon for each active module, and allows the user to quickly locate the module and bring it to the foreground by simply clicking on the corresponding icon.
The labels for the various modules may be toggled on and off. Similarly, the stock symbols may be activated or deactivated below the icons representing the Option Box (chain link icon), Chart (bar graph icon), and Stock Box (book icon). Whether or not the labels or symbols are displayed, simply hovering over the icon will display the corresponding label as well.
The entire Navigator Tool Bar may be positioned by clicking and dragging the far left edge, where the ridges are located.
The Quick Start Tool Bar is activated by either selecting it from the Window menu, or by right-clicking in the Axis 3.0 application header area and selecting it from the drop-down menu that appears. This tool bar provides a shortcut for launching another instance of an Option Box, Stock Box, or Chart. When a new
Figure 2.16
Figure 2.17
(2.5 Navigation continued) Object is activated; it will appear in the same position in which it was last displayed, or in the upper left corner of the application when it is displayed for the first time.
The labels for the three buttons may be toggled on and off. Whether or not the labels are displayed, simply hovering over the icon will display the corresponding label as well.
The entire Quick Start Tool Bar may be positioned by clicking and dragging the far left edge, where the ridges are located.
2.6 Windows Management
Basic window controls:
Window Controls: within the Axis 3.0 application, each window, or module, has its own set of controls. These are the standard Microsoft Windows capabilities, and include Minimize, Maximize/Restore, and Exit buttons in the upper right corner of each module. Each module may also be resized by clicking and dragging on its edges or corners, or the entire module can be moved by clicking and dragging on its title bar.
Drag & Drop Functionality: Stock Symbols may be “dragged and dropped” from one module to another throughout Axis 3.0.
Common uses include dragging a symbol from a list in the Market View and dropping it into a Stock Box to get a Level II quote, or dragging a symbol from the Open Positions tab in the Account Box into a Stock Box in order to trade on the position. In general a Stock Symbol can be dragged and dropped from any Axis 3.0 module to any other module, which permits a Stock Symbol to be entered.
Basic window menus:
Right-Click Capabilities: the right mouse button is used in every module to display a context-sensitive menu of operations. Some of the right-click menus are brief, while others are complex. Some of the
modules have different right-click menus that will display depending on exactly where you click (for example in the Open Orders screen versus the Open Positions screen within the Account Box). Modules in which lists of information are presented (including the Market View, Positions Tab in the Account Box, etc) include these standard right-click menu choices:
Columns: this will display a Columns dialog box allowing for each of the columns within the module to be toggled on or off, as well as the column order to be determined.
Print: prints the contents of the module via a Windows Print dialog box.
Export: exports the contents of the list module to a Comma Separated Value (CSV) file. This type of file can be opened directly with Microsoft Excel and other spreadsheet programs.
Smart Width: this option will resize the columns in the module so that each column width is equal to the maximum data width and all the values can be seen.
Axis version 3.0 © Nexa Technologies, 2002-2004
2.7 Icons
ž Minimize Button: Clicking on this will minimize the active module window to the bottom of the application window.
ž Maximize Button: Clicking this button will maximize the selected module.
ž Close Button: Clicking this button will close out the selected module.
ž Stay to the Right Button: this button to the immediate right of the horizontal scroll bar toggles on and off and determines whether the chart automatically stays focused on the right edge (auto-scrolling as new data is displayed). If toggled off the chart will stay focused wherever it is manually set along its horizontal axis.
After Hours Button: toggle this clock-icon button on to display chart activity, which occurred outside of normal market hours.
Dome view Button: toggle this icon button on to display dome view or off to hide it.
Level 2 Button: toggle this icon button on to display Level 2 activity or off to hide it.
3.0 Charts and Studies
Axis 3.0 can display up to four charts simultaneously, and each separate chart is numbered. New charts are added via either the Window > Chart menu, or the “New Chart” button on the Quick Launch tool bar.
The basic elements of each chart include:
1. The Chart Header: with the company name in the title bar, and the Duration, Interval, and active studies settings in the upper left (see example at right).
2. Main Chart Area: displays the chart data in candlestick, bar, or line format. Studies are also displayed in this area overlaid with the pricing data or in 2nd box or 3rd box.
3. The Chart Symbol: the text field in the upper right. This works like the symbol field on each Stock Box. A symbol can be typed in, or can be dragged and dropped from other modules.
4. 2nd Box: this area is used to display different chart studies that you don’t want overlaid on the chart graph. To resize the area, hover over the horizontal bar, which separates 2nd from the main chart area until a double-arrow icon appears. Then click and drag the bar to the desired location. 5. 3rd Box: this area is used to display different chart studies that you don’t want overlaid on the chart
graph. To resize the area, hover over the horizontal bar, which separates 3rd Box from the main chart area until a double-arrow icon appears. Then click and drag the bar to the desired location. 6. Volume: below the main chart area the trading volume is displayed in bar or line format. To resize
the volume area, hover over the horizontal bar, which separates volume from the main chart area until a double-arrow icon appears. Then click and drag the bar to the desired location.
7. Horizontal Scroll Bar: use the scroll bar at the bottom of the chart to move along the time axis. 8. Stay to the Right Button: this button to the immediate right of the horizontal scroll bar toggles on
and off and determines whether the chart automatically stays focused on the right edge (auto-scrolling as new data is displayed). If toggled off the chart will stay focused wherever it is manually set along its horizontal axis.
9. After Hours Button: toggle this clock-icon button on to display chart activity, which occurred outside of normal market hours.
1
6
2
4
5
3
7
8
9
Figure 3.1Axis version 3.0 © Nexa Technologies, 2002-2004
3.1 Working with Axis 3.0 Charts
Other Basic features of Axis 3.0 software:1. Displaying Tick Details: click and hold the left mouse button in the main chart area to pop-up a details window. The details in this window correspond to the specific interval under the mouse pointer, and will change dynamically as the mouse is moved across the chart with the mouse button depressed. For each interval the display includes the Open, Close, High, and Low price data points, as well as the trading volume, time and date stamp, and the data values for any active studies within the interval.
2. Correcting a “Bad Tick”: although the Axis 3.0 servers filter for late or misleading tick data, occasionally some pricing data will be included in a chart
that causes the chart to be skewed. When this occurs the user may correct the bad tick by double-clicking on the incorrect candlestick on the chart to pop-up the edit utility. Enter the correct Open, Close, High, Low, or Volume value in the appropriate field, and click Save to refresh the chart and write the correction to the local disk. Axis 3.0 will retain the last 100 chart corrections on the local system so
that refreshing a chart from the server does not cause the bad tick to reappear.
3. Print Box: Chart boxes can all display a print box to help you better see what the market is doing with out having to look at your stock box for prints.
4. Time Gridlines: To better gage the time on a chart time gridlines drawn a dotted line down each hour.
Time Gridlines Print
Box
Figure 3.2
Figure 3.3
3.2 Drawing Trend and Support Lines
Each Axis 3.0 chart can display up to six trend lines and three support lines simultaneously. Trend lines are user-drawn diagonal lines used to plot a price trend in order to more easily identify when a stock breaks through that specific trend. Support lines are horizontal lines, which are typically used to define a support-resistance price range within which a stock is moving, also to help identify breakout events.
Using Trend Lines:
Adding Trend Lines: Hold down on the [Shift] key and then click and drag with the left mouse button to draw the line. The trend line will appear in the default color specified within the Chart Settings.
Adjusting a Trend Line: position the mouse pointer over the either end of the trend line until a 4-arrow pointer appears. Then click and drag the end of the line as desired to change its angle and location. Changing Color: position the mouse pointer over the either end of the trend line until a 4-arrow pointer
appears. Right-click and select “Color” from the pop-up menu. Choose the desired color from the custom color box and click [OK].
Deleting Trend Lines: position the mouse pointer over the either end of the trend line until a 4-arrow pointer appears. Right-click and select “Delete” from the pop-up menu to delete the selected line. Or select “Delete All” from the pop-up menu to delete ALL of the trend lines on the selected chart (other charts will not be affected). Trend lines are treated separately within the Intra-day, Daily, and Weekly charts. Trend lines placed on a Daily chart will NOT show up on the Weekly chart in the same Chart box. However, the maximum of six trend lines applies to the entire chart module – Intra-day, Daily, and Weekly combined.
When the maximum of six trend lines is reached, adding a seventh line will automatically delete the first.
4-Arrow Pointer
Trend line
Figure 3.5
Axis version 3.0 © Nexa Technologies, 2002-2004
(3.2 Drawing Trend and Support Lines continued) Using Support Lines:
Adding Support Lines: Hold down on the [Control] key and then click the left mouse button to insert the horizontal line. The support line will appear in the default color specified within the Chart Settings. Adjusting a Support Line: position the mouse pointer over the support line until a 2-arrow pointer appears. Then click and drag the line up or down as desired to change its location.
Changing Color: position the mouse pointer over the support line until a 2-arrow pointer appears. Right-click and select “Color” from the pop-up menu. Choose the desired color from the custom color box and click [OK].
Deleting Support Lines: position the mouse pointer over the support line until a 2-arrow pointer appears. Right-click and select “Delete” from the pop-up menu to delete the selected line. Or select “Delete All” from the pop-up menu to delete ALL of the support lines on the selected chart (other charts will not be affected). Support lines placed within a chart box are displayed on all three of the chart types within that box. Support lines placed on a Daily chart WILL show up on the Weekly and Intra-day chart in the same Chart box. When the
maximum of three support lines is reached, adding a fourth support line will automatically delete the first.
3.3 Basic Chart Settings
Each Axis 3.0 chart can have its own unique settings and parameters. Right-click within a chart to configure the Interval and/or Duration settings, or to select the Chart Settings window that corresponds to the selected chart. As shown in the figure, switching between Intra-day, Daily, and weekly presentations are
accomplished within the right-click menu. Additionally, the specific intervals in an Intra-day chart are selected from the Intra-day sub-menu, as are the number of days (1 to 5) that the minute chart will cover. When any of these menu choices are selected, the chart is instantly refreshed to the new settings.
Choose “Settings” from the right-click menu to display the Chart Settings dialog box. The first section in this Window is labeled “Chart” and controls all of the basic chart characteristics except for studies’ parameters. Each element controls chart behavior as follows:
Support line
2-Arrow Pointer
Figure 3.7
Figure 3.8
(3.3 Basic Chart Settings continued) After Hours Color: sets the background color for chart data, which occurs outside of normal market hours.
Background Color: set the background color for chart activity during standard market hours.
Chart: Select the charting graph style. Select the display type for price data within the main chart area. Expand any of these three selection so (via the “+” button) to reveal further choices to control the
display variables for each type of chart: Width: sets the width of the interval in terms of horizontal pixels.
Color: select a custom color for a bar or line element.
“Use Up/Down Colors”: Axis 3.0 will paint the chart bars/lines in the standard Up and Down price colors (green and red by default), based on a comparison of the Open and Close prices for the interval, indicating whether the interval was up or down.
Days in Day Chart: the total number of days to display when Daily is selected for the chart interval via the right-click menu.
Display Cross Hairs: check this box so display persistent cross hairs whenever the mouse pointer hovers over the chart.
Display Prints: Adds a Print Box to the chart box. (See figure 3.4)
Display Time Gridlines: Adds vertical gridlines to all hours. (See figure 3.4) Grid/Scale Color: select a custom color for grid lines and scale label font.
Line Thickness: set the width of the line used to draw a line chart (has no effect in Bar or Candlestick charts).
Link to Stock Box: by default, each chart is linked to the Stock Box of the corresponding number. This link allows the chart to update automatically when the symbol is changes in the corresponding stock box. To change the linkage enter the Stock Box number to which the chart should be linked – or enter a 0 (zero) if the chart should be independent of any linkages.
Overlay Color: when an overlay symbol is added to the chart, its line and price scale will appear in this color.
Overlay Symbol: type the symbol to be overlaid on the chart.
Solid Gridline Color: Color of all solid gridlines. If you wish you can select a custom color for the solid gridlines.
Solid Price Gridline: Will toggle between solid gridlines and dotted ones.
Support Line Default Color: define the default color for a horizontal line placed at a specific price point.
Support Line Thickness: specifies the thickness of a support line.
Time Scale Interval: this parameter determines how tight or wide the spacing is between the time scale values on the horizontal axis. A smaller number will condense the time periods into a smaller width, and a larger number will spread them out.
Trend Line Default Color: define the initial default color for a user-defined trend line.
Trend Line Thickness: specifies the thickness of a user-defined trend line. The Time Scale Interval may also be adjusted “on the fly” without using the settings dialog box. To change the horizontal scale of an active chart, place the mouse icon directly in the time scale area, and then click and drag to the left to condense the spacing, or click and drag to the right to expand the spacing. The Scale Interval number in the settings window will be set automatically.
(3.3 Basic Chart Settings continued)
Axis version 3.0 © Nexa Technologies, 2002-2004
Volume: select whether to display volume as a Bar or Line graph, and choose the colors and widths as desired. Or select “None” to hide the volume section of the chart completely.
Color: select a custom color for a bar or line element.
Width: sets the width of the interval in terms of horizontal pixels.
“Use Up/Down Colors”: Axis 3.0 will paint the chart bars/lines in the standard Up and Down price colors (green and red by default), based on a comparison of the Open and Close prices for the interval, indicating whether the interval was up or down.
Weeks in Week Chart: the total number of weeks to display when weekly is selected for the chart interval via the right-click menu.
3.4 Studies
3.4.1 ADX
To activate the ADX study:
Check the box next to the study title.
Expand the study (click the “+”) to set the specific parameters.
Choose the colors for the Four lines (ADX, ADX MA, DMI-, and DMI+)
Choose the number of intervals for ADX Period and DMI Period.
Select the “Overlay” option to display the study lines within the area as the pricing data, or leave this clear to display the study below the chart with a separate vertical scale.
Choose 3rd Box to display the study below the 2nd Box with a separate vertical scale.
Note: The 3rdand 2nd Boxes have there own vertical scale. But the vertical scale will be used for any study within that box. To insure proper display of a study do not combine studies with vertical scales a large contrast in scale size. If a study is added to another with a lard contrast in scale size the smaller of the two studies will appear as a straight line.
3.4.2 Bollinger Band
To activate the Bollinger Band study: Check the box next to the study title.
Expand the study (click the “+”) to set the specific parameters.
Choose the colors for the three lines (BB Avg., BB-, and BB+)
Choose the number of intervals for the BB Period and the number of Standard Deviations.
The Bollinger Band is always displayed as an overlay.
3.4.3 MACD
To activate the MACD study:
Check the box next to the study title.
Expand the study (click the “+”) to set the specific parameters.
Choose to view MACD in Line or Candlestick form Choose the colors for the two lines (MACD, and Trigger)
Choose the number of intervals for Period 1, Period 2, and Trigger Period.
Select the “Overlay” option to display the study lines within the area as the pricing data, or leave this clear to display the study below the chart with a separate vertical scale.
Choose 3rd Box to display the study below the 2nd Box with a separate vertical scale.
Note: The 3rdand 2nd Boxes have there own vertical scale. But the vertical scale will be used for any study within that box. To insure proper display of a study do not combine studies with vertical scales a large contrast in scale size. If a study is added to another with a lard contrast in scale size the smaller of the two studies will appear as a straight line.
Figure 3.12
Axis version 3.0 © Nexa Technologies, 2002-2004
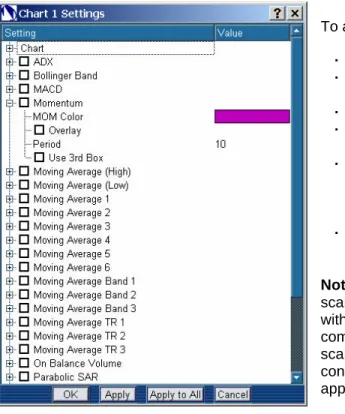
3.4.4 Momentum (MOM)
To activate the Momentum Study:
Check the box next to the study title.
Expand the study (click the “+”) to set the specific parameters.
Choose the color for the line.
Choose the number of intervals for the Momentum Period.
Select the “Overlay” option to display the study lines within the area as the pricing data, or leave this clear to display the study below the chart with a separate vertical scale.
Choose 3rd Box to display the study below the 2nd Box with a separate vertical scale.
Note: The 3rdand 2nd Boxes have there own vertical scale. But the vertical scale will be used for any study within that box. To insure proper display of a study do not combine studies with vertical scales a large contrast in scale size. If a study is added to another with a lard contrast in scale size the smaller of the two studies will appear as a straight line.
3.4.5 Moving Averages High/Low
To activate the Moving Average High/Low studies: Check the box next to the study titles.
Expand the studies (click the “+”) to set the specific parameters.
Choose the colors for the lines.
Choose the number of intervals for the Period. Moving Averages are always overlaid, so the “Overlay” option is not available.
Figure 3.15 Figure 3.14
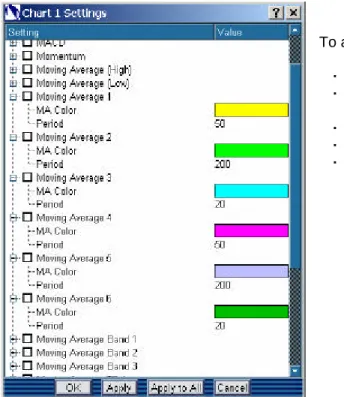
3.4.6 Moving Averages
To activate the Moving Average studies: Check the box next to the study titles.
Expand the studies (click the “+”) to set the specific parameters.
Choose the colors for the lines.
Choose the number of intervals for the MA Period. Moving Averages are always overlaid, so the “Overlay” option is not available.
3.4.7 Moving Averages Bands
To activate the Moving Averages Bands studies: Check the box next to the study titles.
Expand the studies (click the “+”) to set the specific parameters.
Choose the colors for the MAB- and MAB+ lines. Choose the number of intervals for the Period. Moving Averages are always overlaid, so the “Overlay” option is not available.
Figure 3.17 Figure 3.16
Axis version 3.0 © Nexa Technologies, 2002-2004
3.4.8 Moving Averages TR
To activate the Moving Averages TR studies: Check the box next to the study titles.
Expand the studies (click the “+”) to set the specific parameters.
Choose the colors for the MATR- and MATR+ lines. Choose the number of intervals for the Period. Moving Averages are always overlaid, so the “Overlay” option is not available.
3.4.9 On Balance Volume
To activate the On Balance Volume studies: Check the box next to the study titles.
Expand the studies (click the “+”) to set the specific parameters.
Choose the color for the On Balance Volume line. Select the “Overlay” option to display the study lines within the area as the pricing data, or leave this clear to display the study below the chart with a separate vertical scale.
Choose 3rd Box to display the study below the 2nd Box with a separate vertical scale.
Note: The 3rdand 2nd Boxes have there own vertical scale. But the vertical scale will be used for any study within that box. To insure proper display of a study do not combine studies with vertical scales a large contrast in scale size. If a study is added to another with a lard contrast in scale size the smaller of the two studies will appear as a straight line.
Figure 3.18
3.4.10 Parabolic SAR
To activate the Parabolic SAR studies: Check the box next to the study titles.
Expand the studies (click the “+”) to set the specific parameters.
Choose the number for the Acceleration. Choose the color for the Parabolic SAR line. Choose Start Long value.
Choose Start Point value.
Parabolic SAR is always overlaid, so the “Overlay” option is not available.
3.4.11 Rate of Change (ROC
)To activate the ROC study:
Check the box next to the study title.
Expand the study (click the “+”) to set the specific parameters.
Choose the colors for the ROC line.
Choose the number of intervals for the ROC Period. Select the “Overlay” option to display the study lines within the area as the pricing data, or leave this clear to display the study below the chart with a separate vertical scale.
Choose 3rd Box to display the study below the 2nd Box with a separate vertical scale.
Note: The 3rdand 2nd Boxes have there own vertical scale. But the vertical scale will be used for any study within that box. To insure proper display of a study do not combine studies with vertical scales a large contrast in scale size. If a study is added to another with a lard contrast in scale size the smaller of the two studies will appear as a straight line.
Figure 3.20
Axis version 3.0 © Nexa Technologies, 2002-2004
3.4.12 Relative Strength
To activate the RSI studies:
Check the box next to the study titles.
Expand the studies (click the “+”) to set the specific parameters.
Choose the colors for the each RSI line. Choose the number of intervals for the RSI Period(s).
Select the “Overlay” option to display the study lines within the area as the pricing data, or leave this clear to display the study below the chart with a separate vertical scale.
Choose 3rd Box to display the study below the 2nd Box with a separate vertical scale.
Note: The 3rdand 2nd Boxes have there own vertical scale. But the vertical scale will be used for any study within that box. To insure proper display of a study do not combine studies with vertical scales a large contrast in scale size. If a study is added to another with a lard contrast in scale size the smaller of the two studies will appear as a straight line.
3.4.13 Stochastic
To activate the Stochastic study:
Check the box next to the study title.
Expand the study (click the “+”) to set the specific parameters.
Choose the colors for the three lines (%D Fast, %D Slow, and %K)
Choose the number of intervals for the %D Fast Period, %D Slow Period, %K Period, and %K Slow period.
Select the “Overlay” option to display the study lines within the area as the pricing data, or leave this clear to display the study below the chart with a separate vertical scale.
Choose 3rd Box to display the study below the 2nd Box with a separate vertical scale.
Note: The 3rdand 2nd Boxes have there own vertical scale. But the vertical scale will be used for any study within that box. To insure proper display of a study do not combine studies with vertical scales a large contrast in scale size. If a study is added to another with a lard contrast in scale size the smaller of the two studies will appear as a straight line.
Figure 3.22
3.4.14 TRIX
To activate the TRIX study:
Check the box next to the study title.
Expand the study (click the “+”) to set the specific parameters.
Choose the colors for the two lines (TRIX, and Trigger) Choose the number of intervals for the TRIX Period and Trigger Period.
Select the “Overlay” option to display the study lines within the area as the pricing data, or leave this clear to display the study below the chart with a separate vertical scale.
Choose 3rd Box to display the study below the 2nd Box with a separate vertical scale.
Note: The 3rdand 2nd Boxes have there own vertical scale. But the vertical scale will be used for any study within that box. To insure proper display of a study do not combine studies with vertical scales a large contrast in scale size. If a study is added to another with a lard contrast in scale size the smaller of the two studies will appear as a straight line.
3.4.15 TSI
To activate the True Strength Indicator (TSI) study: Check the box next to the study title.
Expand the study (click the “+”) to set the specific parameters.
Choose the color for the TSI line
Choose the number of intervals for MA Period 1, MA Period 2, and the Momentum Period.
Select the “Overlay” option to display the study lines within the area as the pricing data, or leave this clear to display the study below the chart with a separate vertical scale.
Choose 3rd Box to display the study below the 2nd Box with a separate vertical scale.
Note: The 3rdand 2nd Boxes have there own vertical scale. But the vertical scale will be used for any study within that box. To insure proper display of a study do not combine studies with vertical scales a large contrast in scale size. If a study is added to another with a lard contrast in scale size the smaller of the two studies will appear as a straight line.
Figure 3.24
Axis version 3.0 © Nexa Technologies, 2002-2004
4.0 Quotes
4.1 Stock Boxes
1. Header: with the company name in the title bar
2. Symbol: the text field in the upper right. A symbol can be typed in, or can be dragged and dropped from other modules.
3. Dome view Button: Toggles the Dome view an advanced quote AND Order Entry feature. It is used by professional traders to quickly enter and manage live orders.
4. Level 2 Button: Toggles the Level 2 Quote data 5. Level 1 Quote Data: Self explanatory
6. Level 2 Quote Data: Self explanatory 7. Print Box: Prints from the market.
4.1.1 Entering a Symbol
There are four ways to enter a symbol into a Stock Box:
Type the symbol into the desired stock box and hit [ENTER].
Drag and Drop a symbol from another module (Market View, Index View, Account Box, Symbol Lookup, etc.) into a stock box.
Use the Stock Shortcut keys within the Hot Keys functionality (see section 2.3 for Setup information). Double-click on a symbol in another module to populate the symbol into the last active Stock Box. Once a valid equity or futures symbol is entered, the quote data will almost instantly appear, and Time & Sales “prints” will begin to appear as transactions for the stock are executed. Additionally, the title bar of the Stock Box will display the Stock Box Number, followed by the Market where the symbol trades, and the company name.
1 2 3 4 5 7 6 Figure 4.1
4.1.2 Level I Data
The upper portion of the Stock Box contains basic Level I quote data. To the right of the Symbol field is the Tick Indicator. The nine values in the Level I section are statically positioned; they can neither be turned on or off, nor resorted.
To re-size the columns: Right-click in this section and select “Smart Width” to automatically size the columns according to the data in each. Alternatively, hover over the indentations in the header bar just above the columns until the double-arrow pointer icon appears. Then click and drag the column border to the position desired.
Explanation of data fields:
Close: previous day’s closing price – the last official print during market hours (post-market trading is not included).
Open: today’s opening price – the first official print at the open of market hours (pre-market trading is not included).
Chg: the change in price. By default this is calculated by comparing the “Last” price to the “Close”. However, the “Chg” calculation can be set to compare “Last” against the “Open” price in the Setup Utility (see section 2.3).
High: the highest intra-day price (extended hours trading is not included). Low: the lowest intra-day price (extended hours trading is not included).
Vol: the volume of share traded in this symbol (this does typically include extended hours trading) Bid: the current Best Bid.
Ask: the current Best Ask.
Last: the most recent price to print in Time & Sales.
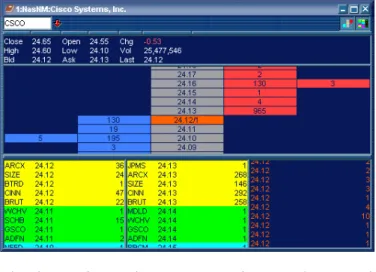
4.1.3 Level II Data
Unlike Level I quotes, which show only the single current transaction price, Level II quotes show all current parties (Market Makers and ECN’s for NASDAQ stocks, or the various exchanges for NYSE stocks) participating in the buying and selling of a stock, and the various price levels at which they are offering to buy or sell. Per United States exchange conventions, the Bids are shown in the left column, and the Asks on the right. Each price level is indicated by a color stripe within each column. The colors do not mean anything in an objective sense, but serve only to differentiate the price levels as the market moves. Color preferences and decimal place settings can be set via the Setup Utility, under “Quotes”, as can the convention of dividing
the share size by 100.
Figure 4.2
Axis version 3.0 © Nexa Technologies, 2002-2004
4.1.4 Time & Sales Prints
Every completed transaction for the selected equity or futures symbol will appear in the “Time & Sales” window to the right of the Level II “Ask” column. In order for the prints to convey useful information they are color-coded at the instant of the print as it relates to the Bid and Ask prices at that moment. The color used for each type of print is described below, and can be customized via the “Colors” section in the Setup Utility.
The default print colors denote the following: Green: transaction price is at the Ask. Red: transaction price is at the Bid.
White: transaction price between the Bid and Ask. Purple: transaction price is below Bid.
Gold: transaction price above Ask.
Teal(Cyan): the transaction print occurs in a “Crossed” or “Locked” market. A “Crossed” market indicates that the best Bid price is greater than the best Ask price, while “Locked” denotes that the best Bid and Ask prices are the same.
RoyalBlue: the relationship between the transaction price and the Bid/Ask levels are unknown. It is important to note that the color of the print is relative to the Bid and Ask price levels, which are changing constantly. Therefore, multiple prints of the same color can easily be at different prices. If all the prints are red and/or purple, chances are the price of the prints is gradually decreasing. Conversely, if all the prints are green and/or yellow, the price is probably increasing. If the colors are equally mixed, the prices are probably not moving very much as buy and sell pressure are roughly the same.
The Up/Down Tick Indicator in the Level I quote display changes in accordance with the Level II quotes and the rules of determining up-tick and downtick varies with each market.
For the NSYE and AMEX, an up-tick is determined by the last transaction print. If the last print is at or above the best ask, then the stock is in an up tick. If the last print is at or below the best bid then, the stock is in a down tick. Any print in between the best asks and best bid will leave the stock tick unchanged.
For NASDAQ securities, an up tick is created when the best bid is increased. A down trend is present when the best bid is lower than the last best bid.
4.1.5 The Book Box
The Book Box is used to display depth of market within a specific ECN and is
activated via the Window Menu > Stock Box > Book Box. It displays a Level II quote in two columns for the ECN selected in the drop-down to the right of the symbol field. However, the Book Box is a detailed
representation of the order and price activity within the selected ECN only. Note that the best Bid and Ask from the INET Book will show up within the standard NASDAQ Level II quote with a Market Maker ID of “CINN” because all INET quotes for NASDAQ equities are routed through the Cincinnati Stock Exchange (as of Oct. 2002). The best Bid and Ask from the ARCA Book will show
up within the standard NASDAQ Level II quote with a Market Maker ID of “ARCX”.
To view the INET or ARCA Book for a particular stock, the symbol can be typed directly into the Book Box module, or it can be dragged and dropped in, just as with the Stock Boxes.
Figure 4.4
4.1.6 The Dome View
WARNING: the Dome View is an advanced quote AND Order Entry feature. It is used by professional traders to quickly enter and manage live orders. Clicking ANYWHERE within the Dome View screen WILL send a live order to the markets or CANCEL an existing order. DO NOT use this feature until you are completely familiar with its operation.
Both the Dome View and the Level II sections of the Stock Box can be toggled on and off independently within each Stock Box. As shown in the figure above, the two buttons near the end of the Stock Box header controls these features. Depressing either button will toggle on the corresponding feature, and clicking again will toggle it off. Each Stock Box can display or hide these sections independent of each other.
When active, as in the figure 4.6, the Dome View presents price and share size data in a five-column Display. Once the display is understood, the Dome View can be a very productive tool for professional traders.
WARNING: clicking on the Dome View WILL place or cancel orders!
The columns within the Dome View convey information and provide functionality as follows:
Center/Gray: the middle column displays the current quoted price levels, with the current Best Bid and Best Ask roughly in the vertical center. The last Time & Sales print is displayed in the center column by highlighting the price of the last print in the color of the actual print, and inserting the share size. Clicking on the middle column has no impact.
First Right/Red: the red column to the immediate right of center displays the total combined share sizes that are offered for sale (red = sell) at each price level. Since offers to sell are at or above the Best Ask price, the red column stays in the upper right portion of the view.
Clicking in this column will place a SELL order at the price level clicked if open positions are held in this symbol, or a SHORT order if open positions are not held.
Far Right/Red: the red column to the far right will display the total share size, by price, of open Sell (or Short) Orders for this symbol
(e.g. an order, or multiple orders, to sell a total 300 shares at 24.16 in the figure 4.9). Click on the order share size in this column to CANCEL ALL orders at that Price.
Figure 4.9
Figure 4.7 Figure 4.6
Axis version 3.0 © Nexa Technologies, 2002-2004
(4.1.6 Dome View continued) First Left/Blue: the blue column to the immediate left of center displays the total combined share sizes divided by 100) that are offered to buy (blue = buy) at each price level. Since offers to buy are at or below the Best Bid price, the blue column stays in the lower left
portion of the Dome View. Clicking in this column will place a BUY order at the price level clicked.
Far Left/Blue: the blue column to the far left will display the
total share size, by price, of open Buy Orders for this symbol (e.g. an order, or multiple orders, to buy a total 500 shares at 24.10 in the figure 4.10). Click on the order share size in this column to CANCEL ALL orders at that Price.
To recap the functionality of the Dome View: Click Center (Gray) Column = no action
Click First Right (Red) Column = place a Sell or Short order at the price clicked, using the settings in the Order Ticket.
Click First Left (Blue) Column = place a Buy order at the price clicked, using the settings in the Order Ticket.
Click Far Right (Red) Column = cancel all open orders at the price clicked. Click Far Left (Blue) Column = cancel all open orders at the price clicked.
4.2 Option Boxes
Option Box Interface:
A. Underlying Symbol: Symbol for the underlying stock
B. Option Strike Month: Month of expiration on contracts being traded. C. Option Symbol: Symbol of Option you wish to trade.
D. Tabs: Activity Tabs to switch between Calls Puts and Option Montage. E. Columns: Quote Data Columns
F. Option Chains: Chain for the symbol in the underlying symbol box for the month chosen. A C B D E F Figure 4.10 Figure 4.11