Discovering Bioactive Peptides and Characterizing the Molecular
Pathways that Control Their Activity
(Article begins on next page)
The Harvard community has made this article openly available.
Please share how this access benefits you. Your story matters.
Citation
Mitchell, Andrew. 2012. Discovering Bioactive Peptides and
Characterizing the Molecular Pathways that Control Their Activity.
Doctoral dissertation, Harvard University.
Accessed
April 17, 2018 3:31:03 PM EDTCitable Link
http://nrs.harvard.edu/urn-3:HUL.InstRepos:9406016
Terms of Use
This article was downloaded from Harvard University's DASH
repository, and is made available under the terms and conditions
applicable to Other Posted Material, as set forth at
http://nrs.harvard.edu/urn-3:HUL.InstRepos:dash.current.terms-of-use#LAA
Copyright © 2012 by Andrew James Mitchell
All rights reserved.
Professor Alan Saghatelian Andrew James Mitchell
Discovering Bioactive Peptides and Characterizing
the Molecular Pathways that Control Their Activity
Abstract
Bioactive peptides constitute a major class of signaling molecules in animals and have been shown to play a role in diverse physiological processes, including hypertension, appetite and sleep. As a result, knowing the identity of these molecules and understanding the mechanisms by which they are regulated has basic and medical significance. In this dissertation, I describe the
development and application of novel methods for discovering bioactive peptides and the molecular pathways that control their activity.
Recent analyses of mammalian RNAs have revealed the translation of numerous short open reading frames (sORFs). However, it is unknown whether these translation events produce stable polypeptide products that persist in the cell at functionally relevant concentrations. In Chapter 1, I describe a study in which we used a novel mass spectrometry-based strategy to directly detect sORF-encoded polypeptides (SEPs) in human cells. This analysis identified 115 novel SEPs, which is the largest number of mammalian SEPs discovered in a single study by more than a factor of 25. We observed widespread translation of SEPs from non-canonical RNA contexts, including polycistronic mRNAs and sORFs defined by non-AUG start codons. We also found that SEPs possess
properties characteristic of functional proteins, such as stable expression, high cellular copy numbers, post-translational modifications, sub-cellular localization, the ability to participate in specific protein-protein interactions and the ability to influence gene expression. Taken together, these findings provide the strongest evidence to date that coding sORFs constitute a significant human gene class.
In chapter 3, I describe a study in which we combine quantitative in vivo
peptidomics, classicalbiochemical experiments and pharmacological studies in
animal models to elucidate the metabolism of the neuropeptide substance P in the spinal cord. We identified two physiological substance P metabolites: the N-terminal fragments SP(1-9) and SP(1-7). Focusing our efforts on the SP(1-9)-producing pathway, we determined that an activity sensitive to the inhibitor GM6001 is the dominant SP(1-9)-generating activity in the spinal cord. We also show that GM6001 treatment causes a nearly three-fold increase in endogenous substance P levels in the spinal cords of mice, highlighting the functional
Table of Contents
Chapter 1: Discovering and Characterizing Human Short Open Reading
Frame-Encoded Polypeptides 1
1.1 Introduction 2
1.2 Peptidomics analysis of human myelogenous leukemia cells 4
1.3 Analyzing peptidomics data to identify novel SEPs 7
1.4 Probing the human transcriptome using deep RNA sequencing technology 11
1.5 Validating SEPs encoded by annotated transcripts 14
1.6 Discovering SEPs encoded by long intergenic non-coding RNAs (lincRNAs) 21
1.7 Discovering SEPs encoded by unannotated transcripts 25
1.8 Identifying post-translationally modified SEPs 32
1.9 Exploring the global properties of SEPs 34
1.10 Testing SEP expression from RefSeq transcripts 38
1.11 Alternative splicing of annotated protein-coding genes generates SEP-producing transcripts 42
1.12 Confirming a non-AUG start site and investigating the mechanism of bicistronic expression 44
1.13 Measuring the cellular concentrations of SEPs 48
1.14 SEPs exhibit sub-cellular localization 50
1.16 SEPs influence gene expression 54
1.17 Conclusion 61
1.18 Materials and methods 62
1.19 References 74
Chapter 2: Substance P: A Case Study in the Challenges of Investigating Bioactive Peptide Regulation 82
2.1 Introduction 83
2.2 Substance P and its functional role in mammals 84
2.3 Substance P biogenesis, secretion and mechanism of action 84
2.4 Substance P inactivation 85
2.5 In vitro approaches to studying substance P degradation 88
2.6 In vivo approaches to studying substance P degradation 89
2.7 Conclusion 90
2.8 References 91
Chapter 3: Elucidating Substance P Regulation in the Spinal Cord 103
3.1 Introduction 104
3.2 Quantitative in vivo peptidomics analysis of mouse spinal cord to identify physiological metabolites of substance P 105
3.3 In vitro degradation assay with mouse spinal cord lysate 113
3.5 Class-specific protease inhibitor screening to identify candidate
enzyme class 119
3.6 Enzyme-specific protease inhibitor screening to evaluate
candidate enzymes 121
3.7 Wild type vs NEP-/- comparative study 124
3.8 Cross-linking experiments using activity-based probes reveal that two enzymes may be responsible for the GM6001-sensitive activity 127 3.9 Treatment with GM6001 significantly alters endogenous
substance P levels 129
3.10 Conclusion 131
3.11 Materials and methods 132
List of Figures
Figure 1.1: Peptidomics workflow 6
Figure 1.2: Discovering SEPs 8
Figure 1.3: Generating the complete transcriptome of K562 cells 13
Figure 1.4: Overview of SEPs 20
Figure 1.5: Length distribution of high-confidence SEPs 35
Figure 1.6: Probable start codon-usage distribution of SEP-encoding sORFs 37
Figure 1.7: Expression of SEPs 39
Figure 1.8: Alternative splicing of SEP-encoding transcripts 43
Figure 1.9: Identifying the start site of FRAT2-SEP 46
Figure 1.10: Characterization of the non-AUG initiation codon of the FRAT2-SEP sORF 47
Figure 1.11: SEP quantification 49
Figure 1.12: DEDD2-SEP localizes to the mitochondria 51
Figure 1.14: FRAT2-SEP participates in a protein-protein interaction with P32 53
Figure 1.15: Heat map of the expression levels of the 50 most up-regulated genes and the 50 most down-regulated genes in the C7ORF49-SEP and DNLZ-SEP overexpression experiments 56
Figure 2.1: The structure of substance P 84
Figure 3.1: Quantitative in vivo peptidomics analysis of mouse spinal cord 107
Figure 3.3: In vitro experiment with either the insoluble or soluble fraction
of mouse spinal cord lysate 114
Figure 3.4: Assembling a candidate list SP(1-9)-producing enzymes using
compendiums of peptidase information 118
Figure 3.5: Sensitivity of substance P-degrading activity to class-specific
peptidase inhibitors 120
Figure 3.6: Sensitivity of substance P-degrading activity to enzyme-specific
peptidase inhibitors 122
Figure 3.7: Comparison of substance P-degrading activity of wild type and
NEP-/- mouse spinal cords 126
Figure 3.8: Determining the number and size of proteins responsible for the
GM6001-sensitive substance P-degrading activity 128
Figure 3.9: Measuring the impact of GM6001 treatment on substance P
List of Tables
Table 1.1: List of high-confidence SEPs derived from RefSeq transcripts 15 Table 1.2: List of high-confidence SEPs derived from lincRNA transcripts 24 Table 1.3: List of high-confidence SEPs derived from K562 RNA-seq
transcripts 26
Table 1.4: List of high-confidence post-translationally modified SEPs derived
from K562 RNA-seq transcripts 33
Table 1.4: Results of gene set enrichment analysis for DNLS-SEP 59 Table 1.5: Results of gene set enrichment analysis for C7ORF49-SEP 60 Table 3.2: Concentrations of substance P, SP(1-9) and SP(1-7) in mouse
Acknowledgements
I thank Alan Saghatelian for his insightful advice, both strategic and technical, on the research described herein; these projects would not have succeeded without his contributions. I also thank Alan for creating an excellent environment in which to work. The camaraderie I have felt with my colleagues has been a special part of my experience in graduate school and I donʼt think it would have been possible had Alan not actively fostered a culture of openness and collaboration in our group.
In addition, I thank Bogdan Budnik and John Neveau for providing technical advice on mass spectrometry experiments and good company at the Northwest happy hours; Arthur Tinoco for setting an excellent example in the laboratory and being a great collaborator; Whitney Nolte for answering so many of my silly questions; Anna Marie Lone for tolerating with good humor my
somewhat frequent lectures on why America is better than Norway (and also answering my silly questions); Yui Vinayavekhin for ensuring that even the lab safety officer is not above the law; Edwin Homan for the breakroom
conversations on politics and lipids; Tejia Zhang for inspiring me with her diligence in the laboratory and the neatness of her script; Yun-Gon Kim for his stoicism in the face of LTQ maintenance; Amanda McFedries for representing MCB; Adam Schwaid for his humor, competence and succinct emails; and, finally, Mathias Leidl and Jiao Ma for keeping the Saglab annex lively during the final stretch.
Chapter 1
Discovering and Characterizing Human Short Open Reading Frame-Encoded Polypeptides
Alan Saghatelian and I designed and developed the SEP-discovery platform with help from Drs. Amir Karger and James Cuff on generating the custom polypeptide databases and related support. Dr. Sarah Slavoff and I performed the peptidomics experiments. Dr. Bogdan Budnik analyzed the samples on the mass spectrometer. Dr. Sarah Slavoff, Adam Schwaid and I analyzed the data, synthesized peptides and cloned constructs. Adam Schwaid and I performed the quantitative SEP measurements and prepared samples for the L1000 experiment. Dr. Sarah Slavoff performed the heterologous expression experiments that defined the FRAT2-SEP start site and uncovered the FRAT2 protein-protein interaction with P32. Willis Read-Button and Aravind Subramanian performed the L1000 assay and subsequent gene set enrichment analysis. Joshua Levin generated the RNA-seq data. Moran Cabili and John Rinn assembled the K562 transcriptome from the RNA-seq data and culled the lincRNAs.
1.1 Introduction
Short open reading frames (sORFs) in the 5ʼ-untranslated region (5ʼ-UTR) of eukaryotic mRNAs (uORFs) are well studied (1) and several have been shown to produce polypeptides (2, 3). In addition to uORFs, a handful of other sORFs in
bacteria (4), viruses (5), plants (6, 7), Saccharomyces cerevisiae (8),
Caenorhabditis elegans (9), insects (10, 11), and humans (12) have been discovered to encode polypeptides. Notable among them are the peptides
encoded by the polycistronic tarsel-less (tal) gene in Drosophila, which are as
short as 11 amino acids and regulate fly morphogenesis (10, 11).
Recently, computational analysis of the mouse transcriptome using improved gene-prediction algorithms has suggested that sORF-encoded polypeptides (SEPs) are significantly underrepresented in current protein catalogues (13), leading to speculation that coding sORFs constitute an unrecognized mammalian gene class. This hypothesis was bolstered by subsequent ribosome profiling studies in mouse embryonic stem cells, which found evidence that hundreds of sORFs in the mouse transcriptome are engaged by the protein translation machinery. However, since these studies did not directly detect the presence of any sORF-encoded polypeptides (SEPs), it remains unclear whether sORFs are widely translated into polypeptides that persist in the cell at functionally relevant concentrations. Indeed, follow-up experiments on sORFs identified as being translated by ribosome profiling failed to identify any polypeptide expression (14), indicating that at least some of the implicated sORFs are false positives.
While no general approach exists for discovering SEPs, several attempts
have been made to systematically identify these molecules. In E. coli, for
example, experiments in which predicted sORFs were epitope-tagged revealed 18 SEPs (15). In another example, a combination of computational and
experimental approaches identified 299 potentially coding sORFs in S.
cerevisiae, four of which were confirmed to produce protein and 22 of which appeared to regulate growth (8). Finally, in human cells, an unbiased proteomics approach identified a total of four SEPs (defined here as polypeptides that are synthesized on the ribosome at a length of 150 amino acids or less) between the K562 and HEK293 cell lines with a length distribution of 88-148 amino acids (16).
The discordance between the small number of SEPs detected in human cells (16) and the large number of coding sORFs described by ribosome profiling (17) and computational methods (13) leaves open the possibility that SEPs are not produced as predicted by these methods or else are rapidly degraded and therefore not detectable. Indeed, one might speculate that sORFs are translated as a unique mode of gene regulation whereby the process of translation itself rather than the synthesized product is the functional agent, or as part of a “checkpoint” or stalling mechanism in the trafficking of functional RNAs, or perhaps simply due to stochastic binding of ribosomes to pseudo-initiation sites that arise in the genome by chance.
Thus, there is a need for an approach that can directly detect and validate the products of translated sORFs on a global scale. We therefore developed a novel
strategy for SEP discovery that integrates an optimized peptidomics and bioinformatics platform with a rigorous evaluation procedure based on manual spectra analysis and use of synthetic standards. Applying this approach to human cells, we uncovered 118 unannotated SEPs, which is the largest number of human SEPs ever reported in a single study by approximately a factor of thirty. We also analyze SEP-encoding sORFs to reveal several unexpected features of SEP translation, including widespread initiation at non-AUG start codons and polycistronic expression. Perhaps most intriguingly, though, we find that SEPs possess properties characteristic of functional proteins, such as stable expression, high cellular copy numbers, post-translational modifications, subcellular localization, the ability to participate in specific protein-protein interactions and the ability to influence gene expression. Taken together, these findings provide the strongest evidence to date that coding sORFs constitute a significant human gene class.
1.2 Peptidomics analysis of human myelogenous leukemia cells
Peptidomics is a liquid chromatography-tandem mass spectrometry (LC-MS/MS)-based technique aimed at the comprehensive visualization and analysis of endogenous peptides (18, 19). Peptidomics experiments are distinguished from traditional proteomics experiments in that the core workflow contains steps designed to preserve and enrich small polypeptides (18-21). In the context of the present study, the use of peptidomics is intended to increase the total number of
SEPs detected and expand the detection range to include shorter SEPs by eliminating the signal-suppressing effects of large proteins. We isolated peptides from K562 cells (22), a human leukemia cell line, because these cells were the subject of the most successful SEP discovery effort to date and we could therefore use the previously reported SEPs to benchmark our performance (16).
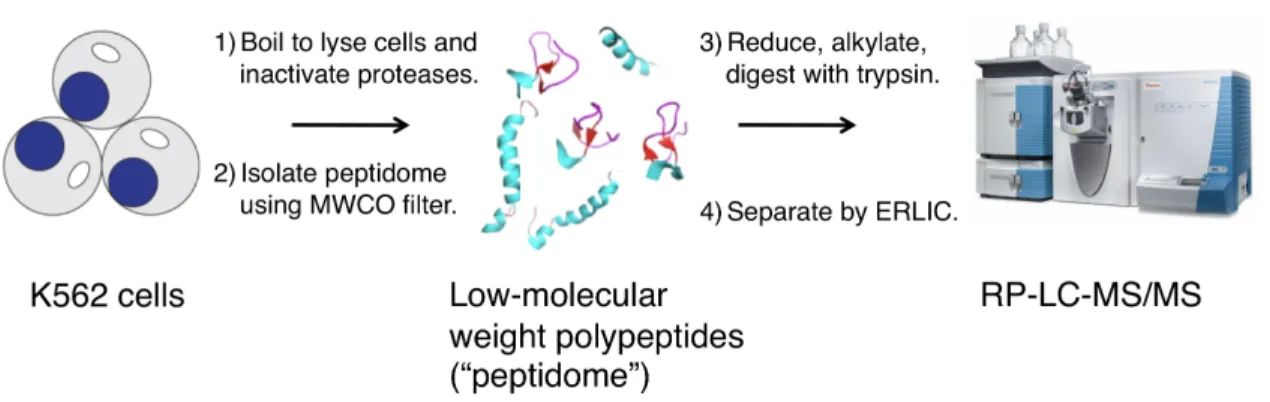
Endogenous peptides were isolated using an optimized peptidomics workflow developed in our laboratory (21) (Figure 1.1), with great care being taken to reduce proteolysis. Proteolysis is detrimental because the processing of cellular proteins greatly increases the complexity of the peptidome, which deteriorates the signal-to-noise ratio during the subsequent analysis (23). Practically, isolation of the peptidome from K562 cells is accomplished by boiling a frozen cell pellet to lyse the cells and simultaneously inactivate any proteases. Heat inactivation of proteolytic activity is common practice in peptidomics and has led to the identification of known peptides from cells or tissues to demonstrate its reliability (24-27). After cell lysis, the lysate is passed through a molecular weight cut-off filter to separate small polypeptides (hereafter, “peptidome”) from the rest of the proteome. We prepared two sets of samples, one enriched using a 30 kDa MWCO filter and another enriched using a 10 kDa MWCO filter. This was done to maximize our coverage of the smallest SEPs while ensuring that larger SEPs were not overlooked.
After isolating the peptidome, we reduced and alkylated the sample to eliminate disulfide bonds and prevent them from re-forming; covalent links
Figure 1.1 Peptidomics workflow. First, we boil a frozen K562 pellet to lyse the cells and simultaneously eliminate protease activity. Second, we isolate the peptidome by passing the cell lysate through a molecular weight-cutoff filter. Next, we reduce and alkylate the peptide mix to eliminate disulfide bonds and prevent them from re-forming prior to analysis; covalent links between peptide side chains can make definitive MS/MS spectra interpretation difficult or impossible. After that, we fractionate the peptidome by electrostatic repulsion-hydrophilic interaction chromatography (ERLIC), which separates analytes by hydrophobicity and isoelectric point. This step simplifies the sample to allow for deeper coverage of the peptidome. Finally, we analyze each ERLIC fraction by reversed-phase-liquid chromatography-tandem mass spectrometry (RP-LC-MS/MS), thus generating a collection of spectra from which the identities of the peptides can be determined.
between peptide side chains can make definitive MS/MS spectra interpretation difficult or impossible. The sample was then exposed to trypsin to generate peptide fragments that are ideal for subsequent LC-MS/MS analysis. However, prior to analysis, the trypsinized peptides were fractionated by electrostatic repulsion-hydrophilic interaction chromatography (ERLIC)(28), which separates peptides based on their hydrophobicity and isoelectric point. ERLIC fractionation has been reported to significantly improve detection sensitivity in proteomics experiments (29), so we included this step to deepen our peptidome coverage. Finally, each ERLIC fraction was analyzed by nano-flow reversed-phase (RP)-LC-MS/MS system with a high-resolution mass spectrometer.
1.3 Analyzing peptidomics data to identify novel SEPs
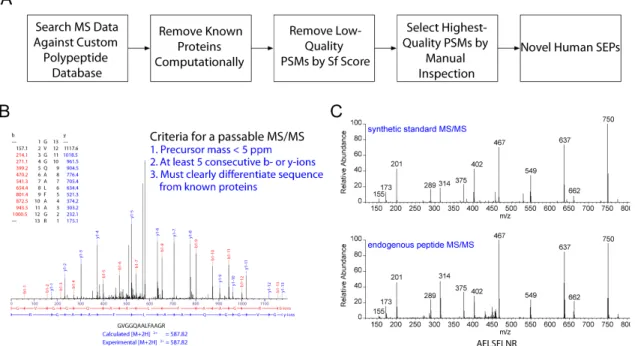
To identify SEPs, it was necessary to develop a modified protocol for LC-MS/MS data analysis. Standard proteomics and peptidomics approaches identify peptides by matching experimentally observed spectra to databases of predicted spectra based on annotated genes. Such databases would not necessarily contain the predicted spectra of SEPs. We therefore created a custom database containing all polypeptides that could possibly be translated from the annotated human transcriptome (The National Center for Biotechnology Reference Sequence, or RefSeq (30)) or the reverse-complement thereof (Figure 1.2A). We were interested in polypeptides that could be translated from the reverse-complement of annotated transcripts because of reports of pervasive transcription of the antisense strands of eukaryotic genes ((31)).
Figure 1.2 Discovering SEPs. (A) An LC-MS/MS-based peptidomics platform was used to profile K562 cells. The MS/MS data were searched against a custom protein database derived from human RefSeq transcripts to identify polypeptides in K562 cells. Tryptic peptides that were exact matches to a segment of an annotated protein were computationally filtered. In addition, tryptic peptides that differed from annotated proteins by only a single amino acid were also removed to avoid the false identifications arising from point mutations in known proteins. The sequence assignment of these putative SEPs was validated by visual inspection of the tandem MS spectra. Finally, we referenced K562 RNA-seq data to verify that that detected peptides were derived from a sORF rather than an unannotated ORF longer than 450 nucleotides or a mutated annotated ORF. Any tryptic peptide that fit these criteria was identified as arising from a novel human SEP. (B) Tandem MS spectra were visually inspected to ensure that there was sufficient sequence coverage to unambiguously differentiate the peptide from similar known protein sequences. The spectra were required to have a precursor mass error of less than 5 ppm and a sequence tag of five consecutive b- or y-ions. (C) We experimentally validated some of these assignments by chemically synthesizing the diagnostic peptide and comparing its tandem MS spectra of that of the endogenous peptide. This particular peptide is derived from a sORF found on a non-coding RNA (chr16:86563805-86589025).
Using Sequest, an analysis program used to identify peptides from MS/MS spectra (32, 33), we compared >200,000 MS/MS peptide spectra to this RefSeq-derived polypeptide database. This resulted in 6548 unique peptide identifications. We arrived at a tentative list of SEPs by keeping only those tryptic peptides that differed by at least two amino acids from every annotated protein to minimize the possibility of false positives arising from polymorphisms in annotated genes. We then winnowed the list down further to a candidate set by eliminating all peptide-spectrum matches (PSMs) with an Sf score of less than 0.4, which is a typical threshold used in proteomics studies to cull PSMs that can be used with confidence to identify proteins (34). (The Sf score is a composite metric generated by the SEQUEST algorithm to indicate the strength of a PSM. It takes into account the preliminary score, the cross-correlation and the difference in strength between the highest scoring PSM and the second highest scoring PSM for a given spectra.)
Due to the small size of SEPs, it is unlikely that an unbiased peptidomics experiment will detect more than one tryptic fragment of a given SEP. This contrasts with standard proteomics studies, which, on account of the numerous tryptic fragments generated from larger polypeptides, will typically uncover two or more peptides to support the presence of a protein. Realizing that we would likely not be able to rely on the confidence contributed by the inherent redundancy of multiple-peptide protein identifications for SEP discovery, we submitted the
candidate PSMs to a rigorous evaluation procedure to ensure the highest confidence in each peptide identification.
First, we discarded any PSM with an Sf score of less than 0.75. This eliminated over 95% of the candidate set. We then visually examined each remaining MS/MS spectrum to ensure that it met a stringent set of criteria (Figure 1.2B). In particular, we required that there be a sequence tag of five consecutive b- or y-ions, a precursor mass error of <5 ppm, and sufficient sequence coverage to unambiguously differentiate each peptide from every annotated protein sequence. This step reduced the remaining peptide pool by approximately 75%, for a total of 39 SEPs, three of which were previously reported and thus served as positive controls (16) and 36 of which are novel. Our PSM evaluation procedure therefore selected the highest quality ~1% of the peptide identifications in our original candidate set. As a check on the effectiveness of this procedure, we compared the experimentally collected MS/MS spectra of several identified peptides to that of identical synthetic peptides (Figure 1.2C). The spectra of the synthetic peptides were nearly identical to those of the endogenous peptides, confirming the identifications and validating our spectra evaluation procedure.
1.4 Probing the human transcriptome using deep RNA sequencing technology
Although we were extremely careful in evaluating peptide-spectra matches to ensure that the tryptic peptides we identified were present in the sample, it occurred to us that there were still several potential sources of false positives that we had not eliminated. For one thing, we were not able to exclude the possibility that some of the identified peptides were produced from a long ORF on an RNA that was not catalogued in RefSeq (30) rather than from a sORF on an annotated transcript, as we suspected was the case. Indeed, since it is probable that not all RefSeq genes will be expressed in a given cell line, we could not even be sure that the transcripts to which we had ascribed SEPs were present in K562. Additionally, a recent report had indicated that mRNAs can undergo post-transcriptional modifications that lead to alternate protein sequences (35). This phenomenon could also lead to the misidentification of SEPs. Lastly, although we had only admitted peptides whose sequence was at least two amino acids different from the nearest annotated protein sequence, it was still conceivable that a point mutation in an annotated gene could have led to an erroneous SEP identification.
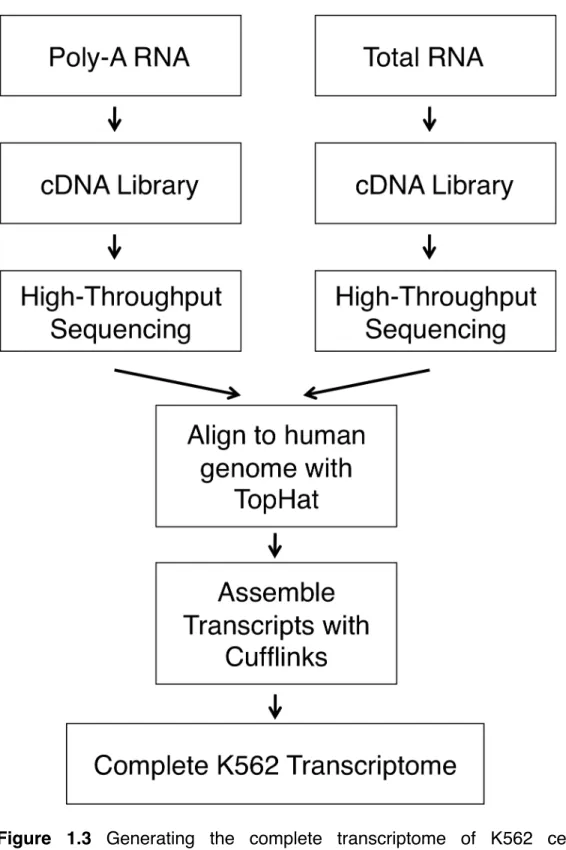
Having a detailed and comprehensive knowledge of the K562 transcriptome would enable us to rule out these potential sources of false positives. We therefore deep-sequenced K562 cellular RNA and assembled it
into the complete K562 transcriptome (Figure 1.3). Poly-adenylated RNA and total RNA were isolated separately from cultured K562 cells and cDNA libraries were generated from each sample. These libraries were then sequenced using Illumina high-throughput sequencing technology and the resulting reads were aligned to the human genome using the splice junction mapper TopHat (36). Finally, Cufflinks (36) was used to assemble the transcriptome. Including mono-exonic RNAs, this analysis yielded over 700,000 unique transcripts.
Figure 1.3 Generating the complete transcriptome of K562 cells. Poly-adenylated RNA and total RNA were isolated separately from cultured K562 cells and cDNA libraries were generated from each sample. These libraries were then sequenced using Illumina high-throughput sequencing technology and the resulting reads were aligned to the human genome using the splice junction mapper TopHat (36). Finally, Cufflinks (36) was used to assemble the transcriptome.
1.5 Validating SEPs encoded by annotated transcripts
We wanted to determine whether the 39 RefSeq transcripts to which we had assigned SEPs in our previous discovery effort were actually present in K562. Crosschecking these transcripts with our assembled RNA-seq data revealed that 37/39 SEPs were present. Interestingly, the implicated antisense transcript, the existence of which had never before been experimentally verified, was present in the sample.
Next, we wanted to verify that there were no long, unannotated ORFs that could be producing the detected SEPs. We therefore searched the 37 detected peptides that we had assigned to these transcripts against a theoretical protein
database generated by in silico translation of the complete K562 transcriptome
using the BLAST algorithm (37). All 37 SEPs mapped uniquely to the annotated transcript sORF to which they had been assigned in our initial study (Table 1.1). With this analysis, then, we eliminated the possibility that the detected peptides had arisen from point mutations in annotated genes, longer unannotated ORFs, or post-transcriptional modification or editing of RNAs and were thereby left with a high-confidence set of annotated transcript-derived SEPs.
The 37 SEPs discovered through analysis of RefSeq transcripts fall into five major categories: (i) those located in the 5ʼ-UTR, (ii) those located in the 3ʼ-UTR, (iii) those located (frameshifted) inside the main coding sequence (CDS), (iv) those located on non-coding RNAs (ncRNAs), and (v) those located on antisense transcripts (Figure 1.4). Many of these SEPs appear to be derived from
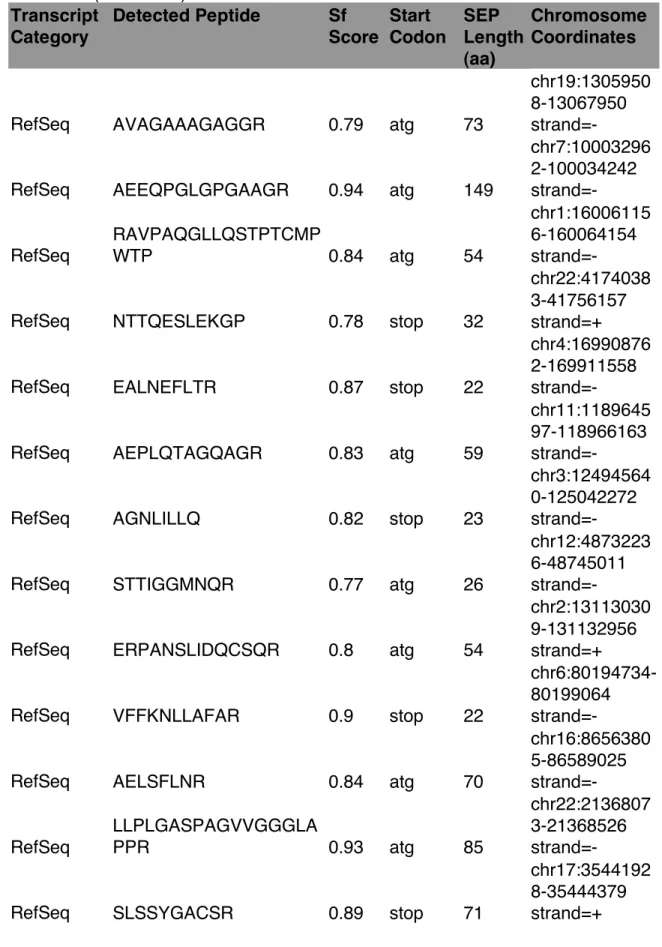
Table 1.1 List of high-confidence SEPs derived from RefSeq transcripts. When present, an upstream in-frame AUG was assumed to be the initiation codon. If no upstream AUG was present, the initiation codon was assigned to an in-frame near-cognate non-AUG codon embedded within a Kozak-consensus sequence (38). In a few cases, neither of these conditions was met, so the codon immediately following an upstream stop codon was used to determine maximal SEP length. Chromosome coordinates are from the University of California Santa Barbara Genome Browser, assembly H19.
Transcript Category Detected Peptide Sf Score Start Codon SEP Length (aa) Chromosome Coordinates
RefSeq AAPGALPEAAVGPR 0.81 ATG 96
chr9:13925635 2-139264369 strand=- RefSeq AGAPAVGLLLANER 0.93 GTG 39 chrX:16859470 -16888534 strand=- RefSeq QLPPAAAVGDAGQLGR, APGGAAAGPGAPGCGG AGGQGPAPGGAAAAAA R 0.91, 0.98 ACG 103 chr10:9909220 1-99094454 strand=- RefSeq ATPGLQQHQQPPGPGR, ATPPGGTGHEGLSGGAA DVASGVGSGR 0.92, 0.95 ATG 83 chr9:13955736 6-139565706 strand=+ RefSeq IVVDELSNLK, QQQNSNIFFLADR, NILDELKK, EYQEIENLDK 0.9, 0.89, 0.74, 0.87 ATG 96 chr2:19052619 5-190535440 strand=+
RefSeq TAPSSTATTASASCAATR 0.96 ATG 62
chr7:15064665 7-150675423 strand=-
RefSeq LQVGPADTQPR 0.93 ATG 88
chr9:12361207 7-123639492 strand=-
RefSeq STAACQTSSIATR 0.87 ATG 97
chr14:1038005 38-103809402 strand=+
RefSeq GSSAAVGPR 0.84 stop 78
chr16:8957482 7-89607413 strand=+
Table 1.1 (Continued) Transcript Category Detected Peptide Sf Score Start Codon SEP Length (aa) Chromosome Coordinates RefSeq TAAAAAAGTITRPR 0.78 GTG 102 chr8:64080459-64125260 strand=+ RefSeq GVGGQAALFAAGR, AGGDLPLQPQPGGAAAR , AAQAFFPAAELAQAGPE R 0.96, 0.93, 0.96 GTG 88 chr8:14489739 9-144897840 strand=-
RefSeq AVAAAAAAAPDPGGR 0.81 acg 91
chr10:9828812 8-98346562 strand=- RefSeq GGLGAASIAADGAPR 0.86 ctg 115 chr4:12273761 6-122745077 strand=-
RefSeq SSTPAPPQGQFLPPSI 0.78 acg 74
chr7:10046477 1-100471014 strand=+
RefSeq VAVEEGLPGDPVAER 0.94 acg 107
chr11:6568675 0-65689023 strand=+
RefSeq EGSVHPQVE 0.76 atg 87
chr10:1019920 55-102005758 strand=- RefSeq GAIGGGGAGVQGQTAG AR 0.91 atg 143 chr5:18065003 9-180662529 strand=+
RefSeq VAAVAVGSQAVLQILSR 0.9 atg 77
chr19:4271328 6-42721897 strand=-
RefSeq WTSSTSSPNTSGAPR 0.94 atg 77
chr19:1294933 1-12969791 strand=+ RefSeq NPPLVQDTVSGK 0.9 atg 111 chr1:15052239 1-150532570 strand=+
RefSeq QTAFGKWYESLLNNR 0.78 stop 63
chr3:19336360 2-193386115 strand=+
Table 1.1 (Continued) Transcript Category Detected Peptide Sf Score Start Codon SEP Length (aa) Chromosome Coordinates RefSeq TAAAAAAGTITRPR 0.78 GTG 102 chr8:64080459-64125260 strand=+ RefSeq GVGGQAALFAAGR, AGGDLPLQPQPGGAAAR, AAQAFFPAAELAQAGPER 0.96, 0.93, 0.96 GTG 88 chr8:14489739 9-144897840 strand=-
RefSeq AVAAAAAAAPDPGGR 0.81 acg 91
chr10:9828812 8-98346562 strand=- RefSeq GGLGAASIAADGAPR 0.86 ctg 115 chr4:12273761 6-122745077 strand=-
RefSeq SSTPAPPQGQFLPPSI 0.78 acg 74
chr7:10046477 1-100471014 strand=+
RefSeq VAVEEGLPGDPVAER 0.94 acg 107
chr11:6568675 0-65689023 strand=+
RefSeq EGSVHPQVE 0.76 atg 87
chr10:1019920 55-102005758 strand=- RefSeq GAIGGGGAGVQGQTAGA R 0.91 atg 143 chr5:18065003 9-180662529 strand=+
RefSeq VAAVAVGSQAVLQILSR 0.9 atg 77
chr19:4271328 6-42721897 strand=-
RefSeq WTSSTSSPNTSGAPR 0.94 atg 77
chr19:1294933 1-12969791 strand=+ RefSeq NPPLVQDTVSGK 0.9 atg 111 chr1:15052239 1-150532570 strand=+
RefSeq QTAFGKWYESLLNNR 0.78 stop 63
chr3:19336360 2-193386115 strand=+
RefSeq TWLPSCEDLTLPGGR 0.92 atg 50
chr7:15879972 4-158814542 strand=+
Table 1.1 (Continued) Transcript Category Detected Peptide Sf Score Start Codon SEP Length (aa) Chromosome Coordinates
RefSeq AVAGAAAGAGGR 0.79 atg 73
chr19:1305950 8-13067950 strand=-
RefSeq AEEQPGLGPGAAGR 0.94 atg 149
chr7:10003296 2-100034242 strand=- RefSeq RAVPAQGLLQSTPTCMP WTP 0.84 atg 54 chr1:16006115 6-160064154 strand=-
RefSeq NTTQESLEKGP 0.78 stop 32
chr22:4174038 3-41756157 strand=+
RefSeq EALNEFLTR 0.87 stop 22
chr4:16990876 2-169911558 strand=-
RefSeq AEPLQTAGQAGR 0.83 atg 59
chr11:1189645 97-118966163 strand=-
RefSeq AGNLILLQ 0.82 stop 23
chr3:12494564 0-125042272 strand=-
RefSeq STTIGGMNQR 0.77 atg 26
chr12:4873223 6-48745011 strand=-
RefSeq ERPANSLIDQCSQR 0.8 atg 54
chr2:13113030 9-131132956 strand=+
RefSeq VFFKNLLAFAR 0.9 stop 22
chr6:80194734-80199064 strand=-
RefSeq AELSFLNR 0.84 atg 70
chr16:8656380 5-86589025 strand=- RefSeq LLPLGASPAGVVGGGLA PPR 0.93 atg 85 chr22:2136807 3-21368526 strand=-
RefSeq SLSSYGACSR 0.89 stop 71
chr17:3544192 8-35444379 strand=+
Table 1.1 (Continued) Transcript Category Detected Peptide Sf Score Start Codon SEP Length (aa) Chromosome Coordinates RefSeq FLPVDLSLLR 0.78 atg 90 chr1:15553279 5-155708399 strand=+
RefSeq GPSGTQEMGPLSR 0.95 atg 102
chr19:3610043-3626771
Figure 1.4 Overview of SEPs. (A) RNA maps illustrating the major categories of sORFs that are translated into SEPs. Categories include sORFs in the 5ʼ untranslated region (5ʼUTR), sORFs in the coding sequence (CDS), sORFs in the 3ʼ untranslated region, sORFs on non-coding RNAs (ncRNAs), and sORFs on transcripts antisense to annotated RefSeq transcripts.The gray arrow represents the RNA, the blue arrow represents annotated protein CDS (if present), and the yellow arrow represents the sORF. The numbers mark the boundaries of each element of the transcript in nucleotide bases from the 5ʼ end of the transcript. (B) Incidence of SEPs by sORF category.
ASNSD1 (5!UTR) DEDD2 (CDS) ZNF641 (3!-UTR) LOC645676 (ncRNA) ACACA (antisense) ! " #$%&'()*+# ,-.* /01)*++ 2-.* 2$%&'()*3 +3.* 45(6!)*, ++. 7489:;4:;)*+ 2.*
polycistronic mRNAs, which is interesting because this phenomenon has historically been thought to be rare in eukaryotes. However, our findings here are consistent with those of ribosome profiling studies (17).
1.6 Discovering SEPs encoded by long intergenic non-coding RNAs (lincRNAs)
One intriguing feature of our analysis of RefSeq RNAs was the discovery of coding regions within transcripts that are annotated as non-coding. Since 2002, when long non-coding RNAs were first established as a transcriptional class through the sequencing of full-length cDNA libraries in mouse (39), interest in the functional properties of these molecules has grown rapidly. Commonly defined as transcripts that may posses mRNA-like properties but which lack ORFs longer than 100 amio acids, several dozen lncRNAs have now been shown to act as
regulators of diverse cellular processes in mammals. For example, XIST
contributes to X chromosome inactivation in by coating the inactivated
chromosome (40); HOTAIR and COLDAIR interact with multiple protein
complexes, including the polycomb-group protein Polycomb Repressive Factor 2
(PRC2), to control skin development (41, 42); and H19 and KCNQ1OT1 interact
with chromatin and a host of protein complexes to effect imprinting (43, 44). However, although RNAs such as these are known to play a direct, mechanistic role in carrying out their functions, there are numerous other putatively functional lncRNAs whose specific role has not been elucidated. In these cases, it is not
clear whether the transcript possesses an intrinsic function or rather performs
through its coding potential1.
The question of whether all transcripts that meet the traditional lincRNA
definition are in fact non-coding has spawned efforts to discern a priori between
novel SEP-encoding transcripts and bona fide non-coding RNAs. Notably, Lin et al have developed a comparative genomics-based gene prediction algorithm called PhyloCSF, which outperforms other available algorithms at identifying small protein-coding regions in genomic sequences (49). However, recognizing that some coding sORFs will be too small for even sensitive algorithms to identify and also that many coding sORFs may be recently evolved, we wondered whether our experimental approach to SEP discovery might make a nice complement to computational approaches.
Recognizing that a majority of putative lincRNAs are not listed in RefSeq, we generated an extensive catalogue of nominally non-coding RNAs from our K562 RNA-seq data according to a previousy published protocol (50) (Figure 1.3). Our lincRNA culling protocol was as follows. First, we removed any transcripts with a non-lincRNA annotation. Second, we scanned each transcript in all three frames to identify regions that could code for one of the protein domains catalogued in the protein family database Pfam (51). Transcripts
1 It is important to note, however, that these possibilities are not exclusive. In E.
Coli, for example, the sugar transport-related sRNA (SgrS) transcript helps cells
recover from glucose-phosphate stress by base-pairing with the mRNA ptsG to
bring about its degradation via RNase E (45, 46) and also by encoding a 43 amino acid functional peptide called SgrT that prevents glucose uptake, probably
containing such regions were removed. We then removed all transcripts containing an ORF that appeared to be conserved at the protein coding level, as indicated by a positive phylogenetic codon substitution frequency score (PhyloCSF) (49). From the remaining pool of transcripts, we selected those that were multiexonic and originated from intergenic regions of the genome; these composed our lincRNA pool. We then generated a theoretical protein database by in silico-translating these transcripts in three frames and used this database to analyze our peptidomics datasets.
Ribosome profiling experiments in mouse cells indicate the presence of translated sORFs on nearly half of the lincRNAs analyzed (17), which is much higher than expected (52-54). By contrast, our peptidomics analysis identified 10 SEP-encoding lincRNAs (Table 1.2), which represents just 0.5% of the1866 lincRNAs detected in our RNA-seq analysis of K562. This disparity may result from a number of factors, including false positive identifications by ribosome profiling techniques of (14). Additionally, ribosome profiling may identify rare translational events that do not generate enough protein to be detected by LC-MS/MS, since mass spectrometry is biased towards the detection of more abundant peptides (55). It is also possible that some of the sORFs identified by ribosome profiling may produce polypeptides that are rapidly degraded and therefore would be undetectable using any analytical approach. Finally, the disparity may be a consequence of the fact that the study in question significantly undersampled lincRNAs: only 30 lincRNAs were examined when mammalian
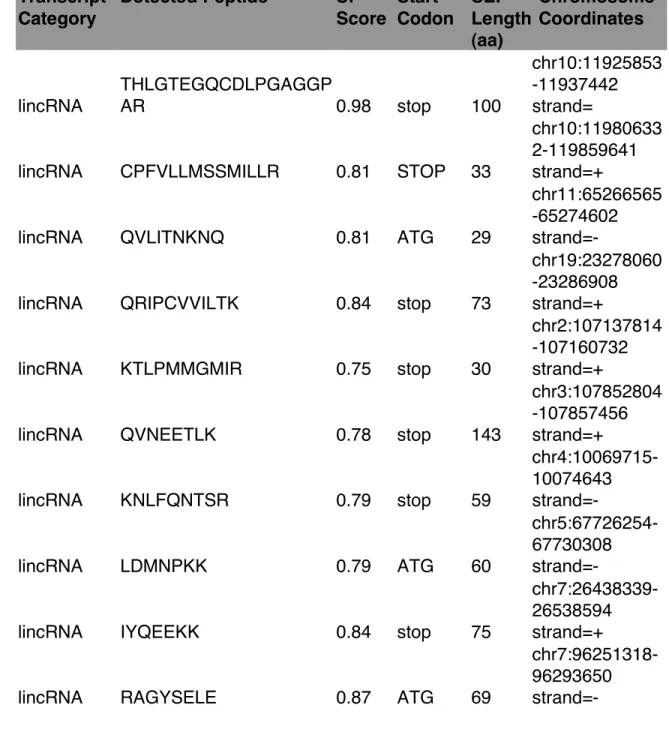
Table 1.2 List of high-confidence SEPs derived from lincRNA transcripts. When present, an upstream in-frame AUG was assumed to be the initiation codon. If no upstream AUG was present, the initiation codon was assigned to an in-frame near-cognate non-AUG codon embedded within a Kozak-consensus sequence (38). In a few cases, neither of these conditions was met, so the codon immediately following an upstream stop codon was used to determine maximal SEP length. Chromosome coordinates are from the University of California Santa Barbara Genome Browser, assembly H19.
Transcript Category Detected Peptide Sf Score Start Codon SEP Length (aa) Chromosome Coordinates lincRNA THLGTEGQCDLPGAGGP AR 0.98 stop 100 chr10:11925853 -11937442 strand=
lincRNA CPFVLLMSSMILLR 0.81 STOP 33
chr10:11980633 2-119859641 strand=+
lincRNA QVLITNKNQ 0.81 ATG 29
chr11:65266565 -65274602 strand=-
lincRNA QRIPCVVILTK 0.84 stop 73
chr19:23278060 -23286908 strand=+
lincRNA KTLPMMGMIR 0.75 stop 30
chr2:107137814 -107160732 strand=+
lincRNA QVNEETLK 0.78 stop 143
chr3:107852804 -107857456 strand=+ lincRNA KNLFQNTSR 0.79 stop 59 chr4:10069715-10074643 strand=- lincRNA LDMNPKK 0.79 ATG 60 chr5:67726254-67730308 strand=-
lincRNA IYQEEKK 0.84 stop 75
chr7:26438339-26538594 strand=+
lincRNA RAGYSELE 0.87 ATG 69
chr7:96251318-96293650 strand=-
cells typically contain thousands of such transcripts. Future work coupling ribosome profiling with mass spectrometry should help resolve these questions and provide a better understanding of the factors governing SEP expression.
1.7 Discovering SEPs encoded by unannotated transcripts
Recognizing that the RefSeq- and lincRNA-derived databases did not contain every SEP that could be encoded by transcripts present in K562, we generated a
theoretical protein database by in silico-translating all of our K562 RNA-seq
transcripts. Searching this database against our data sets and subjecting the resulting PSMs to our evaluation workflow yielded an additional 66 novel, high-confidence SEPs (Table 1.3).
Table 1.3 List of high-confidence SEPs derived from K562 RNA-seq transcripts. When present, an upstream in-frame AUG was assumed to be the initiation codon. If no upstream AUG was present, the initiation codon was assigned to an in-frame near-cognate non-AUG codon embedded within a Kozak-consensus sequence (38). In a few cases, neither of these conditions was met, so the codon immediately following an upstream stop codon was used to determine maximal SEP length. Chromosome coordinates are from the University of California Santa Barbara Genome Browser, assembly H19.
Transcript Category Detected Peptide Sf Score Start Codon SEP Length (aa) Chromosome Coordinates
non-annotated APEPGAVLAPAEVVLR 0.95 agg 119
chr22:47048295 -47073068 strand=+
non-annotated NALQQENHILDGVK 0.96 stop 52
chr15:91565384 -91574477 strand=+
non-annotated LLVSGSPSAETLPLR 0.94 atg 128
chr5:34914296-34925392 strand=+
non-annotated ALAQGSLTPSQIYSA 0.91 aag 52
chr22:17092426 -17095991 strand=+ non-annotated LSAPQPGPDILQAPAR 0.81 GTG 89 chr19:54693858 -54697432 strand=+
non-annotated VYIFQPVFEQYAK 0.92 atg 54
chr15:55609385 -55613829 strand=-
non-annotated NEQTELLYNK 0.9 stop 18
chr12:11864994 4-118650075 strand=+
non-annotated ILEDFLPPSSSRPQS 0.84 stop 42
chr2:85132483-85133801 strand=+
non-annotated DLPGVAPPRPSLSLSGP 0.83 atg 65
chr9:130209955 -130216851 strand=- non-annotated AAASGQPRPEMQCPAE QTEIK 0.81 atg 58 chr5:14664778-14699800 strand=+
Table 1.3 (Continued) Transcript Category Detected Peptide Sf Score Start Codon SEP Length (aa) Chromosome Coordinates non-annotated KINIEIR 0.8 ctg 46 chr5:17966062 5-179718930 strand=-
non-annotated KLEITSI 0.88 stop 25
chr5:10819130 9-108191755 strand=+ non-annotated KLQLQC 0.75 stop 120 chr20:5598194 9-55984389 strand=-
non-annotated KLSLLEL 0.79 stop 47
chr5:33479130-33479598 strand=+
non-annotated KLVSEIK 0.78 stop 17
chr20:5127012 5-51270250 strand=-
non-annotated KNILEPK 0.89 stop 15
chr16:1196199 1-11972092 strand=+
non-annotated KPLEPLL 0.78 agg 26
chr14:5517878 8-55179023 strand=+
non-annotated KQGGFVQVSANAL 0.75 atg 136
chr22:3201463 3-32026837 strand=-
non-annotated KYPPPPP 0.81 stop 20
chr14:7520154 1-75205240 strand=-
non-annotated LNINQSIAVSTATQR 0.96 AGG 55
chr2:20032292 8-200323580 strand=+
non-annotated LPGQATTQQTFDQR 0.88 stop 54
chr19:5616509 1-56185542 strand=+ non-annotated LVSAVLAGKE 0.75 CTG 43 chr1:7863564-7864928 strand=-
non-annotated MNFILK 0.75 atg 49
chr3:44912513-44913077 strand=+
Table 1.3 (Continued) Transcript Category Detected Peptide Sf Score Start Codon SEP Length (aa) Chromosome Coordinates
non-annotated PAVAAATLHLPAAPEGPH 0.78 atg 49
chr7:10016985 2-100183655 strand=-
non-annotated QELIGASLHTAR 0.75 stop 119
chr1:22854474 3-228549628 strand=+
non-annotated RIQVEQTR 0.81 atg 63
chr9:15055076-15056573 strand=+ non-annotated RSVFPLLK 0.8 stop 22 chr10:6968165 7-69833652 strand=- non-annotated TSDAPRPSATPPGADPLN SAGPGAR 0.81 stop 103 chr19:5573796 1-55770381 strand=- non-annotated VTSWDGQNPPR 0.76 ATG 50 chr12:1296629 2-12982891 strand=+ non-annotated AAPGPTAAAAAQASAAAR 0.82 CTG 108 chr2:23157758 3-231685792 strand=+
non-annotated RLLIPPEK 0.82 stop 45
chrX:5214450-5216144 strand=+
non-annotated SPTTDSYGIPQGCK 0.89 stop 40
chr1:17591397 3-176153786 strand=-
non-annotated APLLVKD 0.75 stop 15
chr10:9777257 3-97772956 strand=+
non-annotated PDEIIFK 0.75 stop 50
chr2:17678592 1-176794931 strand=+
non-annotated DYILSLEMFSILLWG 0.77 stop 33
chr3:88101102-88108113 strand=-
Table 1.3 (Continued) Transcript Category Detected Peptide Sf Score Start Codon SEP Length (aa) Chromosome Coordinates non-annotated EDNFILK 0.77 CTG 37 chr7:155093676 -155102099 strand=-
non-annotated LNLYEIK 0.78 stop 52
chr12:10434440 1-104350979 strand=+
non-annotated KIIYDK 0.78 ATG 35
chr3:173924415 -173924516 strand=+ non-annotated FGGFSLK 0.79 stop 63 chr15:48995625 -48997517 strand=+ non-annotated HGHSFPDPGLLLQNQGD 0.79 stop 122 chr7:66386236-66423532 strand=+
non-annotated FEIFGEK 0.8 stop 37
chr4:164444822 -164451827 strand=+
non-annotated HDASSSPLGPPR 0.8 stop 55
chr16:87435666 -87438903 strand=-
non-annotated EEAYFR 0.83 stop 23
chr1:95657105-95663161 strand=- non-annotated CLVYVLDLITDACTIKPLFN K 0.86 stop 43 chr9:130128866 -130129660 strand=+ non-annotated ASPGEAGPAGGAAAGQG APR 0.89 stop 73 chr1:16905808-16970994 strand=- non-annotated GAWGGGQLATAGSGPG QR 0.96 ATG 70 chr17:62205639 -62207524 strand=-
non-annotated DTEVLINTMSK 0.79 ATT 27
chr1:4036227-4073316 strand=+
non-annotated VYKWLLCNVE 0.78 ATG 41
chr1:157243513 -157253900 strand=+
Table 1.3 (Continued) Transcript Category Detected Peptide Sf Score Start Codon SEP Length (aa) Chromosome Coordinates
non-annotated KPVFLLLLSIR 0.85 STOP 32
chr11:3532972-3542051
strand=+
non-annotated FIPTEAWYSAGR 0.79 ATG 86
chr11:8278312 9-82805398 strand=+
non-annotated IKFLLAPEENK 0.86 ATG 43
chr16:3054772-3058645 strand=+ non-annotated FYPDYIK 0.77 TTG 22 chr11:1297053 1-13011090 strand=-
non-annotated QMSSNILK 0.76 stop 50
chr15:3100851 8-31061502 strand=+
non-annotated VAHENYMKFK 0.82 stop 59
chr21:3534540 0-35353552 strand=+ non-annotated GIALGDIPNAR 0.94 GTG 18 chr6:68590370-68642035 strand=+ non-annotated VLLDQHQR 0.8 stop 23 chr6:14116713 1-141219546 strand=-
non-annotated YYELQRGTR 0.84 AAG 43
chr15:5906027 3-59063173 strand=-
non-annotated GEMERGEIK 0.81 ATG 18
chr17:4137343 9-41383338 strand=-
non-annotated CQDILEAGKR 0.85 ATC 70
chr19:2344150 0-23457032 strand=- non-annotated DLGSPMLK 0.76 ATG 52 chr2:23598100-23604170 strand=-
non-annotated TASPYSRPE 0.75 ATG 58
chr2:66653867-66660602 strand=-
Table 1.3 (Continued) Transcript Category Detected Peptide Sf Score Start Codon SEP Length (aa) Chromosome Coordinates
non-annotated LTVAGQGR 0.75 ATG 66
chr20:4173737-4176599 strand=+ non-annotated SPFWAGQGQSR 0.85 GTG 104 chrX:11842549 2-118469573 strand=+
non-annotated NLAGGSGLIP 0.76 stop 41
chrX:1515320-1517852 strand=-
non-annotated AAALQFDLR 0.94 stop 23
chr21- 35303432-35308177 strand=+ non-annotated AQHGVHSNTASPGLPAG APR 0.96 agg 66 chr7:15077818 0-150780257 strand=-
1.8 Identifying post-translationally modified SEPs
Functional proteins are commonly phosphorylated as a means of controlling their activity and many bioactive peptides are amidated at the c-terminus to prevent degradation by exopeptidases. We wondered whether SEPs undergo the same post-translational modifications. To answer this question, we reanalyzed our peptidomics data sets against the custom databases we generated from human RefSeq transcripts and K562 RNA-seq data using the SEQUEST (32) algorithm with specialized parameters designed to enable the identification of phosphorylated or c-terminally amidated peptides. While we did not detect post-translational modification of any of the SEPs we had previously discovered, the analysis yielded five additional novel SEPs that are post-translationally modified (Table 1.4). All of these SEPs were phosphorylated and one was also c-terminally amidated.
Table 1.4 List of high-confidence post-translationally modified SEPs derived from K562 RNA-seq transcripts. When present, an upstream in-frame AUG was assumed to be the initiation codon. If no upstream AUG was present, the initiation codon was assigned to an in-frame near-cognate non-AUG codon embedded within a Kozak-consensus sequence (38). In a few cases, neither of these conditions was met, so the codon immediately following an upstream stop codon was used to determine maximal SEP length. “@” indicates that the preceding residue is phosphorylated and “[“ indicates that the terminus is amidated. Chromosome coordinates are from the University of California Santa Barbara Genome Browser, assembly H19.
Transcript Category Detected Peptide Sf Score Start Codon SEP Length (aa) Chromosome Coordinates
non-annotated VTLNLFLTS@IK 0.85 stop 49
chr21:38122898 -38126719 strand=+ non-annotated SLGGILFTIIS@K 0.93 CTG 30 chr16:89735690 -89738512 strand=- non-annotated IFLITIQDFIIAVIIVHS@T@ DSLQRLV 0.79 CTG 147 chr15:77471130 -77474523 strand=+
non-annotated MLNFILIS@ILERA 0.75 ATG 14
chr9:139557366 -139565706 strand=+ non-annotated PGIGAGTPVGPKVVGS@ L[ 0.80 stop 35 chr12:3949920-3950581 strand=-
1.9 Exploring the global properties of SEPs
In total, we discovered 118 unannotated SEPs, three of which were previously reported and thus served as positive controls (16), and 115 of which are novel. This is the largest number of SEPs ever reported in a single study by approximately a factor of 30, which demonstrates the superior coverage afforded by our approach.
Wishing to explore the global properties of SEPs, we examined the size distribution and start codon usage of the molecules we had discovered. Because we perform our peptidomics analysis on trypsin-digested samples, we do not obtain full protein-level SEP sequence coverage and in particular do not directly observe the N terminus. We therefore used the following convention when assigning start sites to SEP-encoding sORFs. When present, the upstream-most in-frame AUG was assumed to be the initiation codon. If no upstream AUG was present, the initiation codon was assigned to an in-frame near-cognate non-AUG codon embedded within a Kozak-consensus sequence (38). In a few cases, neither of these conditions was met, so the codon immediately following an upstream stop codon was used to determine maximum SEP length.
Using this approach, we estimated the SEPs to range in length between 14-149 amino acids, with the majority (>70%) being <75 amino acids (Figure 1.5A). If we take a more conservative approach by using an AUG-to-stop or upstream-stop-to-stop, we obtain a similar SEP length distribution and retain our smallest SEPs, including the 14-mer (Figure 1.5B). As the shortest human SEP
A
B
Figure 1.5 Length distribution of high-confidence SEPs. (A) SEP length distribution estimated by defining sORFs as follows: when present, an upstream in-frame AUG was assumed to be the initiation codon. If no upstream AUG was present, the initiation codon was assigned to an in-frame near-cognate non-AUG codon embedded within a Kozak-consensus sequence (38). In a few cases, neither of these conditions was met, so the codon immediately following an upstream stop codon was used to determine maximal SEP length. (B) Length distribution determined by defining sORF initiation sites as the codon immediately 3ʼ of the stop codon upstream of the detected peptide unless an AUG was present, in which case the upstream-most AUG was defined as the start.
17 33 34 17 11 6 0 5 10 15 20 25 30 35 40 0-25 26-50 51-75 76-100 100-125 126-150 Incidence
Length (amino acids)
15 31 32 18 14 8 0 5 10 15 20 25 30 35 0-25 26-50 51-75 76-100 100-125 126-150 Incidence
previously identified by mass spectrometry was 88 amino acids long (16), it is clear that our approach provides superior coverage of small SEPs. This is significant because many previously characterized, functional SEPs are under 50 amino acids (4, 10-12).
Another interesting feature of our results is the preponderance of non-canonical translation start sites: 62% of the detected SEPs do not initiate at AUG codons (Figure 1.6). This finding is consistent with the results of ribosome profiling experiments in mouse, which indicate that, globally, most ORFs contain non-AUG start sites (17). In addition, the human SEP start codon usage distribution we propose is similar to that observed by ribosome profiling in mouse (e.g. CUG is the second most common used codon in both data sets) (17).
Figure 1.6 Probable start codon-usage distribution of SEP-encoding sORFs. Codon usage was estimated using the following sORF-defining convention: When present, an upstream in-frame AUG was assumed to be the initiation codon. If no upstream AUG was present, the initiation codon was assigned to an in-frame near-cognate non-AUG codon embedded within a Kozak-consensus sequence (30).
1.10 Testing SEP expression from RefSeq transcripts
Though in vitro experiments have shown that the eukaryotic translation machinery is capable of initiating translation at non-AUG codons and ribosome profiling experiments have indicated that non-AUG initiation is common in mouse, the preponderance of non-canonical translation start sites among the discovered SEPs is striking (Figure 1.6). We therefore wished to verify that our SEPs could be translated from non-AUG start sites. Moreover, because a majority of the discovered SEPs appear to arise from polycistronic transcripts, which is a phenomenon thought to be rare in eukaryotes, we sought to verify that the implicated full-length annotated transcripts of SEPs with AUG starts were competent to produce SEPs.
Constructs were designed to produce full-length mRNAs, including 5ʼ and 3ʼ UTRs, that matched those in the RefSeq database (56). We selected sORFs in the 5ʼ-UTR, the 3ʼ-UTR, or frameshifted within the CDS, and encoded a FLAG epitope tag at the 3ʼ-end of each sORF (so that initiation is unperturbed). The
uORFs ASNSD1-SEP, PHF19-SEP, FRAT2-SEP, YTHDF3-SEP and EIF5-SEP
all produced cytoplasmically localized polypeptides, as detected by anti-FLAG immunofluorescence in transfected HEK293T cells (Figure 1.7A). (We refer to SEPs by appending “-SEP” to the name of the annotated CDS nearest the sORF; the sORF is given the same name but italicized.) Importantly, the fact that
Figure 1.7 Expression of SEPs. (A) Transient transfection of HEK293T cells with constructs containing a cDNA sequence corresponding to the full-length RefSeq mRNA (i.e., including the 5ʼ- and 3ʼ-UTRs). We appended a C-terminal FLAG-tag on the SEP coding sequence that could be detected by immunofluorescence. In these images the nuclei are stained with DAPI (blue) and the SEPs are detected with anti-FLAG antibody (green). ASNSD1-SEP, PHF19-SEP, and EIF5-SEP are all derived from sORFs in the 5ʼ-UTR (uORFs); cells expressing EIF5 are indicated with a white arrow. Two additional 5ʼ-UTR sORFs, FRAT2-SEP and YTHD3-SEP, produce SEPs initiating with a non-AUG codons. Finally, DEDD2-SEP (CDS) and H2AFx-DEDD2-SEP (3ʼ-UTR) were not translated from the RefSeq RNAs, which is consistent with a scanning model of eukaryotic translation. (B) Diagrams of the SEP-encoding RNAs used to produce the results depicted in A (the diagrams for ASNSD1 and DEDD2 are shown in Figure 1.3A). The gray arrow represents the RNA transcript, the blue arrow represents annotated protein CDS and the yellow arrow represents the sORF. The numbers mark the boundaries of each element of the transcript in nucleotide bases from the 5ʼ end of the transcript.
A
B
produced SEPs verifies that sORFs with non-AUG start codons are translated (Figure 1.7A).
By contrast, the DEDD2-SEP sORF was not translated from the full-length
RefSeq construct (Figure 1.7A). DEDD2-SEP is frameshifted deep within the
main CDS of the DEDD2 transcript, so according to the scanning model of translation (57) it is not expected that this downstream sORF would be translated (Figure 1.7B). Similarly, the 3ʼ-UTR-embedded H2AFx-SEP was similarly not translated from the full-length mRNA construct (Figure 1.7A). One possible explanation for these observations is that the DEDD2-SEP and the H2AFx-SEP are translated from splice variants of their respective annotated transcripts that are present in K562 cells but are not in the RefSeq database. In any case, it would seem that not all SEPs that derive from a segment of an annotated transcript are translated from a bicistronic mRNA.
1.11 Alternative splicing of annotated protein coding genes generates SEP-producing transcripts
We identified a truncated DEDD2 mRNA in the RNA-seq data wherein the first
start codon is that of the DEDD2-SEP sORF, making the transcript ideal for
translation of DEDD2-SEP by the traditional ribosome scanning mechanism (Figure 1.8). This supports the hypothesis that alternative splicing of annotated protein coding genes is one mechanism by which SEP-producing transcripts are produced. However, we were not able to clearly identify a truncated version of the
Figure 1.8 Alternative splicing of SEP-encoding transcripts. The expression of the DEDD2-SEP in K562 cells may be explained by the existence of an alternative splice form of the DEDD2 RNA (DEDD2_RNA2), the first start codon
of which initiates DEDD2-SEP. In this figure, the gray arrow represents the RNA,
the blue arrow represents annotated protein CDS (if present), and the yellow arrow represents the sORF.
H2AFx transcript in the K562 RNA-seq data. It is possible that a truncated H2AFx mRNA variant is present in K562 cells but did not give rise to the sequencing reads necessary to resolve it from the full-length H2AFx transcript.
1.12 Confirming a non-AUG start site and investigating the mechanism of bicistronic expression
Since such a large proportion of SEPs putatively initiate at non-AUG sites, we wanted to rigorously identify the alternate start codon of one these sORFs. C-terminally FLAG-tagged FRAT2-SEP was expressed from the full-length mRNA construct in HEK293T cells and immunoprecipitated; mass spectrometry of the purified protein (Figure 1.9) was consistent with initiation at an ACG triplet embedded within a Kozak consensus sequence (38) (Figure 1.10A). Mutating the ACG to an ATG resulted in increased FRAT2-SEP translation while deletion of this ACG abolished FRAT2-SEP production, as assessed by Western blotting, thus confirming our assignment (Figure 1.10B). In addition, mutation of the Kozak consensus sequence to less favorable residues led to markedly lower FRAT2-SEP expression, which demonstrates the importance of the Kozak sequence at non-AUG initiation sites.
The scanning model of translation provided an explanation as to why the DEDD2 mRNA is not bicistronic; we hypothesized that upstream alternate start codons could provide a mechanism to promote polycistronic gene expression via leaky scanning. To test whether FRAT2 mRNA is bi-cistronic, we prepared a
FRAT2 construct where the SEP and the downstream CDS were tagged with different epitopes (Figure 1.10C), permitting their simultaneous detection by immunoblotting with two antibodies. We found that the FRAT2 RNA is bi-cistronic, as FRAT2 and FRAT2-SEP are both expressed (Figure 1.10C).
Figure 1.9 Identifying the start site of FRAT2-SEP. MALDI-MS of immunoprecipitated FRAT2-SEP-FLAG provides a polypeptide with a molecular weight of 9905, which corresponds to an ACG initiation codon with methionine as the first amino acid.
Figure 1.10 Characterization of the non-AUG initiation codon of the FRAT2-SEP
sORF. (A) An ACG triplet embedded in a Kozak consensus sequence was
identified as the FRAT2-SEP initiation codon (red) by determining the molecular
weight of immunoprecipitated FRAT2-SEP-FLAG using MALDI-MS. (B) This ACG
was confirmed as the FRAT2-SEP initiation codon by site-directed mutagenesis
followed by western blots of FRAT2-SEP-FLAG using an anti-FLAG antibody. Conversion of the ACG to an ATG resulted in higher expression (lane 2), while ablation of this codon removed all expression (lane 3). In addition, perturbation of the Kozak sequence (lanes 4-7) revealed the importance of context when using non-AUG codons, as substitution of less favorable residues (38) at the most important positions in the Kozak sequence resulted in lower FRAT2-SEP-FLAG expression. (C) Epitope tagging of the sORF and CDS of the FRAT2 mRNA demonstrates that the FRAT2 mRNA is bi-cistronic. Specifically, the FRAT2 CDS
was c-myc tagged and the FRAT2-SEP was FLAG tagged. Conversion of the
FRAT2-SEP initiation codon from ACG to ATG ablates the expression of the downstream FRAT2-CDS, indicating the importance of alternate start codons for polycistronic expression.
Remarkably, mutation of the ACG start codon of the FRAT2-SEP to an ATG increases FRAT2-SEP expression, but also completely eliminates the expression of FRAT2 protein, revealing that the translation of the downstream cistron absolutely requires leaky upstream initiation. Therefore, this experiment indicated that an upstream non-AUG initiation codon is necessary for efficient polycistronic gene expression.
1.13 Measuring the cellular concentrations of SEPs
As a first step towards exploring the functional potential of the discovered SEPs we wished to determine whether they persist in the cell as concentrations that are comparable to that of known functional peptides and proteins. We therefore measured the cellular concentrations (K562 cells) of three randomly selected SEPs (ASNSD1-SEP, PHF19-SEP and H2AFx-SEP) using isotope dilution mass spectrometry (58) (Figure 1.11). In these experiments, isotopically heavy-labeled peptides corresponding to the detected peptides that were used to identify these three SEPs were synthesized and added to the cells during extraction. The sample was then processed as described above (Figure 1.1) except that the ERLIC fractionation step was omitted. Removal of the ERLIC speeds up the sample preparation but also results in less sensitivity during the LC-MS analysis. Therefore, we compensated for the loss of ERLIC by using selected ion monitoring (SIM) during the LC-MS, which is more sensitive. Analysis of the lysate by LC-MS is able to distinguish the light (endogenous) and heavy
Figure 1.11 SEP quantification. (A) SEPs were quantified by isotope dilution-mass spectrometry (IDMS). We synthesized a deuterated (heavy-labeled) variant of the diagnostic SEP peptide we detected. Upon isolation of K562 cells this peptide was added and the entire mixture was separated using our standard approach to isolate SEPs. SEPs are then quantified by LC-MS since the deuterated SEP and endogenous SEP can be distinguished by differences in their masses. (B) Overlap between the endogenous SEP and the deuterated SEP along with (C) matching MS/MS spectra (note: 10 Da shift for heavy peptide for some fragments), indicate that these are the same peptides. (D) Quantification of several SEPs using this approach.