JAR:Load Quick Start Guide
Please note: this Quick Start Guide is for informational purposes only.
Application and Web Load Testing
PERSONAL TECHNICAL
Performance testing for the Web is crucial for ensuring commercial success.
JAR:Load is a Web Load Testing Solution delivered from the Cloud for organisations
across the globe. This revolutionary, ultra fast, highly scalable solution is accessible
anywhere, anytime, and from any device, allowing tests to be created and implemented
in minutes with no download required.
JAR:Load allows you to build, execute and analyze performance tests on its powerful,
intuitive platform. Use the Cloud functionality to scale your tests to any load testing
requirement across any geographical location.
PROCESS DRIVEN TESTING
QUICK START GUIDE
JAR:Load’s process driven user interface offers users a step-by-step guide on how to plan, create
and execute load tests instantly. Suitable for both novice and experienced performance engineers,
users can create simple tests without code, or use intuitive LUA scripting to build highly
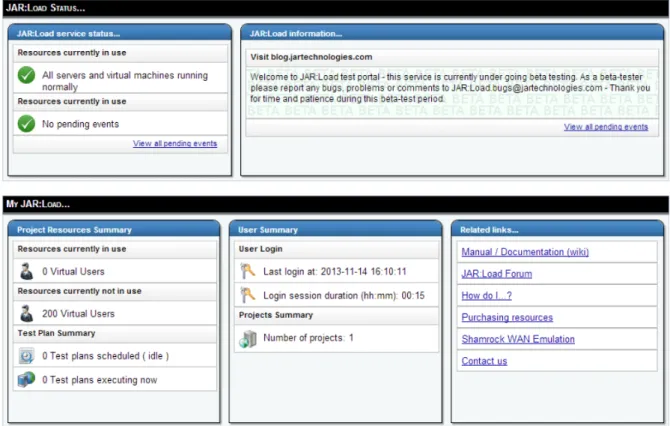
Figure 1: VU Dashboards Page
The Dashboard area is the starting point for load generation. It provides an overview of
JAR:Load and is divided into 2 main categories:
2. My JAR:Load
Resources SummaryThis area displays the current resources in use, if there are any test plans running, the
resources that are currently not in use, if there are any scheduled test plans or if any currently executing.
User Summary
This area displays the last time a user logged in, the duration of the session before it will
time-out and ask the user to log in to continue and the number of projects a user is linked to.
Related Links
Access to links to different areas of help.
1. JAR:Load Status
JAR:Load Service StatusThis displays the current status of the servers and virtual machines within JAR:Load. It will also display the latest information, for example if there is any planned downtime or network outages.
JAR:Load Information
This area displays the latest blog entries from blog.jartechnologies.com
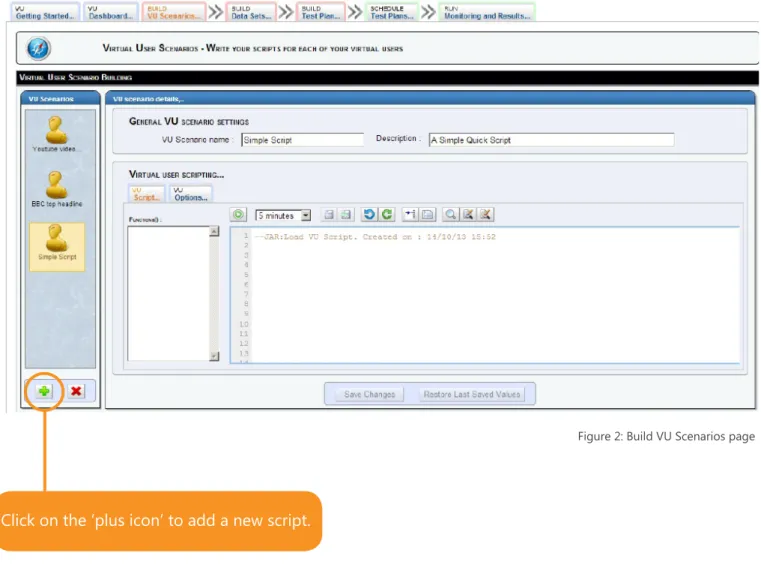
To start you will build a “Virtual User Scenario”
A Virtual User (VU) Scenario is where you can create highly customisable scenarios to test
how your target system will function under different stress conditions. To do this please go
to the “Build VU Scenarios” tab and you will be presented with the page below (Figure 2).
Figure 2: Build VU Scenarios page
The “Add VU Scenario” (Figure 3) appears allowing you to customise your VU Scenario.
First give the VU Scenario; • A scenario name • A description
• Click ‘Add VU Scenario’ to proceed. Figure 3: Add New VU Scenario
BUILD VU SCENARIOS
Click on the ‘plus icon’ to add a new script.
Add Virtual User Scenario
1
Introduction to Scripting
The scripting language used in JAR:Load is LUA. It is a lightweight scripting language
useful for providing users with an easy way to program the behaviour of virtual users.
The advantages to using this type of scripting are:
• Easy to use
• Flexible
• Comprehensive
Casestudy - Scenario
(Correct as of July 2014)
This script goes to YouTube, searches for a video and displays the description of the
video to the logs. Below shows the breakdown of the code for the YouTube script.
1. First as the script uses datasets, we must check to make sure the dataset has the values you need in it. The code below first searches the dataset for its length and returns the value to DataSetLength, it then checks to see if it is equal to zero. If it is equal to zero it will give an error message and end the script.
-- Get data set size.
DataSetLength = Dataset:Get_length(“YouTubeSearch”); -- Check to see if there is any values
if DataSetLength == 0 then
--Found no values so print error message and stop the script. Log:Error( “Dataset is empty” );
end
2. After the script has made sure there are values in the dataset we must select a row.
The row is then saved into the variable DataRow where it will be checked to see if there are any values. If there are no values then the script will give an error message and stop.
-- Get a data row from the dataset.
DataRow, DataRowErrorCode, DataRowErrorMsg = Dataset:Get (“YouTubeSearch”);
-- Check that we got a datarow if DataRowErrorCode ~= 0 then -- Datarow get failed.
-- Print error message and stop the script. Log:Error( DataRowErrorMsg );
end-3. Next we must get a search term from the dataset. The search term is the first column in the dataset and we save this to a variable labelled SearchTerm. We must check to see if the script was able to get the SearchTerm if not the script will display an error message and stop.
-- Get a search term.
SearchTerm, SearchTermErrorCode, SearchTermErrorMsg = DataRow:Get_col(0); -- Check that we got a search term.
if SearchTermErrorCode ~= 0 then -- Search term get failed.
-- Print error message and stop the script. Log:Error( SearchTermErrorMsg );
end
4. Once the script has a search term from the dataset it will create a NewWebPage() and load it with the YouTube website.
Page = HTTP:NewWebPage();
Page:LoadWebPage( “http://www.youtube.com” ); Page:WaitForPageLoad();
5. When the page has loaded, the script will now find the search box and insert thesearch term into the search box:
1. Find the search box by searching for its css element #masthead-search-term and save it as a variable called Searchbox.
-- Find the search box
Searchbox = Page:FindFirstElement( “#masthead-search-term” ); 2. Insert the obtained value into Searchbox
-- Insert search terms into the search box. Key:TypeInto(Searchbox, SearchTerm);
6. Once the script has inserted the value, it will find the search button, click search and wait until the page has loaded:
1. Find the search button by searching for its css element#search-btn. -- Find searchform.
Searchform = Page:FindFirstElement( “#search-btn” ); 2. Clicking on search
-- Submit searchvalue.
Mouse:LeftClick(Searchform); 3. Waiting for page to load
-- Wait for page to load Page:WaitForPageLoad();
7. Once the page has fully loaded the script will look at the results of the search and pick out the first video. The script will then click on the first video in the results list and wait for the page to load:
1. The script will first find the #search-results and save it to a variable called SearchResult. SearchResult = Page:FindFirstElement( “.item-section” );
2. Looking at the variable SearchResults the script will find the list of results ( “li” ) and save it as ResultList.
ResultList = SearchResult:FindFirstElement( “li” );
3. From the ResultList it will next look for the first video ( “.yt-lockup-content” ) and save it as a variable called FindFirstVideo.
4. Once the script has found the first video it will look for the heading of the video
(“h3” ) and save it as a variable called VideoHeading.
VideoHeading = FindFirstVideo:FindFirstElement( “h3” ); 5. Now the script has found the VideoHeading it will look for the hyperlink ( “a” )
within the VideoHeading and save it to a variable called LinkToVideo. LinkToVideo = VideoHeading:FindFirstElement( “a” ); 6. Click on the hyperlink contained within the LinkToVideo.
-- Click the first result.
Mouse:LeftClick(LinkToVideo); 7. Wait for the page to load.
-- Wait for page to load. Page:WaitForPageLoad();
8. Once the video has loaded the script will find the description, save it to an XML string and then print the string out to the logs found on the “Run Monitoring and Results” page:
1. Find the description of the video using it’s css element ( “#eow-description” ); and save it as a variable called Information.
-- Find information element.
Information = Page:FindFirstElement( “#eow-description” ); 2. Save the description to a XML string called VideoDescription.
-- Get the information content.
VideoDescription = Information:ToInnerXml(); 3. Print out the XML String called VideoDescription.
-- Print it.
Figure 5: Script Toolbar
The Script Toolbar allows you to:
1. Play and test the script.
2. Create settings to test the script once through (Single shot) or for a time between 5 minutes and 4 hours.
3. Save the script.
4. Revert any changes since the last save. 5. Undo the previous action.
6. Redo the previous action. 7. Go to a specific line. 8. Reindent the script.
9. Search the script for a specific string.
10. Search and replace one instance of a specific string. 11. Search and replace all instances of a string.
Script Tool bar Feature
1 2 3 4 5 6 7 8 9 10 11
Figure 4 below shows what you should have typed into the script area.
Figure 4: Example of written script
Once you have done this click on the “Save Changes” button to save the script. Alternatively if
you have made changes or errors to the script you can use the “Restore Last Saved Values” to
revert to the last saved point. Before you move away from the Build VU scenarios page you may
want to test your script to make sure there are no errors. You can do this by using the toolbar
shown in Figure 5.
You are able to create Data Sets in JAR:Load through which your virtual users are able to access.
For example you may require a Virtual User to have a username and password to access a
website or you may require them to perform an individual search.
Each dataset is created in a CSV file and then uploaded to JAR:Load. You can set a default access
on each data set.
There are 3 different modes, these are:
• Linear – This access method means the virtual user will go through the dataset row by row. • Unique – This access method means each virtual user will be allocated a unique row. • Random – This access method means the virtual user will randomly pick a row.
If you go to the “Build Data Sets” table you will see a default CSV already uploaded to JAR:Load.
Figure 6 above shows the default values you will use for the YouTube script.
Figure 6: Example of a Data Set Values
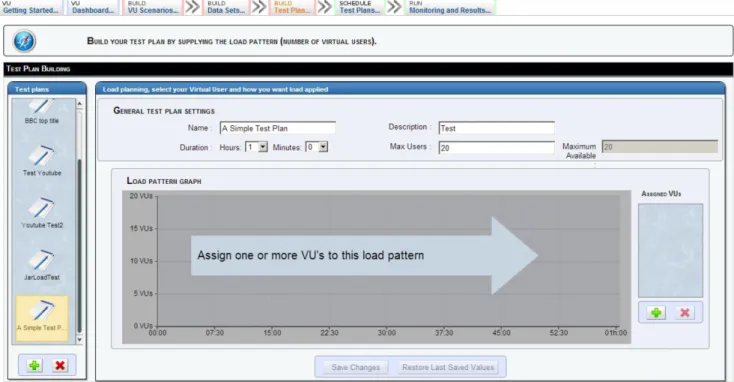
Figure 7: Build Test Plan page
BUILD TEST PLANS
After creating a VU Scenario you can now build up your load plan by specifying the amount
of users you want and how you want the load applied by using the time line facility.
To start building your Test plan:
• First click on the “Build Test Plan” tab at the top of the page.
• Once loaded go to the left side of the page to the ‘Test Plans’ panel.
This will create a test plan for you to customise:
-Enter in the name of the plan
-Give it a description and click “Add Test Plan”.
Figure 9: Example of a Load Pattern Graph Figure 8: Add VU Scenario to a test plan.
Assigning Virtual Users
You will see a blank graph, this is where we will supply the load pattern by adding in the amount of virtual users we are going to use. If you move your mouse over the graph you will see that it shows you the time and the number of VU’s at that point. Set up your graph by doing the following:
1. Set the duration to 0 hours 10 minutes. 2. Set the Max Users to 5.
3. Set your graph up as displayed below (Figure 9). 4. Save your changes.
The next step is to assign the Virtual User
Script that you generated on the “Build VU
Scenario” page to this test plan. To do this,
click the button on the right side of the page,
under the heading “Assigned VU’s.” Select the
script that you have created and click
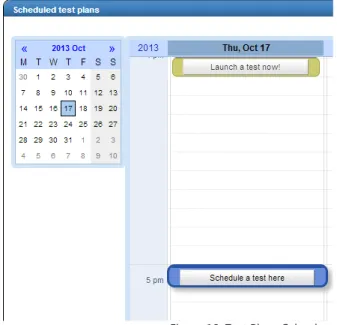
SCHEDULE TEST PLANS
Figure 10: Test Plans Calender
Figure 11: Schedule a test plan
Now that you have your Test Plan created you are able to run the load
generation immediately or schedule it for a future time and date. To start scheduling a test, click on the “Schedule Test Plan” tab at the top of the page. You will be presented with a calender, from this you will be able to see if there are any scheduled or
executing tests within the project (Figure 10).
You are able to ‘Launch a test now’ or Schedule on for a later date and time. Each new row in the calender represents 5 minutes, therefore select the time you would like to schedule a test by clicking that position on the calender.
As you can see the information is taken
from what you created in your Test Plan. If you want the test to run for longer than 10
minutes, you can change the duration.
However for now leave it at 10 minutes and click Add Schedule.
Alternatively you are able to select “Launch Now” which will present you with the dialogue box as shown in Figure 12. The “Schedule a test plan” and “Launch a test plan” boxes appear similar. However when you select the time you would like the test to run and click “Launch test now,” the test will be launched and you will immediately be moved to the “Run Monitoring and Results” 1
2
Figure 13: Test Plan Monitoring
Figure 14: Total Metrics
This area allows you to analyse, compare and evaluate the results of the load test.
This includes viewing graphs and reports to exporting data for your own use. To
view your current or previous results from your test plans, click the
“Run Monitoring and Results” tab.
Regardless of whether a test has been completed or is still running, you are able to view the results on the graphs as shown in Figure 15.
We have three metrics displayed on the graph. 1. Active Virtual Users
2. Average response Time (ms) 3. Script lines executed
You can have up to a maximum of 5 metrics on one graph. The metrics that are available are shown on the table in Figure 16.
Figure 15: Results Graph
RUN MONITORING AND RESULTS
Here you can view metrics based on virtual users and their requests. Virtual user metrics include the amount that are currently running and the throughput they are generating. The requests metrics include the total requests, the amount the system is handling per second, the average response time and if there are any failed requests.
Figure 13 shows the Monitoring area. Here you are able to view the current test plan. You will be able to see when it started, how long it has ran for, the percentage of the test that is completed and if you want, you can abort the test. As well as this you are able to select the drop down box and choose from the previous tests that have been executed.
Results and Comparison graph
Total Metrics
Figure 16: Metrics Available
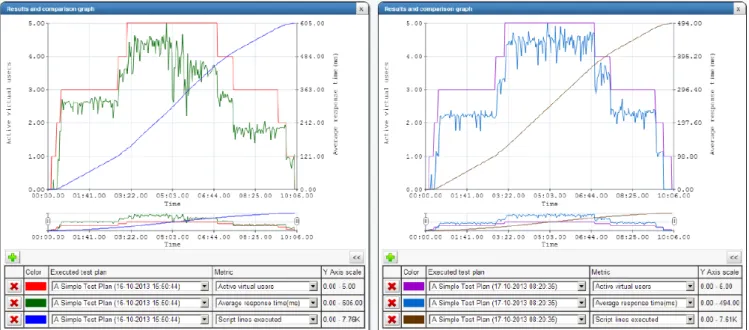
JAR:Load stores the results for all tests executed so you are able to compare results on one or more graphs.
Figure 17 shows the script that was created above ran 2 separate times, one in the afternoon and the other test in the morning. As well as comparing tests on separate graphs, you are able to compare them on a single graph by clicking on the Executed Test Plan drop down box.
Figure 17: Comparing 2 test plans
Metric
Explanation
Received bytes per second Shows the amount of bytes that have been received per second Transmitted bytes per second Shows the amount of bytes that have been transmitted per second Requests per second Shows the amount of requests made per second
Average response time (ms) Shows the average reponse time from the website Active virtual users Shows the amount of virtual users that are active
Total requests Shows the total requests
Total bytes received Shows the total amount of bytes received Total bytes transmitted Shows the total amount of bytes transmitted
Transmitted transactions Shows the amount of transactions transmitted. A transaction is a function where you would group a piece of code in Figure 4. An example would be grouping the login code together. Received transactions Shows the amount of transactions received
Successful transactions Shows the amount of the requests that were successful Failed requests Shows the amount of the requests that failed
Script lines executed Shows the amount of lines of script that were executed
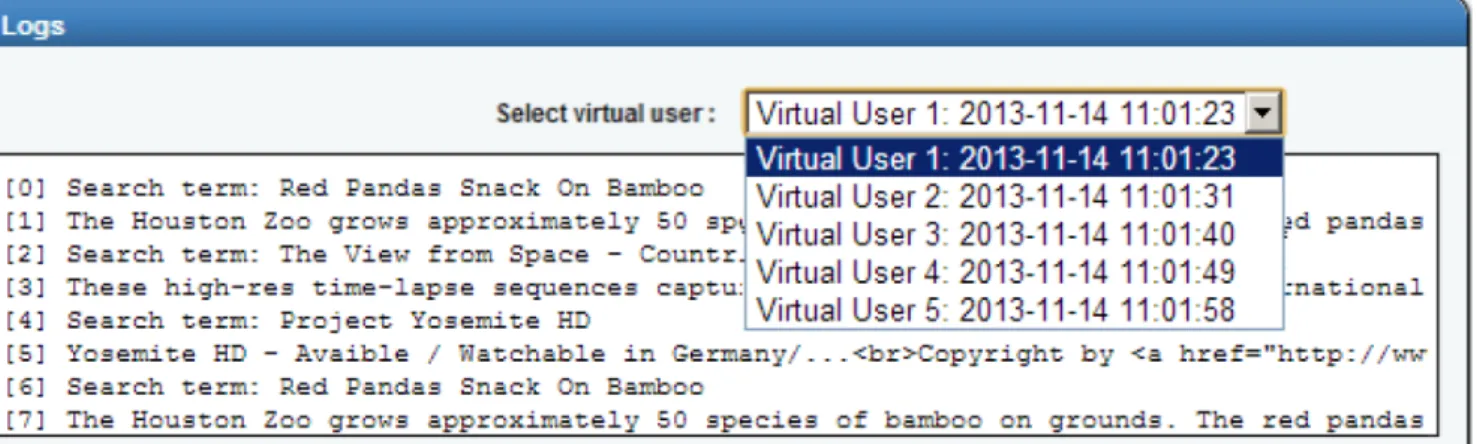
Figure 18 shows the Log Messages output. Here you are able to view all log messages from all
log functions Log:Print();. You are able to view logs per virtual user by selecting the
virtual user from the drop down box, as shown in Figure 18:
Figure 18: Example of Log output
Logs messages
JAR is a leading provider of Web and Application Testing Tools for the Application Performance and Quality Assurance market.
With a wide spectrum of experience and expertise from developing the
‘World’s first hybrid WAN Emulator’ to offering cloud based web load testing tools, JAR are committed to providing revolutionary and flexible bespoke solutions for our partners and their customers.
ABOUT JAR
JAR Technologies,BT3 Business Centre, 10 Dargan Cresent, Duncrue Road, Belfast, Co Antrim, BT3 9JP