Dis cus si on Paper No. 09-089
Open Source, ICT Infrastructure
and Firm Performance
Dis cus si on Paper No. 09-089
Open Source, ICT Infrastructure
and Firm Performance
Daniel Cerquera and Bettina Müller
Die Dis cus si on Pape rs die nen einer mög lichst schnel len Ver brei tung von neue ren For schungs arbei ten des ZEW. Die Bei trä ge lie gen in allei ni ger Ver ant wor tung
der Auto ren und stel len nicht not wen di ger wei se die Mei nung des ZEW dar.
Dis cus si on Papers are inten ded to make results of ZEW research prompt ly avai la ble to other Download this ZEW Discussion Paper from our ftp server:
Non-technical summary
The rapid diffusion of open source software (OSS), the significant investments observed in OSS projects, and the new inter-firm collaborative possibilities enabled by such OSS projects have generated a substantial literature on the economics of OSS development. However, this literature mainly focusses on the puzzling motivation for individual programmers and companies to produce OSS without systematically analyzing the economic impact of OSS on
the economic performance ofadopting firms. The question analyzed in this paper is whether
the considerable costs incurred in the adoption and incorporation of OSS by the firms using OSS in their daily operations pay off.
In particular, this paper analyzes the impact of the adoption of three types of OSS (servers operating systems, PC operating systems and general software applications) on firms’ labor productivity (sales per employee) and innovative behavior (R&D intensities and value of introduced product and process innovations). In order to perform this analysis the paper exploits a unique representative sample of the German manufacturing and service sectors (ZEW ICT survey).
The results show that the adoption of open source operating systems for servers and general open source software applications has no impact on firm level labor productivity, while the
adoption of open source operating systems for PCs impacts labor productivity negatively.
This result suggests that the adoption of this type of OSS represents learning costs that affect the output per employee negatively, at least in the short run. Moreover, the results also show that the adoption of open source operating systems for PCs affects the value of process innovations (i.e. the percentage of cost reductions due to the introduction of previous process innovations)positively. This result suggests that the adoption of OSS helps firms to optimize their computationally intensive internal processes. This interpretation is supported by the observed positive correlation between open source operating systems for servers and PCs, and firms’ R&D intensities.
Das Wichtigste in K¨
urze
Die rasche Verbreitung von Open Source Software (OSS), die umfangreichen Investitionen in Projekte und die M¨oglichkeiten zur Zusammenarbeit zwischen Firmen, die durch OSS-Projekte er¨offnet werden, haben in j¨ungster Zeit eine umfangreiche Literatur zur ¨Okonomie der Entwicklung von OSS hervorgebracht. Diese Literatur konzentriert sich haupts¨achlich auf die Motivation von Individuen und Unternehmen, OSS bereit zu stellen. Der Einfluss von
OSS auf die Performance von anwendenden Unternehmen wird dagegen nicht systematisch
analysiert. In diesem Papier wird die Frage untersucht, ob sich die Kosten, die mit der
Einf¨uhrung und Verwendung von OSS verbunden sind, auszahlen.
Unter Verwednung eines repr¨asentativen Datensatzes f¨ur das verarbeitende Gewerbe und die Dienstleistungssektoren in Deutschland (ZEW IKT-Umfrage) wird in diesem Papier der Ein-fluss des Einsatzes von OSS auf die Unternehmensperformance empirisch untersucht. Es wird der Einfluss von drei Arten von OSS (Betriebssysteme f¨ur Server, Betriebssysteme f¨ur PCs und allgemeine OSS-Anwendungen) auf die Arbeitsproduktivit¨at (Umsatz pro Besch¨aftigtem) und das Innovationsverhalten (F&E-Intensit¨aten und Wert der eingef¨uhrten Produkt- und Prozessinnovationen) analysiert.
Die Ergebnisse zeigen, dass der Einsatz von OSS f¨ur Serverbetriebssysteme und allgemeine
OSS-Anwendungen keinen Einfluss auf die Arbeitsproduktivit¨at der Unternehmen hat. Der
Einsatz von OSS f¨ur PC-Betriebssysteme hat dagegen einen negativen Einfluss auf die
Ar-beitsproduktivit¨at. Dieses Ergebnis deutet darauf hin, dass der Einsatz von dieser Art von OSS mit Lernkosten verbunden sind, die den Output pro Besch¨aftigtem zumindest kurzfristig negativ beeinflussen. Die Ergebnisse zeigen weiterhin, dass der Einsatz von OSS f¨ur PCs den
Wert von Prozessinnovationen (den Anteil von Kostenreduktionen aufgrund der Einf¨uhrung
von bereits eingef¨uhrten Prozessinnovationen)positiv beeinflusst. Dieses Ergebnis legt nahe,
dass die Einf¨uhrung von OSS den Unternehmen hilft, ihre rechenintensiven Prozesse zu
op-timieren. Diese Interpretation wird durch die positive Korrelation zwischen OSS f¨ur Server-betriebssysteme und PCs und den F&E-Intensit¨aten der Unternehmen unterst¨utzt.
Open Source, ICT Infrastructure and Firm Performance
∗ Daniel CERQUERA† Bettina M ¨ULLER‡ ZEW Mannheim Germany December 27, 2009 AbstractThis paper empirically studies the impact of the adoption of open source software (OSS) on firms’ labor productivity and innovative behavior. Using a representative sample of German firms, the results show that the adoption of OSS operating systems for servers and general OSS applications has no impact on firm level labor productivity, while the
adoption of OSS operating systems for PCs impacts labor productivitynegatively. This
result points to the costs associated with the implementation of open source software. Moreover, the analysis shows that the adoption of OSS operating systems for PCs has a positive effect on the value of introduced process innovations, suggesting efficiency gains by adopting a tailored ICT infrastructure. These benefits might explain the positive correlation observed between OSS operating systems for servers and PCs, and firms’ R&D intensities.
Keywords: Open Source, Information and Communication Technologies, R&D Incentives, Innovation, Firm Level Data.
JEL Classification: D21, L25, O32.
∗We would like to thank Irene Bertschek for helpful comments and suggestions. All errors are ours. †[email protected]. Centre for European Economic Research (ZEW), Mannheim, Germany. Research
Group Information and Communication Technologies. Corresponding author.
‡[email protected]. Centre for European Economic Research (ZEW), Mannheim, Germany. Research
1
Introduction
The rapid diffusion of open source software (OSS), the significant investments observed in OSS projects, and the new inter-firm collaborative possibilities enabled by such OSS projects have generated a substantial literature on the economics of OSS development.1 At the core of this literature is the attempt to explain the puzzling motivation for individual programmers to make their products publicly available for others for free. With this research objective in mind, the existing literature focusses on the organization of OSS development, competi-tion between OSS and proprietary software, innovacompeti-tion and knowledge diffusion within OSS projects, among others.2
However, existing analyses have not considered systematically the economic impact of OSS
on the economic performance of adopting firms. The question is: Do the considerable costs
incurred in the adoption and incorporation of OSS by the firms using OSS in their daily operations pay off? Can the answer to this question explain why after a rapid process of diffusion, the market share of OSS solutions is still very low in comparison with proprietary or commercial software? Regarding computationally intensive processes at the firm level, is it reasonable to expect a wide adoption of OSS-based cloud computing in the future? This paper attempts to shed some light on these questions.
More specifically, this paper empirically analyzes the impact of the adoption of different types of open source software at the firm level on several measures of firm performance. The analysis is carried out for a representative sample of German manufacturing and service sectors. In particular, the analysis considers the impact of the adoption of three types of OSS (servers’ operating systems, PCs’ operating systems and general software applications) on firms’ labor productivity (i.e. sales per employee) and innovative behavior (i.e. R&D intensities and value of introduced product and process innovations).
There are three main reasons that highlight the relevance of the present analysis. First, although it is well known that the quality embedded in OSS solutions is higher than in their commercial counterparts, the implementation of OSS requires advanced programming knowledge and potentially high learning costs. Moreover, given the important variability
1See for example Lerner and Tirole (2002), Johnson (2002), Myatt and Wallace (2002), Bitzer and Schr¨oder (2005), Bessen (2006), and Bitzer, Schrettl, and Schr¨oder (2007).
2See for example Kogut and Metiu (2001), Franke and Shah (2003), Franke and Hippel (2003), von Krogh, Spaeth, and Lakhani (2003), Lerner, Phatak, and Tirole (2006), Xu, Christley, and Madey (2006), Dahlander and Magnusson (2005, 2006), Rossi and Bonaccorsi (2006), Bitzer (2004), Casadesus-Masanell and Ghemawat (2006), Bonaccorsi, Giannangeli, and Rossi (2006), and Economides and Katsamakas (2006a,b).
observed in the profits of ICT intensive firms, it is reasonable to expect that for some firms, the adoption of OSS solutions represents a too costly alternative. However, whether the considerable costs incurred in the adoption and incorporation of OSS pay off in terms of economic performance remains an empirical question.
Second, OSS has been praised as a solution to overcome the market power of a few number of software producers (i.e. Microsoft). Indeed, given the 90% worldwide market share of Windows as an operating system for PCs, consumers might benefit from high-quality alter-natives that provide additional competition in the market and more variety to final users. Accordingly, several economic policies are particularly oriented at encouraging the produc-tion, adoption and implementation of OSS solutions (e.g. European open source observatory). However, to the best of our knowledge, there is no systematic analysis using representative data sets in order to guide economic policy in this area.
Third, there is currently an extensive debate about the future of internet and cloud comput-ing. In particular, the recently launched Google Chrome OS, an operating system based on an OSS architecture, attempts to play a leading role in the future. Google’s idea is to pro-vide a simple-to-use open source operating system, combining Linux with Chrome, Google’s browser, in order to develop web-based applications only. This paper argues that one way to evaluate whether it is reasonable to expect that firms can benefit from OSS-based cloud computing or not, is to analyze how firms that have already adopted OSS have benefited in terms of their economic performance.
Some of the arguments presented in this paper have been highlighted in the theoretical literature. For example, Kuan (2001) argues that the quality of OSS will in general be higher. The reason is that a provider of closed software does not know the needs of the consumers. If he cannot divide the market by a separating contract (i.e. offering a high quality software with a high price and a low quality software with a low price) he is forced to offer a software of middle quality with a middle price to serve both individuals with a low and a high willingness to pay. In contrast, open source software can be enhanced by the effort of the users, who know their needs. In an open source context the first-best quality can be achieved, whereas closed software leads only to a second-best solution due to asymmetric information.
Johnson (2006) shows that the quality of closed source software is likely to be lower because the development of closed software in profit-oriented firms provides the programmers with an incentive not to search for bugs in the codes of their peers. The reason is that the number
of bugs found in the code can be used as a signal for the ability of the programmer. If programmers are paid according to their ability they may collude not to check each others code in order to avoid adverse effects on their wages.
Further, Bessen (2006) states that OSS is a complement to closed source software. OSS will be used by firms who have complex and specialized needs that cannot be met by the standard software of closed software providers. In general, self-programming yields the first-best effort level for the development of software. Contracting over software programming is socially inefficient as each party gets only a fraction of the total surplus. This reduces the incentive to exert effort in order to improve the software. But self-programming requires that the end-user has the capabilities to programm software.
This paper estimates a production function and an innovation equation in order to study the impact of the adoption of different types of open source software on firm performance. The results show that the adoption of OSS operating systems for servers and general OSS applications has no impact on firm level labor productivity, while the adoption of OSS op-erating systems for PCs impacts labor productivitynegatively. This result suggests that the adoption of this type of OSS represents learning costs that affect the output per employee negatively, at least in the short run. Moreover, the results also show that the adoption of open source operating systems for PCs affect the value of process innovations (i.e. the percentage of cost reductions due to the introduction of previous process innovations) positively. This result suggests that the adoption of OSS helps firms to optimize their computationally inten-sive internal processes. This interpretation is supported by the observed positive correlation between open source operating systems for servers and PCs, and firms’ R&D intensities.
The paper is organized as follows. In section 2 the data used are summarized and the empirical strategy is presented. In section 3 the results of the analysis are shown. Section 4 concludes.
2
Empirical Analysis
2.1 Data
The analysis is based on two waves of a business survey carried out by the Centre for European Economic Research (ZEW) corresponding to the years 2003 and 2006 (ZEW ICT Survey). The data set is a representative sample of the German manufacturing and service sectors,
and contains detailed information on the economic characteristics, performance and ICT use for 4,400 firms in each wave. Table 1 provides some descriptive statistics about the firms’ general performance, innovative behavior, as well as the observed ICT infrastructure. The information on firms’ performance and innovative behavior corresponds to the year 2006, while the information regarding the observed ICT infrastructure corresponds to the year 2003 for the firms active in 2006.
In general, the surveyed firms exhibit a great variability with respect to sales (in millions euros), number of employees, gross investments and labor productivity (i.e. ratio between sales and number of employees). In addition, the empirical distributions of these variables appear to be left skewed. In particular, the median level of sales of the surveyed firm cor-responds to 5 million euros in 2006, whereas the average is 137.5 millions. This indicates the presence of few very large companies in the data. Analogously, the median size of the surveyed firms in terms of number of employees is 40 with an average of 295 for the same year. Gross investments show a similar pattern. In 2006, the median and average level of gross investments is 0.2 and 27.2 millions euros, respectively. The same also holds for the distribution of labor productivity where the median and the mean are 0.12 and 0.24 million euros per employee, respectively. The variability and the skewness of the distributions is in line with similar data sets on the firm level.
Table 1 also includes information on the innovative behavior of the surveyed firms. In partic-ular, the average level of R&D intensity defined as R&D expenditures as a proportion of the reported sales in 2006 is 8.8. As expected, the empirical distribution of the R&D incentives is also left skewed where only the highest quartile evidenced a R&D intensity higher than 10.0. In terms of the size of the R&D department defined as the proportion of employees that work in R&D, the behavior is similar. The average R&D department employed 11.8 percent of the total firms’ employees.
In addition, information on innovation outputs is also available. This includes dummy vari-ables indicating whether the firm introduced product or process innovations during the pe-riods 2001-2003 and 2004-2006, the percentage of sales reported in 2006 that are derived from the product innovations introduced during the period 2004-2006 (mean: 14.0, median: 1.0) and the percentage of cost reductions achieved in 2006 from the introduction of process innovations during the period 2004-2006 (mean: 5.9, median: 0.0).
Furthermore, Table 1 presents information regarding the use and intensity of ICT within firms for the year 2003. The intensity in the use of ICT is measured by the percentage
of employees working mainly with a PC (PCW) and is nearly equally distributed around the different percentiles with an average of 47.5 percent. Moreover, the data also provide information about different ICT software applications, namely enterprise resource planning (ERP), supply chain management (SCM) and customer relationship management (CRM). The proportion of firms that adopted these applications in 2003 were 60.3, 39.6 and 50.4, respectively. Finally, 33.6 percent apply OSS in any form.
Table 2 shows how the use of OSS are related to different firm characteristics. Firms using open source software have a higher fraction of employees working with PCs, a higher R&D in-tensity and a higher fraction of R&D employees regardless of which type of OSS is considered. Additionally, firms using OSS appear to benefit more from innovations. In comparison with firms that do not use open source software they can generate roughly a 5 percentage points higher fraction of their sales with new products and roughly a 2 percentage points higher cost reduction in their total costs. With respect to labor productivity, firms using open source software for their server operating systems have higher, but firms using open source software for PC operating systems and software applications have lower labor productivity.
2.2 Empirical Modeling
As shown in Tables 1 and 2, the available data suggest that the adoption of OSS might affect firm performance in terms of productivity and innovative behavior. However, descriptive statistic do not provide enough evidence that supports the causality and/or robustness of such relationship. In order to find out how persistent the descriptive correlations are and to what extent they can be interpreted as causal effects, multivariate analyses are conducted in the following. The basic empirical relationship considered in the econometric analysis takes the following form:
Yi,t =f(OSi,t−1, ICTi,t−1, Xi,t−1), (1)
where Y is a measure of firm performance, OS corresponds to the adoption of open source, ICT accounts for the ICT infrastructure within the firm, and X is a vector of relevant covariates. The time indicest andt−1 refer to 2006 and 2003, respectively. In analyzing the empirical relation presented in equation (1), the paper explicitly considers the following issues. First, given the expected benefits in firm performance attached to the adoption of OSS (and that
motivates its introduction in the first place), it is reasonable to expect the analysis to be subject to endogeneity problems. In the next subsection the paper discusses the extent of these problems and the identification strategy.
Second, the available data allow the analysis to account for several types of OSS that were observed to be adopted by the sample firms. In particular, the econometric analysis considers three types of OSS: i) OSS operating system for servers; ii) OSS operating system for PCs; and iii) OSS applications. Each type has its own objective within the firm and this aspect is considered in the results obtained in the analysis. Third, the analysis benefits from a rich set of covariates available from the ICT survey. In particular, the econometric specifications control for the extent of the ICT infrastructure within the firm, as well as firm specific, sectoral and location variables. The importance of these covariates will become apparent when our identification strategy is made explicit.
Fourth, in order to measure performance, the analysis uses two main variables, labor produc-tivity and innovative acproduc-tivity. Labor producproduc-tivity is specified as follows:
yi,t =A+αli,t+βki,t+γOSi,t−1+δICTi,t−1+ρXi,t−1+ui,t, (2)
whereyi,t is labor productivity for firmiat timetmeasured as sales per employee in natural logarithm,Acorresponds to the firm level productivity not accounted for by the use of inputs, li,t is the firm’s number of employees (in logs.), ki,t is the firm’s capital stock proxied using the firm’s gross investments (in logs), OSi,t−1 is the type of open source adopted by firm
i, and ICTi,t−1 corresponds to the firm’s ICT infrastructure. In particular, ICTi,t−1 can
be vector-valued considering a wide set of ICT variables, and Xi,t are relevant covariates
available in the data set. The objective of the analysis is to estimate the parameterγ.
As an alternative measure of firm performance, the analysis also considers the innovative activity at the firm level. The analysis of the impact of open source adoption of firms’ innovative behavior is not only interesting in itself, but permits to see more directly whether the impact of the adoption of open source on the firms’ labor productivity is driven by its effect on innovative activities.
In order to study the impact of open source on innovation, the econometric analysis estimates the following relationship:
Ii,t =β0+γOSi,t−1+δICTi,t−1+ρXi,t−1+ui,t, (3)
where Ii,t corresponds to a measure of innovative activity and the remaining variables are
similar to the specification presented in equation (2), although the set of covariates might change in order to account for a better fit of the innovation equation. In particular, the vari-ables forIi,t are the inputs, as well as the outputs of the firms’ innovative activity presented
in Table 1 and 2. As before,γ is the parameter of interest.
2.3 Identification Strategy
The objective of the paper is to consistently estimate the parameterγ. In particular, the main identification strategy with respect to the impact of the adoption of open source software on firms’ performance is based on three main considerations. First, the analysis corresponds to
a cross sectional analysis with t = 2006 and t−1 = 2003 where, in consequence, the OSS
variables exhibit a three year lag with respect to the performance variables considered. Thus, it is assumed that the impact of the adoption of OSS in 2003 is independent of unobserved factors of the firms’ performance observed in 2006. Second, the introduction of detailed information of the ICT infrastructure of the firms in 2003, captured by the set of variables in ICTi,t−1, isolates the remaining impact of the adoption of OSS on the relationship between
the firms’ ICT strategy and their performance. That is, given the rapid depreciation of ICT capital, the ICT infrastructure of the firms in 2003 is assumed to be orthogonal to the labor productivity and/or innovation activity observed in 2006. Third, an instrumental variable approach is performed for cases where the exogeneity of firms’ inputs and/or additional covariates cannot be assumed.
In particular, to account for the potential endogeneity problem in the estimation of production functions due to the simultaneity between inputs and outputs, the analysis instruments the main inputs (i.e. labor and investments in 2006) using their lagged values observed for the year 2003. With respect to the innovation equation, the analysis includes in the vector of covariatesXt−1 information regarding previous innovative activities (i.e. introduction of
product and process innovations during the period 2001-2003) in order to account for firm specific innovative capabilities that might be contemporaneous to the performance measures observed in 2006.
3
Results
3.1 Open Source and Productivity
As explained above, the analysis estimates the production function presented in equation (2). In all the specifications industry, export activity and location dummies where included and exhibited the expected signs. Exporting firms are on average more productive than non-exporting firms and firms located in east Germany tend to be less productive than their western counterparts. Regarding OSS, the adoption of OSS operating systems for servers (OSSRV) and general OSS applications (OSAPP) in 2003 did not evidence any impact on the firms’ labor productivity in 2006. This result was obtained for a wide set of alternative specifications.
In particular, columns 1-3 in Table 3 show some estimates of the impact of the adoption of OSSRV on labor productivity. Column 1 presents the estimates of a benchmark OLS regres-sion where the coefficient on the main inputs, labor and investments, exhibit the expected sign and magnitude. However, the coefficient forOSSRV is insignificant (coeff: -0.0196, std. error: 0.0535). In this specification, the analysis controls for several variables that account for the ICT infrastructure of the firms in 2003. In order to control for the potential endogeneity of the main inputs of production, columns 2-3 follow an instrumental variables approach, where labor and investments are instrumented using 3-year lagged variables. The estimates of the main inputs are clearly improved but the coefficient onOSSRV (on both specifications) remains statistically insignificant. Columns 4-6 provides a similar summary of the analysis of the effect ofOSAPP on labor productivity with identical results.
This initial result is not surprising. Consider the case of OSSRV. It can be argued that the general management and maintenance of the server infrastructure inside a firm corresponds to ICT specialists. These specialists could either be part of the firm (i.e. ICT department) or not (i.e. ICT outsourcing) and do not tend to be directly related with the main operation of the firm. Their role is to guarantee the well functioning of the ICT infrastructure within the firm and does not affect the output per employee. In consequence, although the adoption of OSSRV might or might not reduce operating costs, the results suggest that it does not seem to be related with the core competencies of the firms. With this interpretation, there is no
reason to expect a direct impact ofOSSRV on the firms’ labor productivity.
include any possible OSS application (e.g. Mozilla Firefox) that complements the software used by a firm’s employees. If these applications only represent an extra (possibly minor) tool, then it can be expected that they play no specific role in the main activities of the firm.
Moreover, the fact that OSAPP does not affect labor productivity can also be explained
if most of the surveyed firms adopted some form ofOSAPP, making no difference between
adopters and non-adopters. However, even though the data are not specific about the extent
of the adoption ofOSAPP, the available information reveals that suchOSAPP were not a
common tool in 2003. That is, only 19.8% of the surveyed firms reported the adoption of OSAPP. Therefore, the absence of an impact ofOSAPP on labor productivity suggests that they played a minor role in the main activities of the firm.
Interestingly, the adoption of open source operating systems for PCs (OSPC) does impact
labor productivity negatively. Table 4 shows the results of this analysis. As a benchmark, column 1 presents the estimates from an OLS regression. The coefficients on the main inputs, labor and investments, exhibit the expected sign and magnitude, and the adoption ofOSPC is negatively related to labor productivity. Thus, the negative relationship already found in the descriptive statistics (Table 2) persists after controlling for additional factors. In particular, this result still holds after controlling for the firms’ ICT infrastructure (i.e. ICT intensity
and use of ICT applications). This finding suggests that the adoption ofOSPC corresponds
to a major part of the ICT infrastructure of the firm. If it were just a minor fraction, the coefficient ofOSPC should become insignificant after the ICT infrastructure is controlled for.
Columns 2-6 follow an instrumental variables approach, similar to the one presented in Table 3. Column 2 presents a basic specification using the main inputs of production and a set of general control variables. As can be observed, OSPC exhibits no statistically significant impact on labor productivity. Note, however, that the model estimated in column 2 does not control for firms’ ICT infrastructure. Column 3 considers the role of the intensity of ICT use. Under this specification,OSPC exerts a negative impact on labor productivity, as suggested by the OLS analysis presented in column 1 and the descriptive statistics. The coefficient of OSPC is -0.1121 with a standard error of 0.0637. Although this coefficient is only significant at the 10%-level, it is robust to different specifications. In particular, the negative impact of OSPC on labor productivity still holds when ICT applications are considered in the analysis, as is the case in column 4 where the coefficient ofOSPC is -0.1212 (std. error: 0.0628).
In terms of the magnitude of the coefficients, these results suggest that the marginal impact of the adoption of OSS in the form of PC operating system reduces labor productivity by
12.1%. We consider this magnitude to be a considerable amount. That is, and calculating the marginal effect of a log-linear model, the introduction of this form of OSS represents a reduction in sales per employee of approximately 15, 25 and 48 thousand euros for firms at the 50th, 75th and 90th percentile of the labor productivity empirical distribution, respectively.
The results from columns 1-4 in Table 4 imply that the costs of successfully adapting OSS operating systems in the PCs within the firm significantly affect the output per employee. This is consistent with anecdotal evidence suggesting that for average employees (i.e. not ICT
specialists) the implementation and use of OSPC can be costly, as time has to be invested
in learning to cope and take full advantage of the adoption ofOSPC. In addition, note that
the results might be underestimating the real impact ofOSPC because the firm’s employees
might require time in order to exploit the merits of the open source strategy.
In particular, given the costs associated with the implementation ofOSPC, it is reasonable to expect that firms adoptingOSPC provide extra ICT-related qualification to their employees. The available data also permits to test the validity of this assumption. The corresponding results are presented in column 5. More specifically, the model estimated in column 5 includes a dummy variable that takes the value of 1 if the firms provided additional ICT qualification
to its employees (ICTQ) in 2003. The coefficient of OSPC remains significant and close
to the value reported in the previous specification, while the coefficient of the ICT extra qualification variable is insignificant.
This result supports the interpretation that the adoption ofOSPC requires time to provide
productivity benefits to the firm. That is, if providing ICT extra qualification is enough to allow the firm’s employees to reap the benefits of the adoption ofOSS, then the coefficient on
ICTQ should be positive and the coefficient ofOSPC should become smaller or statistically
equal to zero. However, this is not the case and the results are robust to different specifi-cations. Note that the fact that the coefficient of ICTQ is insignificant does not mean that such qualification is unproductive. It suggests that its benefits might be enjoyed in the future and the cross sectional approach presented in Table 4 is not able to capture its impact.
As an additional test, column 6 analyzes whether contracting external ICT specialists might
reduce the magnitude of the negative impact of OSPC on productivity. In particular, the
econometric model considers the preferred specification of column 4 and includes information on whether the firm contracted external ICT consultants in 2003 and/or outsourced its ICT schooling in the same year. As in the case of column 5, the coefficients of the variables on contracting external ICT specialists is insignificant and the coefficient of OSPC maintains
its magnitude and statistical significance.
The results presented in column 6 should be interpreted with caution. The reason is that, given the benefits of ICT consulting are reaped in the future, this variable can be subject to
endogeneity problems. However, the fact that the impact ofOSPC on productivity remains
robust to alternative specifications, provides some confidence in the results reported.
3.2 Open Source and Innovation
In this subsection, the analysis estimates the model presented in equation (3). Similar to the results obtained for the analysis of OSS and labor productivity, the only type of OSS that exhibited a significant impact on the firms’ innovative activity was OSPC. In consequence, the analysis is focused on this type of OSS but the general results are available upon request.
Building on the results concerning the firms’ labor productivity, if the objective ofOSPC is to reduce operating costs, then it can be expected thatOSPC affect the value of the process innovations introduced in the firm. That is, ifOSPC is used by a firms’ employees, and those
employees identify and develop new process innovations, then the adoption of OSPC could
be related with the value of such innovations. This relationship could be either positive if
OSPC contributes to the optimization of the firms’ internal processes, or negative if such
adoption is too costly (as suggested by the results on labor productivity).
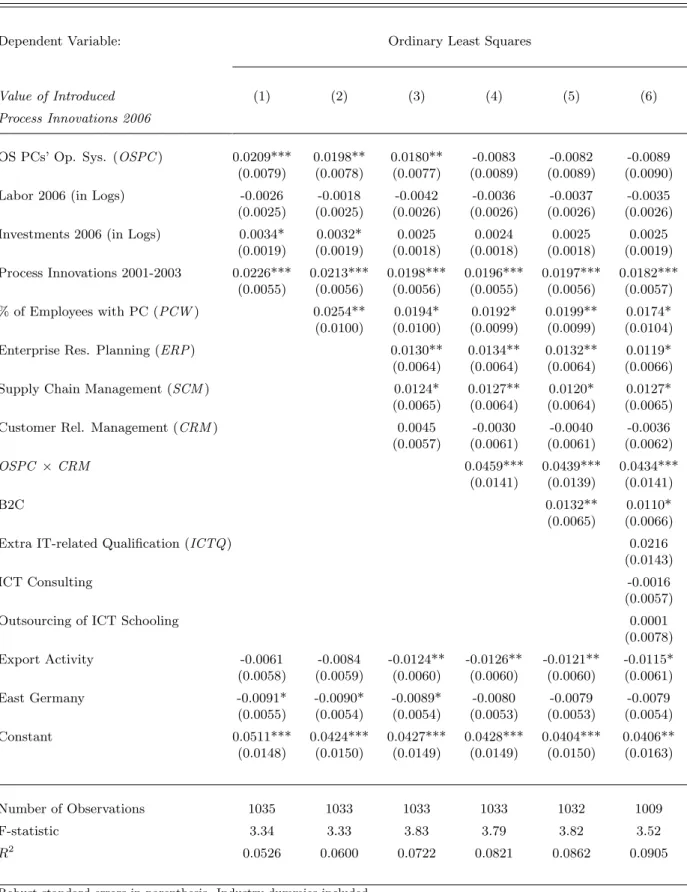
In order to explore this relationship, Table 5 presents the results of the analysis of the impact
of OSPC on the value of introduced process innovations, defined as the percentage of cost
reductions achieved in 2006 from the introduction of process innovations during the period 2004-2006. Given our identification strategy, the analysis follows an OLS approach.3
Column 1 presents the basic specification without considering the ICT infrastructure of the surveyed firms. In addition, in order to control for innovative experience, the analysis in-cludes a dummy variable that takes the value of 1 if the firm introduced process innovations during the period 2001-2003. As expected, innovative experience is valuable to the innovative activities of the surveyed firms. Moreover, the coefficient of OSPC is 0.0209 and significant at the 1%-level. This result suggests that, on average, the percentage of cost reductions achieved in 2006 from the introduction of process innovations during the period 2004-2006
3A similar analysis was performed considering the impact of OSPC on the probability of introducing product innovation and on the value of such innovations, but the impact was never significant. These results are available upon request.
was 2.1 percentage points higher for firms that adoptedOSPC in 2003. This is a considerable impact given the mean of the empirical distribution of the value of such innovations (5.9%).
Columns 2-3 introduce the role of the firm’s ICT infrastructure, showing a similar magnitude for the coefficients forOSPC, although their significance was reduced to 5%. These results
suggest that even though the implementation ofOSPC might reduce sales in the short run
(as shown by the results on labor productivity), it has an independent positive impact on the efficiency of the introduced process innovations. These results are consistent with the
interpretation that firms use OSPC to optimize their internal processes. Moreover, this
positive impact of OSPC on innovative output highlights the benefits of a tailored ICT
infrastructure. As a result, and to exploit those benefits, it is reasonable to expect that the
introduction of OSPC might be related with the incentives to perform R&D. In order to
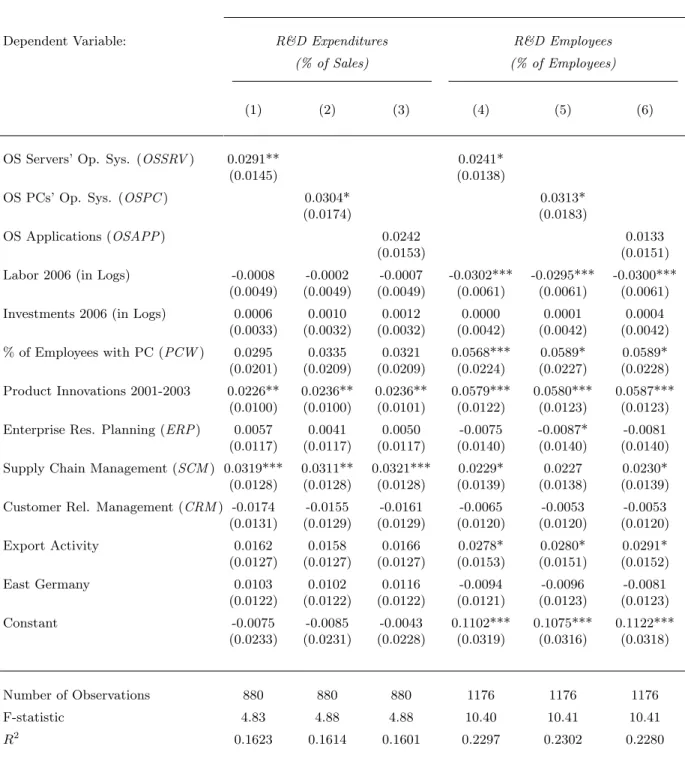
consider such implication, the conditional correlation betweenOSPC and R&D incentives is presented in Table 6.
The first three columns presented in Table 6 correspond to the analysis of the impact of OSS on the firms’ R&D intensities, defined as total expenditures as a percentage of sales. In particular, the results show that the adoption of OSS operating systems for servers and PCs (OSSRV and OSPC) is positively correlated with the firms’ R&D incentives (Coeff: 0.091, std. error: 0.0145). This result also holds when the dependent variable considered is the size of the R&D department, defined as the total number of R&D employees as a proportion of total employees and presented in columns 4-6. In addition, perhaps not surprisingly, the
introduction of general OS applications (OSAPP) does not seem to influence the extent of
R&D within firms. The magnitude and significance of the coefficients reported for the three types of OSS in Table 6 are robust to alternative specifications.
These results suggest that given the benefits associated with the adoption of OSS with respect to the efficiency of the introduced process innovations, the firms might evidence an extra incentive to invest in R&D. It is important to note that the results presented in Table 6 only corresponds to conditional correlations and cannot be interpreted as a causal relationship.
4
Conclusions
This paper empirically studies the impact of the adoption of OSS on firm performance. The results show that the adoption of OSS operating systems for servers and general OSS
appli-cations has no impact on firm level labor productivity, while the adoption of OSS operating systems for PCs impacts labor productivitynegatively. This result implies that, indeed, the adoption of this type of OSS might represent learning costs that affect negatively the output per employee, at least in the short run. Moreover, the results also show that the adoption of OSS operating systems for PCs affects the value of process innovations (i.e. the percentage of cost reductions due to the introduction of previous process innovations) positively. This result suggests that the adoption of OSS might help firms to optimize their computation-ally intensive internal processes. This interpretation seems to be supported by the positive correlation observed between OSS operating systems for servers and PCs, and firms’ R&D intensities.
References
Bessen, J. (2006). Open Source Software: Free Provision of Complex Public Goods. In
J. Bitzer and P. Schr¨oder (Eds.),The Economics of Open Source Software Development
(pp. 57–82). Amsterdam: Elsevier.
Bitzer, J. (2004). Commercial Versus Open Source Software: The Role of Product Hetero-geneity in Competition. Economic Systems,28, 369–381.
Bitzer, J., Schrettl, W., and Schr¨oder, P. (2007). Intrinsic Motivation in Open Source
Software Development. Journal of Comparative Economics,35, 160–169.
Bitzer, J., and Schr¨oder, P. (2005). Bug-Fixing and Code-Writing: The Private Provision of
Open Source Software. Information Economics and Policy,17, 389–406.
Bonaccorsi, A., Giannangeli, S., and Rossi, C. (2006). Entry Strategies Under Competing
Standards: Hybrid Business Models in the Open Source Software Industry.
Manage-ment Science,52(7), 1085–1089.
Casadesus-Masanell, R., and Ghemawat, P. (2006). Dynamic Mixed Duopoly: A Model
Motivated by Linux vs. Windows. Management Science,52(7), 1072–1084.
Dahlander, L., and Magnusson, M. (2005). Relationships between open source software companies and communities: Observations from nordic firms. Research Policy,34, 481 – 493.
Dahlander, L., and Magnusson, M. (2006). Business Models and Community Relationships
of Open Source Software Firms. In J. Bitzer and P. Schr¨oder (Eds.), The Economics
of Open Source Software Development (pp. 111 – 130). Amsterdam: Elsevier.
Economides, N., and Katsamakas, E. (2006a). Linux vs. Windows: A Comparison of Appli-cation and Platform Innovation Incentives for Open Source and Proprietary Software Platforms. In J. Bitzer and P. Schr¨oder (Eds.),The Economics of Open Source Software Development (pp. 207 – 218). Amsterdam: Elsevier.
Economides, N., and Katsamakas, E. (2006b). Two-Sided Competition of Proprietary vs. Open Source Technology Platforms and the Implications for the Software Industry. Management Science,52(7), 1057–1071.
Franke, N., and Hippel, E. von. (2003). Satisfying Heterogeneous User Needs via Innovation Toolkits: The Case of Apache Security Software. Research Policy,32, 1199–1215. Franke, N., and Shah, S. (2003). How Communities Support Innovative Activities: An
Exploration of Assistance and Sharing Among End-Users. Research Policy, 32, 157–
178.
Economics and Management Strategy,11(4), 637–662.
Johnson, J. (2006). Collaboration, Peer Review and Open Source Software. Information
Economcis and Policy, 477–497.
Kogut, B., and Metiu, A. (2001). Open-Source Software Development and Distributed
Innovation. Oxford Review of Economic Policy,17(2), 248–264.
Kuan, J. (2001).Open Source Software as Consumer Integration into Production (Discussion
Paper). Haas School of Business, University of California, Berkeley.
Lerner, J., Phatak, P., and Tirole, J. (2006). The Dynamics of Open-Source Contributors. American Economic Review,96(2), 114–118.
Lerner, J., and Tirole, J. (2002). Some Simple Economics of Open Source. The Journal of
Industrial Economics,50(2), 197–234.
Myatt, D., and Wallace, C. (2002). Equilibrium Selection and Public Good Provision: the
Development of Open-Source Software.Oxford Review of Economic Policy,18(4), 446–
461.
Rossi, C., and Bonaccorsi, A. (2006). Intrinsic Motivations and Profit-Oriented Firms in Open Source Software: Do Firms Practice What They Preach? In J. Bitzer and P. Schr¨oder
(Eds.),The Economics of Open Source Software Development (pp. 83 – 110).
Amster-dam: Elsevier.
von Krogh, G., Spaeth, S., and Lakhani, K. (2003). Community, joining, and specialization in open source software innovation: A case study. Research Policy,32(7), 1217 – 1241. Xu, J., Christley, S., and Madey, G. (2006). Application of Social Network Analysis to the
Study of Open Source Software. In J. Bitzer and P. Schr¨oder (Eds.),The Economics
T able 1: Descriptiv e Statistics -ICT Surv ey P ercen tiles V ariable: Standard Mean Deviation 25% 50% 75% 90% Sales (in millions Euro) 137.5 1,829.2 1.2 5.0 25.0 100.0 T otal Emplo yees 295.0 1,497.4 12.0 40.0 150.0 500.0 T otal In vestmen ts (in millions Euro) 27.2 988.8 0.0 0.2 1.0 5.0 Lab or Pro ductivit y (Sales/Emplo yees) 0.24 1.19 0.08 0.12 0.20 0.60 R&D In tensit y (% of Sales) 8.8 15.6 0.0 2.0 10.0 25.0 R&D Emplo yees (% of Emplo yees) 11.8 19.6 0.0 3.4 13.9 33.3 In tro duction of Pro duct Inno vations 2004-06 (% of Firms) 58.3 49.4 In tro duction of Pro cess Inno vations 2004-06 (% of Firms) 65.2 47.8 V alue in 2006 of Pro duct Inno vations 2004-06 (% of Sales) 14.0 20.5 0.0 1.0 20.0 40.0 V alue in 2006 of Pro cess Inno vations 2004-06 (% of Cost Reductions) 5.9 9.0 0.0 0.0 10.0 20.0 % of Emplo yees w orking (mainly) with PC 47.5 33.5 20.0 40.0 80.0 100.0 Use of En terprise Resource Planning (% of Firms) 60.3 48.9 Use of Supply Chain Managemen t Soft w are (% of Firms) 39.6 48.9 Use of Customer Relationship Managemen t Soft. (% of Firms) 50.4 50.0 In ternet Access (% of Firms) 97.7 15.0 Use of Op en Source (% of Firms) 33.6 47.3 Notes: The sample includes 8,800 observ ations from the ZEW-ICT Surv ey of 2003 and 2006.
T able 2: Descriptiv e Statistics -Comparison of with and without Op en Source Soft w are (OSS) By T yp e of Op en Source Adopted: Serv er Op. System PC Op. System Soft w are Apps. V ariable: En tire Sample With Without With Without With Without Sales (in millions Euro) 137.5 181.6 101.3 43.0 137.5 56.8 139.3 (1,846.4) (2,257.32) (869.6) (146.5) (1,509.2) (177.6) (1,548.2) T otal Emplo yees 295.0 365.2 260.8 257.6 294.9 317.0 282.5 (1,507.7) (1,260.94) (1,583.4) (1,232.6) (1,546.5) (1,280.4) (1,552.3) Lab or Pro ductivit y ( yi /li ) 0.24 0.3 0.2 0.2 0.3 0.2 0.3 (1.2) (2.3) (0.4) (0.2) (1.3) (0.2) (1.4) % of Emplo yees w orking with PC 47.5 59.4 43.2 59.3 45.5 61.0 44.4 (33.5) (32.4) (32.9) (33.6) (33.1) (33.4) (32.8) R&D Exp enditures (% of Sales) 8.8 13.6 7.4 15.9 7.8 13.7 7.9 (15.7) (19.6) (13.7) (22.9) (13.6) (18.9) (14.6) R&D Emplo yees (% of Emplo yees) 11.8 17.8 11.0 21.2 11.4 17.8 11.7 (19.6) (24.5) (19.3) (27.9) (19.3) (24.2) (20.1) V alue of Pro duct Inno vations (% of Sales) 14.0 18.1 12.6 18.3 13.3 17.4 13.3 (20.6) (20.5) (20.1) (21.5) (20.0) (19.7) (20.4) V alue of Pro cess Inno vations (% of Cost Reductions) 5.9 7.5 5.1 7.6 5.4 6.9 5.5 (9.0) (8.9) (8.1) (9.1) (8.2) (8.3) (8.3) Notes: The sample includes 8,800 observ ations from the ZEW-ICT Surv ey of 2003 and 2006. Standard errors in paren theses.
Table 3: Impact of the use of OSS (Servers and General Applications) on Labor Productivity
OLS IV OLS IV
Dependent Variable:
Labor Productivity 2006 (in Logs) (1) (2) (3) (4) (5) (6)
Labor 2006 (in Logs) -0.1691*** -0.2951*** -0.2759*** -0.1692*** -0.2953*** -0.2772*** (0.0325) (0.0488) (0.0464) (0.0322) (0.0487) (0.0462) Investments 2006 (in Logs) 0.1606*** 0.3298*** 0.3044*** 0.1610*** 0.3288*** 0.3030***
(0.0297) (0.0460) (0.0437) (0.0296) (0.0459) (0.0436) OS Servers’ Op. Sys. (OSSRV) -0.0196 -0.0293 -0.0885
(0.0535) (0.0561) (0.0557)
OS Applications (OSAPP) -0.0689 -0.0002 -0.0722 (0.0545) (0.0592) (0.0588) % of Employees with PC (PCW) 0.5047*** 0.5572*** 0.5114*** 0.5549***
(0.0955) (0.1039) (0.0952) (0.1045) Enterprise Res. Planning (ERP) 0.1129** 0.0652 0.1157** 0.0685
(0.0558) (0.0623) (0.0559) (0.0621) Supply Chain Management (SCM) 0.0551 0.0072 0.0526 0.0059
(0.0563) (0.0592) (0.0563) (0.0592) Customer Rel. Management (CRM) 0.0446 0.1078 0.0462 0.1031* (0.0525) (0.0536) (0.0524) (0.0532) Export Activity 0.1628*** 0.2082*** 0.1452** 0.1625*** 0.2051*** 0.1403** (0.0577) (0.0598) (0.0588) (0.0572) (0.0593) (0.0584) East Germany -0.2297*** -0.1334** -0.1279** -0.2315*** -0.1351** -0.1343** (0.0550) (0.0597) (0.0582) (0.0550) (0.0596) (0.0580) Constant -1.4355*** -0.5329** -0.8347*** -1.4337*** -0.5378** -0.8365*** (0.1876) (0.2507) (0.2474) (0.1871) (0.2506) (0.2469) Number of Observations 1029 847 845 1029 847 845 F-statistic 13.62 13.76 Wald-χ2-statistic 213.99 271.99 214.34 274.02 R2 0.2594 0.2057 0.2617 0.2603 0.2063 0.2619
In the IV regressions labor and investments were instrumented with their corresponding 3-year lagged values.
First stage regressions (two for each IV estimation) exhibited satisfactory diagnostic statistics and are available upon request. Robust standard errors in parenthesis. Industry dummies included.
Table 4: Impact of the use of OSS (PC Operating Systems) on Labor Productivity
OLS Instrumental Variables Dependent Variable:
Labor Productivity 2006 (in Logs) (1) (2) (3) (4) (5) (6)
Labor 2006 (in Logs) -0.1718*** -0.2974*** -0.2710*** -0.2805*** -0.2799*** -0.2975*** (0.0320) (0.0487) (0.0465) (0.0461) (0.0480) (0.0448) Investments 2006 (in Logs) 0.1622*** 0.3311*** 0.3136*** 0.3055*** 0.3061*** 0.3217***
(0.0295) (0.0460) (0.0434) (0.0436) (0.0451) (0.0433) OS PCs’ Op. Sys. (OSPC) -0.1109* -0.0704 -0.1121* -0.1212* -0.1259** -0.1290**
(0.0621) (0.0640) (0.0637) (0.0628) (0.0632) (0.0631) % of Employees with PC (PCW) 0.5087*** 0.6157*** 0.5550*** 0.5559*** 0.5445***
(0.0947) (0.1042) (0.1030) (0.1005) (0.1031) Enterprise Res. Planning (ERP) 0.1176** 0.0701 0.0648 0.0782
(0.0558) (0.0621) (0.0640) (0.0645) Supply Chain Management (SCM) 0.0541 0.0079 0.0129 -0.0038
(0.0561) (0.0588) (0.0594) (0.0593) Customer Rel. Management (CRM) 0.0470 0.1038* 0.0980* 0.0934* (0.0522) (0.0532) (0.0543) (0.0538) Extra ICT-related Qualification (ICTQ) 0.0666
(0.1777)
ICT Consulting -0.0342
(0.0534)
Outsourcing of ICT Schooling 0.0542
(0.1017) Export Activity 0.1691*** 0.2107*** 0.1710*** 0.1454** 0.1486** 0.1393** (0.0579) (0.0595) (0.0583) (0.0586) (0.0588) (0.0590) East Germany -0.2269*** -0.1325** -0.1191** -0.1284** -0.1236** -0.1233** (0.0546) (0.0596) (0.0583) (0.0580) (0.0587) (0.0581) Constant -1.4180*** -0.5189** -0.7984*** -0.8155*** -0.8082*** -0.7379*** (0.1853) (0.2516) (0.2482) (0.2468) (0.2570) (0.2647) Number of Observations 1029 847 845 845 838 833 F-statistic 13.78 Wald-χ2-statistic 214.39 267.79 274.58 272.46 284.77 R2 0.2614 0.2057 0.2502 0.2623 0.2622 0.2666
In the IV regressions labor and investments were instrumented with their corresponding 3-year lagged values.
First stage regressions (two for each IV estimation) exhibited satisfactory diagnostic statistics and are available upon request. Robust standard errors in parenthesis. Industry dummies included.
Table 5: Impact of OSS on the Value of Introduced Process Innovations
Dependent Variable: Ordinary Least Squares
Value of Introduced (1) (2) (3) (4) (5) (6)
Process Innovations 2006
OS PCs’ Op. Sys. (OSPC) 0.0209*** 0.0198** 0.0180** -0.0083 -0.0082 -0.0089 (0.0079) (0.0078) (0.0077) (0.0089) (0.0089) (0.0090) Labor 2006 (in Logs) -0.0026 -0.0018 -0.0042 -0.0036 -0.0037 -0.0035
(0.0025) (0.0025) (0.0026) (0.0026) (0.0026) (0.0026) Investments 2006 (in Logs) 0.0034* 0.0032* 0.0025 0.0024 0.0025 0.0025
(0.0019) (0.0019) (0.0018) (0.0018) (0.0018) (0.0019) Process Innovations 2001-2003 0.0226*** 0.0213*** 0.0198*** 0.0196*** 0.0197*** 0.0182***
(0.0055) (0.0056) (0.0056) (0.0055) (0.0056) (0.0057) % of Employees with PC (PCW) 0.0254** 0.0194* 0.0192* 0.0199** 0.0174* (0.0100) (0.0100) (0.0099) (0.0099) (0.0104) Enterprise Res. Planning (ERP) 0.0130** 0.0134** 0.0132** 0.0119* (0.0064) (0.0064) (0.0064) (0.0066) Supply Chain Management (SCM) 0.0124* 0.0127** 0.0120* 0.0127* (0.0065) (0.0064) (0.0064) (0.0065) Customer Rel. Management (CRM) 0.0045 -0.0030 -0.0040 -0.0036
(0.0057) (0.0061) (0.0061) (0.0062)
OSPC ×CRM 0.0459*** 0.0439*** 0.0434***
(0.0141) (0.0139) (0.0141)
B2C 0.0132** 0.0110*
(0.0065) (0.0066) Extra IT-related Qualification (ICTQ) 0.0216
(0.0143)
ICT Consulting -0.0016
(0.0057)
Outsourcing of ICT Schooling 0.0001
(0.0078) Export Activity -0.0061 -0.0084 -0.0124** -0.0126** -0.0121** -0.0115* (0.0058) (0.0059) (0.0060) (0.0060) (0.0060) (0.0061) East Germany -0.0091* -0.0090* -0.0089* -0.0080 -0.0079 -0.0079 (0.0055) (0.0054) (0.0054) (0.0053) (0.0053) (0.0054) Constant 0.0511*** 0.0424*** 0.0427*** 0.0428*** 0.0404*** 0.0406** (0.0148) (0.0150) (0.0149) (0.0149) (0.0150) (0.0163) Number of Observations 1035 1033 1033 1033 1032 1009 F-statistic 3.34 3.33 3.83 3.79 3.82 3.52 R2 0.0526 0.0600 0.0722 0.0821 0.0862 0.0905
Table 6: Impact of Open Source Software on R&D Intensities
Ordinary Least Squares
Dependent Variable: R&D Expenditures R&D Employees
(% of Sales) (% of Employees)
(1) (2) (3) (4) (5) (6)
OS Servers’ Op. Sys. (OSSRV) 0.0291** 0.0241*
(0.0145) (0.0138)
OS PCs’ Op. Sys. (OSPC) 0.0304* 0.0313*
(0.0174) (0.0183)
OS Applications (OSAPP) 0.0242 0.0133
(0.0153) (0.0151)
Labor 2006 (in Logs) -0.0008 -0.0002 -0.0007 -0.0302*** -0.0295*** -0.0300*** (0.0049) (0.0049) (0.0049) (0.0061) (0.0061) (0.0061) Investments 2006 (in Logs) 0.0006 0.0010 0.0012 0.0000 0.0001 0.0004
(0.0033) (0.0032) (0.0032) (0.0042) (0.0042) (0.0042) % of Employees with PC (PCW) 0.0295 0.0335 0.0321 0.0568*** 0.0589* 0.0589* (0.0201) (0.0209) (0.0209) (0.0224) (0.0227) (0.0228) Product Innovations 2001-2003 0.0226** 0.0236** 0.0236** 0.0579*** 0.0580*** 0.0587***
(0.0100) (0.0100) (0.0101) (0.0122) (0.0123) (0.0123) Enterprise Res. Planning (ERP) 0.0057 0.0041 0.0050 -0.0075 -0.0087* -0.0081
(0.0117) (0.0117) (0.0117) (0.0140) (0.0140) (0.0140) Supply Chain Management (SCM) 0.0319*** 0.0311** 0.0321*** 0.0229* 0.0227 0.0230* (0.0128) (0.0128) (0.0128) (0.0139) (0.0138) (0.0139) Customer Rel. Management (CRM) -0.0174 -0.0155 -0.0161 -0.0065 -0.0053 -0.0053
(0.0131) (0.0129) (0.0129) (0.0120) (0.0120) (0.0120) Export Activity 0.0162 0.0158 0.0166 0.0278* 0.0280* 0.0291* (0.0127) (0.0127) (0.0127) (0.0153) (0.0151) (0.0152) East Germany 0.0103 0.0102 0.0116 -0.0094 -0.0096 -0.0081 (0.0122) (0.0122) (0.0122) (0.0121) (0.0123) (0.0123) Constant -0.0075 -0.0085 -0.0043 0.1102*** 0.1075*** 0.1122*** (0.0233) (0.0231) (0.0228) (0.0319) (0.0316) (0.0318) Number of Observations 880 880 880 1176 1176 1176 F-statistic 4.83 4.88 4.88 10.40 10.41 10.41 R2 0.1623 0.1614 0.1601 0.2297 0.2302 0.2280
Robust standard errors in parenthesis. Industry dummies included. ***, **, * depict significance at the 1%, 5% and 10% level respectively.