STATE-OF-THE-ART PAPER
T1 Mapping
Basic Techniques and Clinical Applications
Andrew J. Taylor, MD, PHD,*Michael Salerno, MD, PHD,yRohan Dharmakumar, PHD,zMichael Jerosch-Herold, PHDx
JACC: CARDIOVASCULAR IMAGINGCME
CME Editor:Ragavendra R. Baliga, MD
This article has been selected as this issue’s CME activity, available online athttp://www.acc.org/jacc-journals-cmeby selecting the CME tab on the top navigation bar.
Accreditation and Designation Statement
The American College of Cardiology Foundation (ACCF) is accredited by the Accreditation Council for Continuing Medical Education (ACCME) to provide continuing medical education for physicians.
The ACCF designates this Journal-based CME activity for a maximum of 1AMA PRA Category 1 Credit(s). Physicians should only claim credit commensurate with the extent of their participation in the activity.
Method of Participation and Receipt of CME Certificate
To obtain credit for this CME activity, you must:
1. Be an ACC member orJACC: Cardiovascular Imagingsubscriber. 2. Carefully read the CME-designated article available online and in this
issue of the journal.
3. Answer the post-test questions. At least 2 out of the 3 questions provided must be answered correctly to obtain CME credit.
4. Complete a brief evaluation.
5. Claim your CME credit and receive your certificate electronically by following the instructions given at the conclusion of the activity.
CME Objective for This Article:After reading this article the reader should be able to understand the role and use of CMR T1 mapping to detect myocardial pathologies such as diffuse interstitialfibrosis and edema.
CME Editor Disclosure:JACC: Cardiovascular ImagingCME Editor Ragavendra R. Baliga, MD, has reported that he has no relationships to disclose.
Author Disclosures:The authors have reported that they have no re-lationships relevant to the contents of this paper to disclose.
Medium of Participation:Print (article only); online (article and quiz).
CME Term of Approval
Issue Date: January 2016 Expiration Date: December 31, 2016
From the *Department of Cardiovascular Medicine, Alfred Hospital and BakerIDI Heart and Diabetes Research Institute,
Melbourne, Australia; yDepartments of Medicine, Radiology, and Biomedical Engineering, University of Virginia,
Charlottesville, Virginia;zBiomedical Imaging Research Institute and Cedars-Sinai Heart Institute, Cedars-Sinai Medical Center, Los Angeles, California; and thexDepartment of Radiology, Brigham & Women’s Hospital, Boston, Massachusetts. The authors have reported that they have no relationships relevant to the contents of this paper to disclose.
T1 Mapping
Basic Techniques and Clinical Applications
ABSTRACTIn cardiac magnetic resonance (CMR) imaging, the T1 relaxation time for the 1H magnetization in myocardial tissue may represent a valuable biomarker for a variety of pathological conditions. This possibility has driven the growing interest in quantifying T1, rather than just relying on its effect on image contrast. The techniques have advanced to where pixel-level myocardial T1 mapping has become a routine component of CMR examinations. Combined with the use of contrast agents, T1 mapping has led an expansive investigation of interstitial remodeling in ischemic and nonischemic heart disease. The purpose of this review was to introduce the reader to the physical principles of T1 mapping, the imaging techniques developed for T1 mapping, the pathophysiological markers accessible by T1 mapping, and its clinical uses. (J Am Coll Cardiol Img 2016;9:67–81) © 2016 by the American College of Cardiology Foundation.
O
ne of the unique aspects of magneticreso-nance imaging (MRI) is the sensitivity of the soft tissue image contrast to tissue composition, which can be a reflection of physiology and pathophysiology. The T1 relaxation time, a mea-sure of how fast the nuclear spin magnetization returns to its equilibrium state after a radiofrequency (RF) pulse in the MRI scanner, is a key source of soft tissue contrast in MRI. It was generally consid-ered sufficient to have the T1 relaxation properties “encoded”in the pixel intensity of images, referred to as T1 weighting (e.g., after contrast administration) to highlight“focal”pathology, such as acute myocar-dial infarction (MI) and chronic scar tissue, or to detect fatty infiltration in myocardial tissue.
The role of diffuse, reactivefibrosis, characterized by a disproportionate accumulation of collagen in the heart, has long been identified as an important factor in the etiologies of diastolic dysfunction, heart failure, and sudden cardiac death. The myocardial interstitium therefore became the subject of intense focus, but the diffuse nature of the structural changes made it almost impossible to detect interstitial fibrosis by using conventional T1-weighted imaging. Advances in cardiac magnetic resonance (CMR) imaging techniques over the last few years have rendered it feasible to quantify T1 in the heart and to generate color-encoded T1 maps, in which the pixel values represent the T1 in each voxel (rather than a signal intensity in arbitrary units). T1 maps can depict even relatively small variations of T1 within the heart muscle to highlight tissue pathology. Through the use of extracellular paramagnetic contrast agents, struc-tural changes in the myocardium can be“amplified.” For example, it is possible with T1 mapping per-formed before and after injection of a contrast agent
to measure a parameter called the extracellular vol-ume (ECV), which quantifies the relative expansion of the extracellular matrix as a result of diffuse reactive fibrosis in multiple cardiac pathologies; the result is creation of a noninvasive alternative to myocardial biopsies and histochemical analysis. Furthermore, T1 mapping without administration of a paramagnetic contrast agent, referred to as“native”T1 mapping, is sensitive to myocardial edema, iron overload, and the presence of myocardial infarcts and scarring. For these reasons, T1 mapping is becoming an essential tool for the CMR imager trying to understand myocardial tissue pathology and its prognostic im-plications. In addition, by quantifying tissue charac-teristics through T1 mapping, it becomes feasible to follow longitudinal changes, an essential aspect for using these novel markers in treatment trials.
With these rapid developments, the term T1 map-ping encompasses a number of approaches to assess tissue remodeling by CMR involving some form of T1 imaging, and either only the native T1 (i.e., without giving contrast) or in combination with a contrast agent. Similarly, the list of indices derived from these measurements has grown longer with time, although native T1 and the ECV fraction are arguably the
most-often derived measures. The present review,
although by no means exhaustive, presents an over-view of thefield, starting from the physical principles to the clinical applications of T1 mapping in the heart.
PHYSICAL CONCEPTS OF T1 RELAXATION The measurement of the T1 relaxation time requires measuring the spin magnetization component in the direction of the magneticfield in the magnetic reso-nance scanner (“longitudinal” component) after it
was disturbed from its equilibrium state (e.g., by applying an RF pulse to invert the magnetization). The recovery of the longitudinal magnetization after inversion is, despite the complex structure of tissues, surprisingly well approximated in many instances by an exponential function. T1 is the decay constant for the exponential recovery of the longitudinal magnetization toward its equilibrium state. The rate at which the spin magnetization recovers to its equilibrium state depends on mechanisms that allow the spins to exchange energy with their sur-roundings. For example, interactions between the inverted magnetic spin moments and magnetic dipole moments of neighboring molecules that undergo tumbling motion can provide such a relaxation mechanism, which is particularly effective if the tumbling motion occurs near the resonance fre-quency of the spin moments. Another relaxation mechanism is provided by interactions with the paramagnetic moments in contrast agent molecules, which are particularly effective in shortening T1. IMAGING TECHNIQUES FOR T1 MAPPING GENERAL CONCEPTS.A variety of techniques have been used to quantify myocardial T1 relaxation times, each with specific advantages and limitations (1–7). Several recent articles have reviewed T1-mapping pulse sequences and their potential clinical utility
(7–9). Understanding the basic concepts of T1-mapping pulse sequences will help the imager choose the most appropriate technique for a given situation.
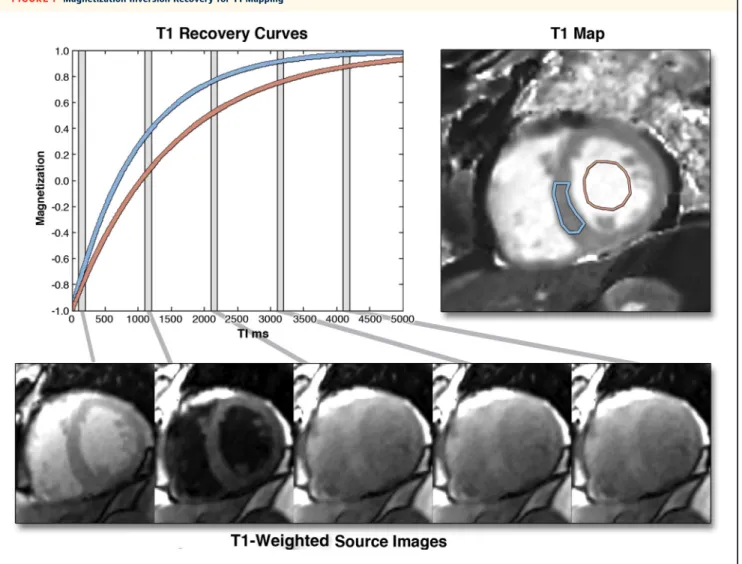
The general principle for T1 mapping is to acquire multiple images with different T1 weightings and to fit the signal intensities of the images to the equation for T1 relaxation (Figure 1). For T1 measurements, the equilibrium magnetization is either inverted or nul-led with RF pulses, and T1-weighted images are acquired at different times after the inversion (TI) or time after saturation pulse. In both cases, the data can be fit to an equation of the form A-B,exp(–t/T1), whereAandBarefitting parameters related to the equilibrium magnetization and type of preparation, t is the time after the preparation (i.e., either TI or time after saturation pulse), andT1is the T1 relaxation time. T1 times can be determined for regions of interest, myocardial segments, or at each pixel location to form a T1 map; in the latter case, pixel intensities in the images correspond to the fitted T1 values (Figure 2).
T1-MAPPING TECHNIQUES. A basic, but inefficient, technique for quantifying T1 is to collect a series of inversion recovery–prepared images, such as used for late gadolinium enhancement (LGE) imaging but
with different TIs. This approach enables T1 maps to be calculated at a specific phase of the cardiac cycle, but it requires multiple breath-holds and is subject to image misreg-istration between breath-holds. This tech-nique was used in previous studies(3,4)but has been superseded by techniques that can acquire all of the data for a T1 map in a single breath-hold.
LOOK-LOCKER TECHNIQUE. One of the most efficient methods for measuring T1 with MRI is the Look-Locker technique. With this technique, image data segments are acquired repeatedly after an inversion pulse to create multiple images along the recovery curve, each with a well-defined TI. The image acquisition process is repeated after a period on the order of 5*T1 to allow for complete magnetization recovery in between Look-Locker“cycles.”The advantage of this type of technique is that a large number of segmented images are available forfitting T1; it has a number of important disadvantages, however. Because the heart is at a different phase of the cardiac cycle on each image, T1 mapping is not possible as there may be sig-nificant in-plane and through-plane motion
(10). Furthermore, the RF pulses used to ac-quire the data affect the T1 recovery curve, resulting in an apparent T1 (termed T1*), which is not the same as the T1 for an undisturbed inversion recovery. The T1 relaxation time can be recovered by using the following approximation: T1 ¼ (B/A – 1) , T1* (the fitting parameters are as described in the previous section). Finally, if complete relaxation is not allowed between Look-Locker cycles, there will be a heart rate–dependent bias in T1 measurements; this bias will be worse for longer T1 relaxation times and for faster heart rates unless this variation is specifically accounted for in the fitting routine. A number of studies (1,11) have used this technique; however, it has largely been replaced by newer techniques that use single-shot image acquisition, where all of the data for each T1-weighted image is acquired in a single heartbeat, as described in the following sections.
THE MODIFIED LOOK-LOCKER PULSE SEQUENCE. The most widely used clinical technique for T1 mapping to date is the modified Look-Locker sequence (MOLLI) and variants thereof. MOLLI was a significant advance over earlier techniques and ushered in the era of clin-ical cardiac T1 mapping (12). In MOLLI, single-shot images are acquired intermittently in diastole during
A B B R E V I A T I O N S A N D A C R O N Y M S
ECV= extracellular volume
HCM= hypertrophic
cardiomyopathy
HFpEF= heart failure with preserved ejection fraction
LGE= late gadolinium
enhancement
LV= left ventricular
MI= myocardial infarction
MOLLI= modified Look-Locker sequence
MRI= magnetic resonance
imaging
SASHA= saturation recovery single-shot acquisition
RF= radiofrequency
ShMOLLI= short modified Look-Locker sequence
SR= saturation recovery
SSFP= steady-state free
precession
T1= time constant for recovery
of longitudinal magnetization
TI= time after magnetization
inversion
T2= time constant for loss of
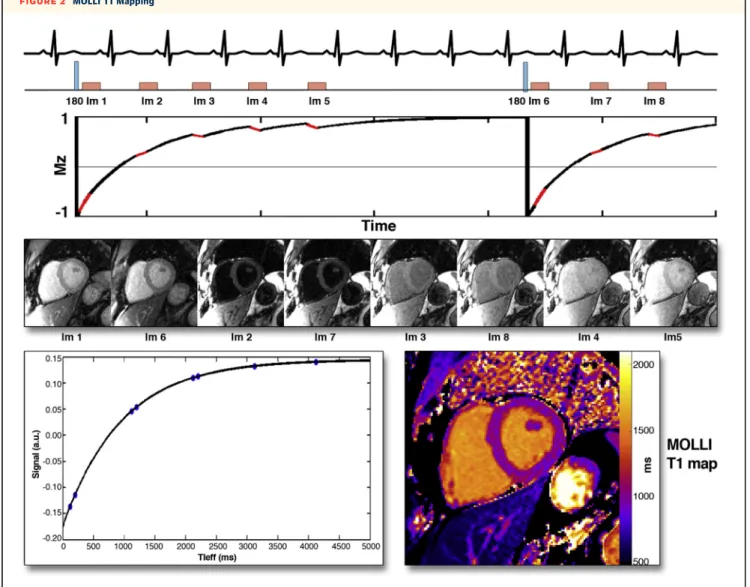
3 to 5 heartbeats after the inversion pulse, resulting in images spaced by the RR-interval along the T1 recovery curve (Figure 2). Multiple inversions with slightly different TIs are used to more evenly sample the T1 recovery curve. In the original implementation, 3 im-ages were acquired after the first and second in-versions, and 5 images were acquired after the third inversion, with 3 recovery beats to allow for more complete T1 recovery between inversion pulses. This acquisition is frequently denoted as 3(3)3(3)5; these numbers represent the number of images acquired after each inversion, and the numbers in parentheses represent the number of heartbeats for rest periods between inversion recovery pulses. The MOLLI tech-nique has been shown to be highly reproducible and yields source images with a high signal-to-noise ratio
(12,13). Given that the steady-state free precession (SSFP) readout used in MOLLI perturbs the T1 recovery curve, the measured T1* is still corrected (as described earlier).
A limitation of the standard MOLLI pulse sequence is the need to acquire data over 17 heartbeats, which may be too long of a breath-hold duration for some patients. Also, similar to the Look-Locker technique, if insufficient time is allowed for full recovery of magnetization, the derived T1 values will be heart rate dependent. Multiple modifications to the MOLLI technique have been proposed to overcome this heart rate dependence and to shorten the breath-hold duration(8,9,14,15). One popular MOLLI variation is the 5(3)3 variant(8). This acquisition has the advan-tage in that it only requires 11 heartbeats, and by FIGURE 1 Magnetization Inversion Recovery for T1 Mapping
The graph on theleftshows 2 inversion recovery curves for a septal region of interest(blue)and the blood pool, generated from images, shown in thebottom row, taken at different times after an inversion pulse at time t¼0. Similar inversion recovery curves can be generated for each pixel location if the images are all acquired during a breath-hold and for the same cardiac phase. The T1 for each pixel location can be used to generate a T1 map, as shown in thetop-rightimage. T1 maps represent arguably the most succinct and informative summary of the spatial and temporal changes during an inversion recovery.
moving the 5 beat acquisitions to the beginning, there is more recovery of magnetization.
A further shortening of the acquisition time is achieved with the“shortened”modified Look-Locker technique (shMOLLI). shMOLLI has a 5(1)1(1)1 acqui-sition strategy (3 Look-Locker cycles over 9 heart-beats), in which the last, or the last 2, magnetization inversions may not be complete depending on T1, and T1 is therefore determined by a“conditional”fitting routine(15).“Conditional”refers to the fact that the data from the last 2 Look-Locker cycles are only used if the T1 is short enough to allow for near-complete relaxation recovery after the second and/or first
Look-Locker cycle. ShMOLLI has been shown to have very little heart rate dependence and requires a short breath-hold.
Because there is often residual heart motion even during a breath-hold, nonrigid registration tech-niques to correct this motion significantly improves the robustness and clinical utility of this technique
(8). MOLLI and shMOLLI can still be subject to a slight systematic bias to underestimate T1 because the image readouts during the inversion recovery can have an effect that depends on factors such as T2 (i.e., the time constant for loss of transverse magne-tization)(16), how closely the RF excitations match FIGURE 2 MOLLI T1 Mapping
Acquisition strategy for the modified Look-Locker sequence (MOLLI). In this particular example, and after an 180inversion pulse, images are acquired in diastole over 5 heartbeats, followed by a rest period of 3 heartbeats. After another inversion, another 3 image are acquired with slightly offset TIs to sample more points along the inversion recovery curves. Based on the number of heartbeats for acquiring images after each inversion pulse, and a rest period of 3 heart beats between the 2 cycles, this MOLLI acquisition scheme is termed 5(3)3. Images are sorted in order of increasing TI, and the signal intensity in each pixel isfit to the T1 recovery curve. Performing this technique for all pixels in the image yields a T1 map(bottom right).
the spin precession frequency (“off-resonance” ef-fect), and magnetization transfer effects(17). Despite these potential limitations, when the same MOLLI variant and pulse sequence parameters are used, the T1 values from MOLLI are highly reproducible. T1 mapping using MOLLI-based techniques has been applied to a substantial number of patients with different cardiac pathologies.
SATURATION RECOVERY–BASED T1-MAPPING TECHNIQUES.Saturation recovery (SR) techniques are an alternative to inversion recovery techniques that may have potential for improved accuracy in T1 determination. A saturation RF pulse effectively nulls the longitudinal magnetization independently
of its state before the saturation pulse. Thus, there is no need to wait for T1 recovery between saturation pulses, and there is no heart rate dependence for the measured T1s (Figure 3)(18). The main drawback of SR-based techniques is that a saturation preparation results in one-half of the dynamic range of an
inver-sion preparation, which reduces the potential
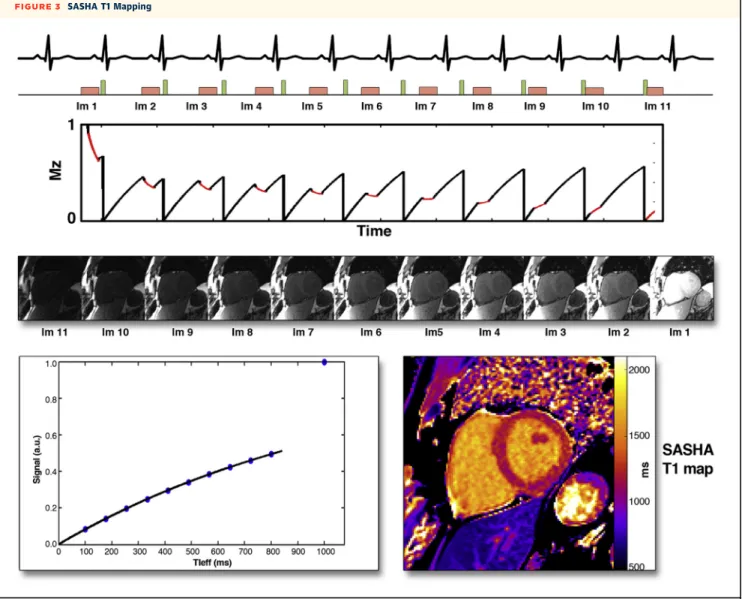
precision of the measurement. The first described technique, SAP-T1, was based on a single-shot gradient echo readout scheme, but it had a poor signal-to-noise ratio, particularly at 1.5-T. More recently, the saturation recovery single-shot acquisi-tion (SASHA) technique was introduced, which uses an SSFP readout that results in higher signal-to-noise FIGURE 3 SASHA T1 Mapping
Acquisition strategy for saturation recovery single-shot acquisition (SASHA): an image without saturation and representative of the equilibrium magnetization is acquired in thefirst heartbeat, followed by a 10 saturation recovery acquisitions with different time after saturation pulse (TS). Images are sorted in order of increasing TS, and the signal intensity in each pixel isfit to the T1 recovery curve, yielding a T1 map. The image representing the equilibrium magnetization corresponds to a TI>>T1 and is therefore last in this sequence.
ratio. The SASHA technique consists of 1 image ac-quired without any SR preparation in thefirst heart-beat, followed by SR images with varying saturation time in the next 10 heartbeats, resulting in a total of 11 images forfitting T1 (Figure 3) (19). This technique overcomes a number of the systematic biases present with MOLLI-based techniques but has a lower signal-to-noise ratio than MOLLI because it is based on an SR instead of an inversion recovery.
A number of other saturation-based T1-mapping techniques have been described (20,21). An addi-tional technique, which combines a saturation pulse followed by a delay and then an inversion pulse called SAPPHIRE, has also been described; this tech-nique produces T1 values similar to SASHA but has a slightly higher precision(22).
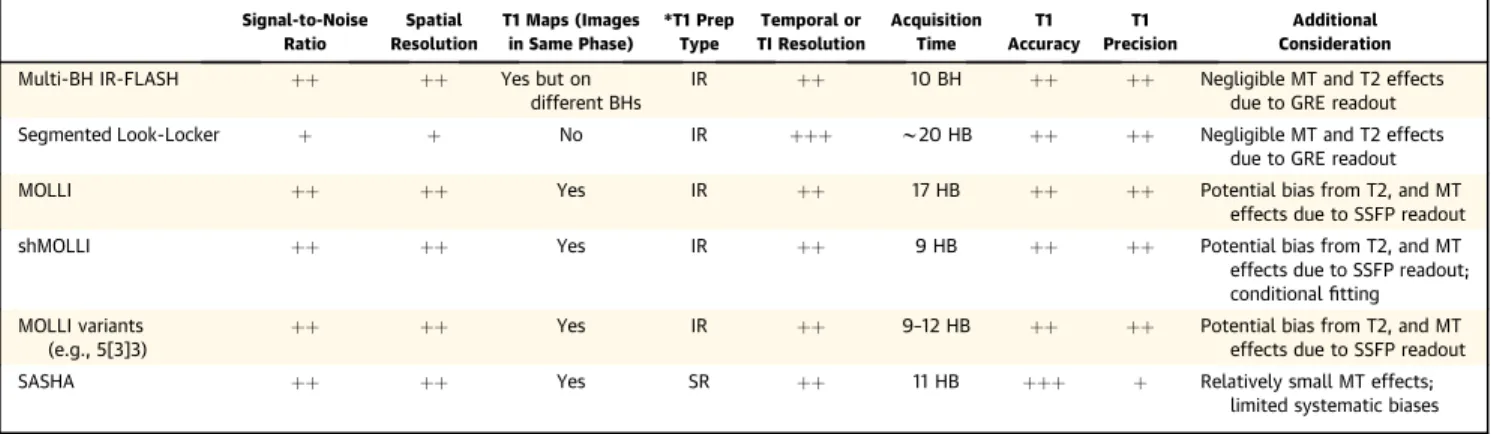
GUIDANCE FOR THE IMAGER CONCERNING THE CLINICAL USE OF T1-MAPPING TECHNIQUES.The advantages and disadvantages of several T1 mapping techniques are summarized in Table 1. It is note-worthy that certain variants of MOLLI may have considerable heart rate dependence, particularly in patients with high heart rates and for pre-contrast (i.e., native) T1 mapping. ShMOLLI, and certain variants of MOLLI such as 5(4)3, have minimal heart rate dependence and have been shown to produce similar T1 estimates in vivo. These techniques tend to have the highest precision (lowest uncertainty) but have a tendency to result in measured T1 values
lower than the SR-based techniques. SR-based
techniques such as SASHA have more accurate measurement of T1 but tend to have lower precision (more uncertainty). These trends were verified in a paper directly comparing MOLLI, ShMOLLI, SASHA, and SAPPHIRE(22).
Some general issues should be considered when applying T1-mapping techniques clinically. First, because the T1 maps rely on anatomy being aligned between all images, it is important to inspect the raw T1-weighted images to assess the position of the heart. If there is significant cardiac or respiratory motion, it is best to repeat the measurement. Simi-larly when nonrigid registration is used to correct respiratory motion, it is important to inspect the registered T1-weighted images to confirm that they are properly aligned. Some of these issues can be difficult to spot just by looking at the T1 maps, and for this reason, some software programs provide maps of “quality of fit” parameters (e.g., R2for thefit).
Sec-ond, it is important to standardize the T1 methodol-ogy used at each institution and to determine the range of normal T1 values according to the in-stitution’s specific sequence parameters. There are a number of ongoing efforts aimed at standardization of T1 measurements between sites and vendors. Sig-nificant changes to the specific parameters of the SSFP readout module should be avoided because they can introduce biases to the measured T1 values that depend on T2, resonance frequency offsets, or magnetization transfer effects. Thus, caution is war-ranted when comparing T1 measurements acquired by using different techniques and/or widely different parameters.
ECV IMAGING: COMBINING NATIVE AND CONTRAST-ENHANCED T1 MAPPING. Myocardium can be grossly divided into 3 compartments: 1) an intracellular compartment (consisting of myocytes, fibroblasts, endothelial cells, and smooth muscle cells); 2) an intravascular compartment (blood); and 3) an inter-stitial space (the residual space within the myocardium TABLE 1 Comparison of T1-Imaging Techniques
Signal-to-Noise Ratio Spatial Resolution T1 Maps (Images in Same Phase) *T1 Prep Type Temporal or TI Resolution Acquisition Time T1 Accuracy T1 Precision Additional Consideration
Multi-BH IR-FLASH þþ þþ Yes but on
different BHs
IR þþ 10 BH þþ þþ Negligible MT and T2 effects
due to GRE readout
Segmented Look-Locker þ þ No IR þþþ w20 HB þþ þþ Negligible MT and T2 effects
due to GRE readout
MOLLI þþ þþ Yes IR þþ 17 HB þþ þþ Potential bias from T2, and MT
effects due to SSFP readout
shMOLLI þþ þþ Yes IR þþ 9 HB þþ þþ Potential bias from T2, and MT
effects due to SSFP readout; conditionalfitting MOLLI variants
(e.g., 5[3]3)
þþ þþ Yes IR þþ 9–12 HB þþ þþ Potential bias from T2, and MT
effects due to SSFP readout
SASHA þþ þþ Yes SR þþ 11 HB þþþ þ Relatively small MT effects;
limited systematic biases BH¼breath-hold; FLASH¼fast low angle shot; GRE¼gradient echo; IR¼inversion recovery; MOLLI¼modified Look-Locker sequence; MT¼magnetization transfer; SASHA¼saturation recovery single-shot acquisition; shMOLLI¼shortened modified Look-Locker technique; SR¼saturation recovery; SSFP¼steady-state with free precession imaging; T1¼time constant for recovery of longitudinal magnetization; T2¼time constant for loss of transverse magnetization.
once the intracellular and intravascular compartments are removed). ECV comprises the interstitial and intravascular spaces, and, in general, it is assumed that changes in ECV are predominantly driven by changes in the interstitial volume fraction. A number of disease processes that affect the myocardium can be under-stood on the basis of ECV changes.
T1 measurements or mapping has been used to quantify ECV by combining native and contrast-enhanced T1 maps of blood and myocardium (Central Illustration). The change of the T1 relaxation rate (i.e., 1/T1) in blood between pre- and post-contrast imaging is converted with the blood hematocrit into a reference for plasma T1, which serves as reference for the T1 changes in tissue(23). If the change of 1/T1 in blood and tissue is expressed as
D
R1bandD
R1t, respectively, ECV can then be estimated with the formula:ECV ¼
D
R1tD
R1b,ð1HctÞ
It is important to note that ECV as measured by pre- and post-contrast T1 imaging is to be interpreted as a volume fraction, not an absolute measure of the total ECV. In healthy volunteers, the normal range of ECV depends on age. In 1 study investigating the association between age and ECV, it averaged 0.25 0.02 in volunteers <40 years of age versus 0.320.20 in those>60 years of age(24).
Measuring ECV is particularly valuable in diseases producing diffuse interstitial remodeling and expan-sion, such as through diffusefibrosis in hypertensive disease, or ECV expansion in remote myocardium after MI.
APPLICATIONS OF T1-MAPPING AND ECV QUANTIFICATION
Previous histological studies in humans have
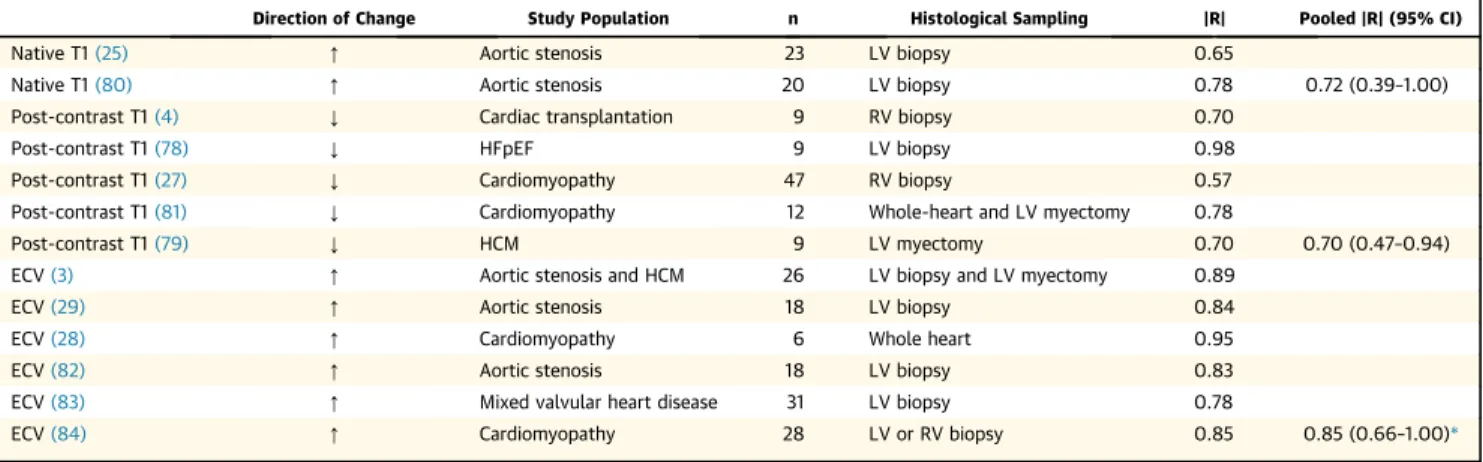
reported a consistent relationship between a variety of T1-based indices (native T1, post-contrast T1, and ECV) and the extent of diffuse myocardial fibrosis, with no significant difference between the pooled correlation coefficients of the various in-dices(3,4,25–29) (Table 2).
Due to the rapidly developing nature of thefield of T1 mapping, pathophysiological studies have used not only a range of T1-based indices but also a range of T1-mapping sequences. One important distinction, however, is that although both ECV and post-contrast T1 are predominantly reflective of changes in the extracellular space, the signal for noncontrast T1 time depends on intracellular as well as extracellular/ interstitial factors. Although this factor is an impor-tant consideration when comparing findings across
studies, it also adds to the utility of T1 mapping in evaluating cardiac pathology, with a number of non-contrast T1-mapping studies highlighting the role of myocardial edema in inflammatory conditions of the myocardium.
ECV, by being defined as a coefficient of R1 changes in tissue and blood, eliminates some potentially con-founding effects on post-contrast T1 measurements, such as variations in clearance of contrast from blood, differences between contrast agent relaxivity, and even magneticfield strength. For these reasons, it may be possible to define a normal range for ECV in healthy volunteers. Nevertheless, enough time must pass after a contrast injection to allow the contrast to reach equilibrium between blood and tissue(5).
AORTIC VALVE DISEASE AND HYPERTENSIVE HEART DISEASE. One of thefirst applications of T1 mapping in the heart found that post-contrast T1 was decreased in patients with chronic aortic regurgita-tion(30). The shortened post-contrast myocardial T1 in patients was interpreted as a sign of increased up-take of contrast due to a“diffuse myocardialfibrotic process.”A later study validated ECV as a surrogate marker of fibrosis in aortic stenosis by comparing it with the collagen volume fraction in endomyo-cardial biopsy samples (3). In patients with severe aortic stenosis, aortic valve replacement resulted in regression of left ventricular (LV) hypertrophy but not ECV (31). Although this outcome would suggest that the absolute intracellular volume (represented by the product of [1ECV] and LV mass) decreased in proportion with the regression of LV hypertrophy, it is unlikely that the decrease of the absolute ECV, given by ECVLV mass, reflects a decrease offibrosis burden. However, in a separate study (32), blood pressure reduction after renal denervation was asso-ciated with a significant reduction in both LV mass and the T1 partition coefficient, a reasonable surro-gate of ECV if we assume that the blood hematocrit is not affected by the treatment; this outcome suggests that, under some circumstances, T1-based indices may parallel reverse cardiac remodeling.
In patients suspected of having myocardialfibrosis secondary to aortic stenosis (results validated by bi-opsyfindings), native T1 was elevated and correlated with diffuse fibrosis (25) (Figure 4A). Whether the change in native T1, and more specifically an increase in native T1, is a reflection of the myocardialfibrosis burden, or instead a result of other pathological features (e.g., edema) that occur in parallel remains to be ascertained. In this context, it is also useful to note that any signal from 1H nuclei in the collagen fibers is beyond the detection limit of most currently
used T1-mapping sequences because of its very short T2 (<1 ms).
An expansion of the extracellular space in pressure overload from systemic hypertension has also been demonstrated in both animal models (33,34)and in patients(35,36), with changes in ECV mirroring the degree of LV hypertrophy.
MYOCARDIAL INFARCTION. Native T1 mapping has been used in the assessment of acute MI on the basis that interstitial edema(37)is increased at the site of infarction (Figure 4B). Studies have shown that T1 mapping has the capability to accurately identify territories of myocardial edema with higher
diag-nostic accuracy than T2-based methods. This
approach has also been used to explore opportunities to define the at-risk area. Moreover, recent evidence suggests that the hypointense core in T1 maps of acute MI correlates with adverse outcomes (38), similar to what has been observed for microvascular obstruction detected by LGE imaging.
In chronic infarction, ECV expansion within the infarct territory has been shown to be due to re-placementfibrosis in regions once densely populated with cells and blood vessels (23,39). The traditional paradigm of ventricular remodeling occurring pre-dominantly in response to chronic hemodynamic forces after MI has also been challenged by studies demonstrating abnormal native and post-contrast CENTRAL ILLUSTRATION Pre- and Post-Contrast Myocardial T1s
Myocardial T1 mapping is sensitive to changes in tissue structure and composition. The native myocardial T1 (i.e., measured without giving contrast) becomes longer with an increase of mobile water species, and/or interstitial deposition of collagen, or amyloid protein, as illustrated by the native T1 data points in thelower left corner
of the illustration. If T1 mapping is performed beforeandafter contrast administration, one can relate the changes of 1/T1 in myocardium, to the corresponding change of 1/T1 in blood to determine the so- called myocardial tissue partition coefficient for an extracellular gadolinium contrast agent. (1/T1 rather than T1 is pro-portional to contrast concentration.) The partition coefficient corresponds to the slope of the line going through the measured values of 1/T1. The slope increases as a result of the expansion of the extracellular volume, e.g., as a result of diffuse interstitialfibrosis. The slope generally changes much less as a result of edema, and the native T1 is therefore more widely used to detect edema.
myocardial T1 in the myocardium remote from the area of infarction occurring within days of the MI
(40,41). Importantly, these early remote zone chan-ges were associated with both acute inflammatory factors and adverse LV remodeling 6 months post-MI, suggesting an early remodeling signal that may be driven, in part, by local/paracrine factors in addi-tion to longer term hemodynamic load. ECV expan-sion in remote myocardium within months after MI, likely from diffuse fibrosis related to remodeling, has also been demonstrated(39). Moreover, native T1 mapping has been used to characterize chronic MI
(42,43). These studies, performed at 3-T to improve the low sensitivity of the same approach previously explored at 1.5-T(44), have shown very good agree-ment with LGE CMR (Figure 4C).
CARDIOMYOPATHY. Early studies found shortened post-contrast T1 times in nonischemic cardiomyopa-thy as well as ischemic cardiomyopacardiomyopa-thy(4,27), even when areas of LGE were excluded; these findings are consistent with data from autopsy studies(45,46). Subsequently, shortened post-contrast T1 times as well as increased ECV have been consistently demonstrated in patients with hypertrophic cardio-myopathy (HCM)(47,48), which is again reflective of the myocardial disarray and interstitialfibrosis noted at autopsy (49). Additional studies have examined the interaction between genotypic and phenotypic expression in HCM, with expansion of ECV reported in patients who are gene-positive but phenotype-negative for HCM (48). This finding suggests that subclinical myocardial changes may precede the
progression of HCM in gene-positive patients.
Furthermore, comparison of patients with HCM based on the presence or absence of a recognized HCM gene
revealed differences between the 2 groups with respect to the extent of interstitialfibrosis as well as symptoms of breathlessness (26), underscoring the heterogeneous nature of this disease.
Several other studies have shown that ECV is increased in various nonischemic cardiomyopathies (dilated [5], hypertrophic [3], and restrictive [50]) and diabetes (51) from diffuse fibrosis. One study in dilated cardiomyopathy (5)showed a strong cor-relation between resting myocardial perfusion, normalized by the rate pressure product, and ECV. Possible reasons for such an association could be perivascularfibrosis and/or a reduced capillary den-sity. Importantly, elevated ECV is independently associated with a higher rate of short-term mortality
(51), with simultaneous adjustment for age, LV ejec-tion fracejec-tion, and MI size. Thesefindings support the notion that ECV measurement may represent an important marker for diseased myocardium in car-diomyopathy and thus serve as a potential focus for future interventional studies.
Given that abnormalities in T1-mapping indices suggest subclinical myocardial disease across a range of conditions, it has been proposed that T1 mapping could be a useful discriminator between healthy and diffusely diseased myocardium in more common forms of cardiomyopathy. When non-contrast T1, post-contrast T1, and ECV were compared between patients with cardiomyopathy (HCM or nonischemic cardio-myopathy) and healthy subjects (52), all T1-based indices proved highly accurate; however, the non-contrast T1 time exhibited the greatest discriminatory power, with a diagnostic accuracy of 98%.
CARDIAC AMYLOIDOSIS.Cardiac involvement with both wild-type and mutant transthyretin amyloidosis TABLE 2 Histological Validation of In Vivo Human T1-Mapping Indices of Diffuse Myocardial Fibrosis
Direction of Change Study Population n Histological Sampling |R| Pooled |R| (95% CI)
Native T1(25) [ Aortic stenosis 23 LV biopsy 0.65
Native T1(80) [ Aortic stenosis 20 LV biopsy 0.78 0.72 (0.39–1.00)
Post-contrast T1(4) Y Cardiac transplantation 9 RV biopsy 0.70
Post-contrast T1(78) Y HFpEF 9 LV biopsy 0.98
Post-contrast T1(27) Y Cardiomyopathy 47 RV biopsy 0.57
Post-contrast T1(81) Y Cardiomyopathy 12 Whole-heart and LV myectomy 0.78
Post-contrast T1(79) Y HCM 9 LV myectomy 0.70 0.70 (0.47–0.94)
ECV(3) [ Aortic stenosis and HCM 26 LV biopsy and LV myectomy 0.89
ECV(29) [ Aortic stenosis 18 LV biopsy 0.84
ECV(28) [ Cardiomyopathy 6 Whole heart 0.95
ECV(82) [ Aortic stenosis 18 LV biopsy 0.83
ECV(83) [ Mixed valvular heart disease 31 LV biopsy 0.78
ECV(84) [ Cardiomyopathy 28 LV or RV biopsy 0.85 0.85 (0.66–1.00)*
*p¼NS for comparison across pooled correlation coefficient (absolute) |R| values.
CI¼confidence interval; ECV¼extracellular volume; HCM¼hypertrophic cardiomyopathy; HFpEF¼heart failure with preserved ejection fraction; LV¼left ventricular; RV¼right ventricular; T1¼time constant for recovery of longitudinal magnetization.
is associated with an expansion of the extracellular space due to interstitial deposition of amyloid pro-tein. T1 mapping and ECV quantification are well suited to assess myocardial tissue remodeling in these patients (53–55). Although LGE is a frequent finding in cardiac amyloidosis, it is mostly diffuse in appearance, and the CMR investigator is frequently faced with difficulties in determining an optimal setting for the T1 weighting to bring out LGE(56). ECV expansion in cardiac amyloidosis reaches extremely high values (on the order of 0.5 to 0.6)(53–55). The myocardial amyloid load also has a relatively strong
effect on native T1(54), which extends the utility of T1 mapping to patients with contraindications to contrast. The usefulness of T1 mapping for assess-ment of the amyloid burden has prompted its use as a biomarker in recent therapeutic trials.
Changes in T1 mapping indices are also useful in the identification of subclinical myocardial involve-ment in Fabry disease (57), systemic lupus erythe-matosus (58), rheumatoid arthritis, and systemic sclerosis(59), in which these indices are suggestive of subclinical myocardial infiltration, inflammation, and/or interstitial fibrosis in patients with no overt FIGURE 4 Applications of Noncontrast T1 Mapping
(A)Diffusefibrosis(25): T1 maps from a normal control and diffuse changes in myocardial T1 in a patient with moderate aortic stenosis (AS) and severe AS shown. The observed global myocardial T1 measurements were: normal control, 944 ms; moderate AS, 951 ms; and severe AS, 1,020 ms.(B)Edema(37): A 46-year-old man with inferior wall acute myocardial infarction (MI) confirmed by using late gadolinium enhancement (LGE) imaging with a noncontrast T1 map (showing edema in territories of LGE leading to an increase in native T1 value byw30% relative to the remote myocardium [1,539132 ms vs. 1,17230 ms]).(C)Replacementfibrosis (43): LGE images and noncontrast T1 maps at 3-T from a patient with ST-segment elevation myocardial infarction are shown. MI was identified on both LGE and T1 maps (processed images using mean5 SD criterion). The corresponding bull’s-eye plots depicting the size and transmurality of the MI are shown for both LGE and T1. Good agreement between LGE and T1 maps (for location, spatial extent, and transmurality) was evident.(D)Myocardial inflammation(63): A 51-year-old patient with myocarditis (on admission with elevated T1) and at 6-month follow-up (with T1 returned to normal values) are shown along with the hematoxylin and eosin (H&E) stain of endomyocardial biopsy section(on right)with aggregated lymphocytes adherent to cardiomyocytes.(E)Myocardial iron overload(69): healthy(a); and mild, moderate, and severe(b-d)cases of iron overloading are shown. The extent of iron overloading visualized as decrease in T1 (towardbluecolor for highest iron overload) is shown.
evidence of cardiac disease. Increased ECV has also been reported in patients exposed to anthracycline-based chemotherapy (60), implying that subtle changes in myocardial structure may occur before the development of systolic dysfunction.
MYOCARDITIS. As discussed earlier, T1 maps have been shown to be sensitive to myocardial infl amma-tion. The pattern of T1 enhancements has been used to identify location and extent of inflammation in patients with myocarditis(61,62). Results of biopsy studies have shown that these regions are sites of active inflammation, with aggregated lymphocytes adhering to cardiomyocytes(63) (Figure 4D). None-theless, the source of image contrast remains
un-clear but is likely from edema secondary to
inflammation. Other studies have found evidence of an association between elevated blood markers of acute inflammation with a mean native T1 elevation of w10 ms in the remote myocardium (41). These changes were correlated with adverse LV remodel-ing in the post-MI period; however, the mechanism of T1 elevation in the remote myocardium has not been established(64).
IRON STORAGE DISEASE.Although T2* mapping is the gold standard for detecting chronic (65) or regional (66) iron deposition, imaging artifacts from field inhomogeneities remain a key obstacle. This is especially problematic when T2* mapping has to be performed with long echo times to increase the sensitivity for detecting conditions of mild iron overload. Because iron deposits can impart a
para-magnetic influence on the magnetic resonance
signal, the concentration of iron is typically inversely related to T1 at sufficiently low concentrations(67). Recent studies have shown that when the iron overloading in the heart is mild, T1 mapping can be used to improve the reproducibility for imaging chronic iron deposition over T2*-based methods
(68,69), as illustrated in Figure 4E. However, T1-based methods for imaging iron overloading remain to be validated(70).
INTERSTITIAL FIBROSIS AND CARDIAC DYSFUNCTION
A key feature of T1-mapping research has been demonstration of the association between abnor-mal T1-mapping indices and cardiac dysfunction. Increased ECV in patients with nonischemic cardio-myopathy has been correlated with reduced LV ejec-tion fracejec-tion as well as reduced myocardial bloodflow
(5). In addition, T1-based indices have been corre-lated with reduced myocardial systolic strain in systemic lupus erythematosus (58), rheumatoid
arthritis (71), cardiac amyloidosis (54,55,72), HCM
(35), and diabetes (73,74). Furthermore, in patients with established cardiomyopathy, shortened post-contrast T1 times (reflective of greater degrees of interstitialfibrosis) are associated with more severe grades of diastolic dysfunction(4,27).
Given that heart failure with preserved ejection fraction (HFpEF) may account for up to 50% of all cases of heart failure(75), and because limited treat-ment is available for this condition (76), a greater understanding of the pathophysiology of HFpEF obtained through T1-mapping research has the po-tential to drive the development of more effective therapies. Abnormal T1-based indices have been correlated with increased ventricularfilling pressure measured noninvasively with echocardiography in a variety of conditions, including HCM(47,48), cardiac amyloidosis(72), and in early diabetic cardiomyopa-thy (74). These observations suggest that diffuse fibrosis may play an important role in the patho-physiology of diastolic dysfunction leading to HFpEF, a notion that is supported by T1-mapping studies focusing on this patient group. Increased ECV has previously been shown to correlate with impaired diastolic function in patients with HFpEF but not systolic heart failure (77), suggesting a more pre-dominant role for interstitial fibrosis in diastolic dysfunction. In addition, shortened post-contrast T1 times occur in patients with HFpEF (78); these shortened times were also associated with elevated pulmonary vascular resistance and reduced right ventricular function. Importantly, utilizing invasive pressure volume loop measurement in heart trans-plant recipients, both post-contrast T1 time and ECV significantly correlated with the myocardial stiffness constant
b
(79), suggesting a mechanistic link be-tween diffuse myocardial fibrosis and cardiac stiff-ness, a putative mechanism for diastolic dysfunction and HFpEF.CONCLUSIONS
The advent of T1-mapping techniques has enabled the noninvasive characterization of the myocardium to a level that was previously only possible with invasive procedures such as cardiac biopsy. Myo-cardial abnormalities, particularly those of the interstitium, have been identified across a broad range of cardiac disease and in selected disease states (e.g., amyloidosis, Fabry disease) T1 mapping is already proving useful in clinical diagnosis. Although differences undoubtedly exist between the various T1-mapping indices and the CMR se-quences from which they are derived, we can be
reassured by the remarkably consistent findings throughout the literature regardless of the T1 index or sequence used.
ACKNOWLEDGMENTSThe authors thank Dr. Kelvin Chow for his assistance in generatingFigures 2 and 3.
REPRINT REQUESTS AND CORRESPONDENCE: Dr. Michael Jerosch-Herold, Brigham & Women’s Hospi-tal, 75 Francis Street, Boston, Massachusetts 02115. E-mail:[email protected].
R E F E R E N C E S
1.Broberg CS, Chugh SS, Conklin C, Sahn DJ, Jerosch-Herold M. Quantification of diffuse myocardial fibrosis and its association with myocardial dysfunction in congenital heart dis-ease. Circ Cardiovasc Imaging 2010;3:727–34.
2.Flacke S, Allen JS, Chia JM, et al. Characteriza-tion of viable and nonviable myocardium at MR imaging: comparison of gadolinium-based extra-cellular and blood pool contrast materials versus manganese-based contrast materials in a rat myocardial infarction model. Radiology 2003;226: 731–8.
3.Flett AS, Hayward MP, Ashworth MT, et al. Equilibrium contrast cardiovascular magnetic resonance for the measurement of diffuse myocardial fibrosis: preliminary validation in humans. Circulation 2010;122:138–44.
4.Iles L, Pfluger H, Phrommintikul A, et al. Eval-uation of diffuse myocardial fibrosis in heart failure with cardiac magnetic resonance contrast-enhanced T1 mapping. J Am Coll Cardiol 2008; 52:1574–80.
5.Jerosch-Herold M, Sheridan DC, Kushner JD, et al. Cardiac magnetic resonance imaging of myocardial contrast uptake and bloodflow in pa-tients affected with idiopathic or familial dilated cardiomyopathy. Am J Physiol Heart Circ Physiol 2008;295:H1234–42.
6.Klein C, Nekolla SG, Balbach T, et al. The in-fluence of myocardial bloodflow and volume of distribution on late Gd-DTPA kinetics in ischemic heart failure. J Magn Reson Imaging 2004;20: 588–93.
7.Moon JC, Messroghli DR, Kellman P, et al. Myocardial T1 mapping and extracellular volume quantification: a Society for Cardiovascular Mag-netic Resonance (SCMR) and CMR Working Group of the European Society of Cardiology consensus statement. J Cardiovasc Magn Reson 2013;15:92.
8.Kellman P, Wilson JR, Xue H, Ugander M, Arai AE. Extracellular volume fraction mapping in the myocardium, part 1: evaluation of an auto-mated method. J Cardiovasc Magn Reson 2012; 14:63.
9.Salerno M, Janardhanan R, Jiji RS, et al. Com-parison of methods for determining the partition coefficient of gadolinium in the myocardium using T1 mapping. J Magn Reson Imaging 2013;38: 217–24.
10.Nacif MS, Turkbey EB, Gai N, et al. Myocardial T1 mapping with MRI: comparison of look-locker and MOLLI sequences. J Magn Reson Imaging 2011;34:1367–73.
11.Flacke SJ, Fischer SE, Lorenz CH. Measurement of the gadopentetate dimeglumine partition co-efficient in human myocardium in vivo: normal
distribution and elevation in acute and chronic infarction. Radiology 2001;218:703–10.
12.Messroghli DR, Radjenovic A, Kozerke S, Higgins DM, Sivananthan MU, Ridgway JP. Modi-fied Look-Locker inversion recovery (MOLLI) for high-resolution T1 mapping of the heart. Magn Reson Med 2004;52:141–6.
13.Messroghli DR, Greiser A, Frohlich M, Dietz R, Schulz-Menger J. Optimization and validation of a fully-integrated pulse sequence for modified Look-Locker inversion-recovery (MOLLI) T1 map-ping of the heart. J Magn Reson Imaging 2007;26: 1081–6.
14.Schelbert EB, Testa SM, Meier CG, et al. Myocardial extravascular extracellular volume fraction measurement by gadolinium cardiovas-cular magnetic resonance in humans: slow infusion versus bolus. J Cardiovasc Magn Reson 2011;13:16.
15.Piechnik SK, Ferreira VM, Dall’Armellina E, et al. Shortened modified Look-Locker inversion recovery (ShMOLLI) for clinical myocardial T1-mapping at 1.5 and 3 T within a 9 heartbeat breathhold. J Cardiovasc Magn Reson 2010;12:69.
16.Schmitt P, Griswold MA, Jakob PM, et al. Inversion recovery TrueFISP: quantification of T(1), T(2), and spin density. Magn Reson Med 2004;51: 661–7.
17.Robson MD, Piechnik SK, Tunnicliffe EM, Neubauer S. T1 measurements in the human myocardium: the effects of magnetization transfer on the SASHA and MOLLI sequences. Magn Reson Med 2013;70:664–70.
18.Higgins DM, Ridgway JP, Radjenovic A, Sivananthan UM, Smith MA. T1 measurement using a short acquisition period for quantitative cardiac applications. Med Phys 2005;32:1738–46.
19.Chow K, Flewitt JA, Green JD, Pagano JJ, Friedrich MG, Thompson RB. Saturation recovery single-shot acquisition (SASHA) for myocardial T(1) mapping. Magn Reson Med 2014;71:2082–95.
20.Fitts M, Breton E, Kholmovski EG, et al. Arrhythmia insensitive rapid cardiac T1 mapping pulse sequence. Magn Reson Med 2013;70: 1274–82.
21.Song T, Stainsby JA, Ho VB, Hood MN, Slavin GS. Flexible cardiac T1 mapping using a modified Look-Locker acquisition with saturation recovery. Magn Reson Med 2012;67:622–7.
22.Roujol S, Weingartner S, Foppa M, et al. Ac-curacy, precision, and reproducibility of four T1 mapping sequences: a head-to-head comparison of MOLLI, ShMOLLI, SASHA, and SAPPHIRE. Radiology 2014;272:683–9.
23.Arheden H, Saeed M, Higgins CB, et al. Mea-surement of the distribution volume of gado-pentetate dimeglumine at echo-planar MR
imaging to quantify myocardial infarction: com-parison with 99mTc-DTPA autoradiography in rats. Radiology 1999;211:698–708.
24.Neilan TG, Coelho-Filho OR, Shah RV, et al. Myocardial extracellular volume fraction from T1 measurements in healthy volunteers and mice: relationship to aging and cardiac dimensions. J Am Coll Cardiol Img 2013;6:672–83.
25.Bull S, White SK, Piechnik SK, et al. Human non-contrast T1 values and correlation with his-tology in diffusefibrosis. Heart 2013;99:932–7.
26.Ellims AH, Iles LM, Ling LH, et al. A comprehensive evaluation of myocardialfibrosis in hypertrophic cardiomyopathy with cardiac magnetic resonance imaging: linking genotype withfibrotic phenotype. Eur Heart J Cardiovasc Imaging 2014;15:1108–16.
27.Sibley CT, Noureldin RA, Gai N, et al. T1 map-ping in cardiomyopathy at cardiac MR: comparison with endomyocardial biopsy. Radiology 2012;265: 724–32.
28.Miller CA, Naish J, Bishop P, et al. Compre-hensive validation of cardiovascular magnetic resonance techniques for the assessment of myocardial extracellular volume. Circ Cardiovasc Imaging 2013;6:373–83.
29.White SK, Sado DM, Fontana M, et al. T1 mapping for myocardial extracellular volume measurement by CMR: bolus only versus primed infusion technique. J Am Coll Cardiol Img 2013;6: 955–62.
30.Sparrow P, Messroghli DR, Reid S, Ridgway JP, Bainbridge G, Sivananthan MU. Myocardial T1 mapping for detection of left ventricular myocar-dialfibrosis in chronic aortic regurgitation: pilot study. Am J Roentgenol 2006;187:W630–5.
31.Flett AS, Sado DM, Quarta G, et al. Diffuse myocardialfibrosis in severe aortic stenosis: an equilibrium contrast cardiovascular magnetic resonance study. Eur Heart J Cardiovasc Imaging 2012;13:819–26.
32.McLellan AJ, Schlaich MP, Taylor AJ, et al. Reverse cardiac remodeling after renal denerva-tion: atrial electrophysiologic and structural changes associated with blood pressure lowering. Heart Rhythm 2015;12:982–90.
33.Messroghli DR, Nordmeyer S, Dietrich T, et al. Assessment of diffuse myocardialfibrosis in rats using small-animal Look-Locker inversion recovery T1 mapping. Circ Cardiovasc Imaging 2011;4: 636–40.
34.Coelho-Filho OR, Shah RV, Neilan TG, et al. Cardiac magnetic resonance assessment of inter-stitial myocardialfibrosis and cardiomyocyte hy-pertrophy in hypertensive mice treated with
spironolactone. J Am Heart Assoc 2014;3: e000790.
35.Kuruvilla S, Janardhanan R, Antkowiak P, et al. Increased extracellular volume and altered me-chanics are associated with LVH in hypertensive heart disease, not hypertension alone. J Am Coll Cardiol Img 2015;8:172–80.
36.Treibel TA, Zemrak F, Sado DM, et al. Extracellular volume quantification in isolated hypertension—changes at the detectable limits? J Cardiovasc Magn Reson 2015;17:74.
37.Ferreira VM, Piechnik SK, Dall’Armellina E, et al. Non-contrast T1-mapping detects acute myocardial edema with high diagnostic accuracy: a comparison to T2-weighted cardiovascular mag-netic resonance. J Cardiovasc Magn Reson 2012; 14:42.
38.Carrick D, Haig C, Rauhalammi S, et al. Prog-nostic significance of infarct core pathology revealed by quantitative non-contrast in compar-ison with contrast cardiac magnetic resonance imaging in reperfused ST-elevation myocardial infarction survivors. Eur Heart J 2015 Aug 10 [E-pub ahead of print].
39.Ugander M, Oki AJ, Hsu LY, et al. Extracellular volume imaging by magnetic resonance imaging provides insights into overt and sub-clinical myocardial pathology. Eur Heart J 2012;33: 1268–78.
40.Chan W, Duffy SJ, White DA, et al. Acute left ventricular remodeling following myocardial infarction: coupling of regional healing with remote extracellular matrix expansion. J Am Coll Cardiol Img 2012;5:884–93.
41.Carrick D, Haig C, Rauhalammi S, et al. Path-ophysiology of LV remodeling in survivors of STEMI: inflammation, remote myocardium, and prognosis. J Am Coll Cardiol Img 2015;8:779–89.
42.Kali A, Cokic I, Tang RL, et al. Determination of location, size, and transmurality of chronic myocardial infarction without exogenous contrast media by using cardiac magnetic resonance im-aging at 3 T. Circ Cardiovasc Imim-aging 2014;7: 471–81.
43.Kali A, Choi EY, Sharif B, et al. Native T1 mapping by 3-T CMR imaging for characterization of chronic myocardial infarctions. J Am Coll Car-diol Img 2015;8:1019–30.
44.Messroghli DR, Walters K, Plein S, et al. Myocardial T1 mapping: application to patients with acute and chronic myocardial infarction. Magn Reson Med 2007;58:34–40.
45.Heling A, Zimmermann R, Kostin S, et al. Increased expression of cytoskeletal, linkage, and extracellular proteins in failing human myocar-dium. Circ Res 2000;86:846–53.
46.Beltrami CA, Finato N, Rocco M, et al. The cellular basis of dilated cardiomyopathy in humans. J Mol Cell Cardiol 1995;27:291–305.
47.Ellims AH, Iles LM, Ling LH, Hare JL, Kaye DM, Taylor AJ. Diffuse myocardialfibrosis in hyper-trophic cardiomyopathy can be identified by car-diovascular magnetic resonance, and is associated with left ventricular diastolic dysfunction. J Cardiovasc Magn Reson 2012;14:76.
48.Ho CY, Abbasi SA, Neilan TG, et al. T1 mea-surements identify extracellular volume expansion in hypertrophic cardiomyopathy sarcomere muta-tion carriers with and without left ventricular hy-pertrophy. Circ Cardiovasc Imaging 2013;6:415–22.
49.Moon JC, Reed E, Sheppard MN, et al. The histologic basis of late gadolinium enhancement cardiovascular magnetic resonance in hypertrophic cardiomyopathy. J Am Coll Cardiol 2004;43: 2260–4.
50.Banypersad SM, Fontana M, Maestrini V, et al. T1 mapping and survival in systemic light-chain amyloidosis. Eur Heart J 2015;36:244–51.
51.Wong TC, Piehler K, Meier CG, et al. Associa-tion between extracellular matrix expansion quantified by cardiovascular magnetic resonance and short-term mortality. Circulation 2012;126: 1206–16.
52.Puntmann VO, Voigt T, Chen Z, et al. Native T1 mapping in differentiation of normal myocardium from diffuse disease in hypertrophic and dilated cardiomyopathy. J Am Coll Cardiol Img 2013;6: 475–84.
53.Banypersad SM, Sado DM, Flett AS, et al. Quantification of myocardial extracellular volume fraction in systemic AL amyloidosis: an equilibrium contrast cardiovascular magnetic resonance study. Circ Cardiovasc Imaging 2013;6:34–9.
54.Brooks J, Kramer CM, Salerno M. Markedly increased volume of distribution of gadolinium in cardiac amyloidosis demonstrated by T1 mapping. J Magn Reson Imaging 2013;38:1591–5.
55.Mongeon FP, Jerosch-Herold M, Coelho-Filho OR, Blankstein R, Falk RH, Kwong RY. Quantification of extracellular matrix expansion by CMR in infiltrative heart disease. J Am Coll Cardiol Img 2012;5:897–907.
56.White JA, Kim HW, Shah D, et al. CMR imaging with rapid visual T1 assessment predicts mortality in patients suspected of cardiac amyloidosis. J Am Coll Cardiol Img 2014;7:143–56.
57.Pica S, Sado DM, Maestrini V, et al. Repro-ducibility of native myocardial T1 mapping in the assessment of Fabry disease and its role in early detection of cardiac involvement by cardiovascular magnetic resonance. J Cardiovasc Magn Reson 2014;16:99.
58.Puntmann VO, D’Cruz D, Smith Z, et al. Native myocardial T1 mapping by cardiovascular mag-netic resonance imaging in subclinical cardiomy-opathy in patients with systemic lupus erythematosus. Circ Cardiovasc Imaging 2013;6: 295–301.
59.Barison A, Gargani L, De Marchi D, et al. Early myocardial and skeletal muscle interstitial remodelling in systemic sclerosis: insights from extracellular volume quantification using cardio-vascular magnetic resonance. Eur Heart J Car-diovasc Imaging 2015;16:74–80.
60.Neilan TG, Coelho-Filho OR, Shah RV, et al. Myocardial extracellular volume by cardiac mag-netic resonance imaging in patients treated with anthracycline-based chemotherapy. Am J Cardiol 2013;111:717–22.
61.Hinojar R, Foote L, Arroyo Ucar E, et al. Native T1 in discrimination of acute and
convalescent stages in patients with clinical dia-gnosis of myocarditis: a proposed diagnostic al-gorithm using CMR. J Am Coll Cardiol Img 2015;8: 37–46.
62.Ferreira VM, Piechnik SK, Dall’Armellina E, et al. Native T1-mapping detects the location, extent and patterns of acute myocarditis without the need for gadolinium contrast agents. J Cardiovasc Magn Reson 2014;16:36.
63.Biesbroek PS, Beek AM, Niessen HW, van Rossum AC. T1-mapping in a case of acute biopsy-proven myocarditis with an apparently normal CMR:’times are a-changing’. Eur Heart J 2015 Jul 18 [E-pub ahead of print].
64.Taylor AJ, Chan W. Post-infarction LV remodeling remote changes do not necessarily occur remotely from time of infarction. J Am Coll Cardiol Img 2015;8:790–2.
65.Carpenter JP, He T, Kirk P, et al. On T2* magnetic resonance and cardiac iron. Circulation 2011;123:1519–28.
66.Kali A, Kumar A, Cokic I, et al. Chronic mani-festation of postreperfusion intramyocardial hemorrhage as regional iron deposition: a cardio-vascular magnetic resonance study with ex vivo validation. Circ Cardiovasc Imaging 2013;6: 218–28.
67.Bjornerud A, Johansson LO, Briley-Saebo K, Ahlstrom HK. Assessment of T1 and T2* effects in vivo and ex vivo using iron oxide nanoparticles in steady state—dependence on blood volume and water exchange. Magn Reson Med 2002;47: 461–71.
68.Carpenter JP, He T, Kirk P, et al. Calibration of myocardial T2 and T1 against iron concentration. J Cardiovasc Magn Reson 2014;16:62.
69.Sado DM, Maestrini V, Piechnik SK, et al. Noncontrast myocardial T1 mapping using cardio-vascular magnetic resonance for iron overload. J Magn Reson Imaging 2015;41:1505–11.
70.Feng Y, He T, Carpenter JP, et al. In vivo comparison of myocardial T1 with T2 and T2* in thalassaemia major. J Magn Reson Imaging 2013; 38:588–93.
71.Ntusi NA, Piechnik SK, Francis JM, et al. Diffuse myocardialfibrosis and inflammation in rheuma-toid arthritis: insights from CMR T1 mapping. J Am Coll Cardiol Img 2015;8:526–36.
72.Karamitsos TD, Piechnik SK, Banypersad SM, et al. Noncontrast T1 mapping for the diagnosis of cardiac amyloidosis. J Am Coll Cardiol Img 2013;6: 488–97.
73.Ng AC, Auger D, Delgado V, et al. Association between diffuse myocardial fibrosis by cardiac magnetic resonance contrast-enhanced T(1) map-ping and subclinical myocardial dysfunction in diabetic patients: a pilot study. Circ Cardiovasc Imaging 2012;5:51–9.
74.Jellis C, Wright J, Kennedy D, et al. Association of imaging markers of myocardialfibrosis with metabolic and functional disturbances in early diabetic cardiomyopathy. Circ Cardiovasc Imaging 2011;4:693–702.
75.Owan TE, Hodge DO, Herges RM, Jacobsen SJ, Roger VL, Redfield MM. Trends in prevalence and
outcome of heart failure with preserved ejection fraction. N Engl J Med 2006;355:251–9.
76.Maeder MT, Kaye DM. Heart failure with normal left ventricular ejection fraction. J Am Coll Cardiol 2009;53:905–18.
77.Su MY, Lin LY, Tseng YH, et al. CMR-verified diffuse myocardialfibrosis is associated with dia-stolic dysfunction in HFpEF. J Am Coll Cardiol Img 2014;7:991–7.
78.Mascherbauer J, Marzluf BA, Tufaro C, et al. Cardiac magnetic resonance postcontrast T1 time is associated with outcome in patients with heart failure and preserved ejection fraction. Circ Car-diovasc Imaging 2013;6:1056–65.
79.Ellims AH, Shaw JA, Stub D, et al. Diffuse myocardialfibrosis evaluated by post-contrast t1 mapping correlates with left ventricular stiffness. J Am Coll Cardiol 2014;63:1112–8.
80.Lee SP, Lee W, Lee JM, et al. Assessment of diffuse myocardialfibrosis by using MR imaging in asymptomatic patients with aortic stenosis. Radi-ology 2015;274:359–69.
81.Iles LM, Ellims AH, Llewellyn H, et al. Histo-logical validation of cardiac magnetic resonance analysis of regional and diffuse interstitial myocardialfibrosis. Eur Heart J Cardiovasc Imag-ing 2015;16:14–22.
82.Fontana M, White SK, Banypersad SM, et al. Comparison of T1 mapping techniques for ECV quantification. Histological valida-tion and reproducibility of ShMOLLI versus multibreath-hold T1 quantification equilibrium contrast CMR. J Cardiovasc Magn Reson 2012; 14:88.
83.de Ravenstein CD, Bouzin C, Lazam S, et al. Histological validation of measurement of diffuse
interstitial myocardial fibrosis by myocardial extravascular volume fraction from modified Look-Locker imaging (MOLLI) T1 mapping at 3 T. J Cardiovasc Magn Res 2015;17:48.
84.aus dem Siepen F, Buss SJ, Messroghli D, et al. T1 mapping in dilated cardiomyopathy with car-diac magnetic resonance: quantification of diffuse myocardialfibrosis and comparison with endomyocardial biopsy. Eur Heart J Cardiovasc Imaging 2015;16:210–6.
KEY WORDS fibrosis, interstitium, magnetic resonance imaging, myocardium
Go to http://www.acc.org/jacc-journals-cme to take the CME quiz for this article.