Wizard
Ghislain Auguste Atemezing1, Rapha¨el Troncy1
EURECOM, Campus SophiaTech, France
Abstract. Datasets published in the LOD cloud are recommended to follow some best practices in order to be 4-5 stars Linked Data compli-ant. They can often be consumed and accessed by different means such as API access, bulk download or as linked data fragments, but most of the time, a SPARQL endpoint is also provided. While the LOD cloud keeps growing, having a quick glimpse of those datasets is getting harder and there is a need to develop new methods enabling to detect auto-matically what an arbitrary dataset is about and to recommend visu-alizations for data samples. We consider that “a visualization is worth a million triples”, and in this paper, we propose a novel approach that mines the content of datasets and automatically generates visualizations. Our approach is directly based on the usage of SPARQL queries that will detect the important categories of a dataset and that will specifically con-sider the properties used by the objects which have been interlinked via owl:sameAslinks. We then propose to associate type of visualization for those categories. We have implemented this approach into a so-called Linked Data Vizualization Wizard (LDVizWiz).
Keywords: Visualization, human-machine Interaction, LOD, Consuming Linked Data
1
Introduction
With the growing adoption of the Linked Data principles, there is a real need to support data consumers in quickly getting visualizations that enable to explore a dataset. In order to involve more general Web users into the Semantic Web and Linked Data world, there is a need to build tools that reuse existing visualization libraries showing the key information about RDF datasets. Many datasets are published in SPARQL Endpoints and are not “visually” accessible. Thus, under-standing the underlying graphs and consuming them require lay users to have some knowledge on writing queries.
The object of visualization is to develop insights from collected data. We also know that vision is the sense with largest bandwidth (.e.g: 100 Mb/s). Based on the Visual Information Seeking Mantra:“overview first, zoom and filter, then details on demand”[6], we advocate for a more visual interactive representations of RDF graphs in SPARQL Endpoints. At the same time, we use the term
“Linked Data Visualization”, to refer to a combination of charts, graphics, and other visual elements built on top of 4-5 stars datasets accessible via a SPARQL endpoint.
In this paper, we propose first a step towards making available a semi-automatic way for the production of possible visualization of linked data. set of high level categories grouping objects that are worth viewing and we associate them with some very well-known vocabularies. Then, we describe the implemen-tation of a Linked Data Visualization Wizard and its main components. This wizard can be used to easily visualize slices of datasets based on generic types detected.
The remaining of this paper is structured as follows. We first provide some related work that further motivates this study (Section 2). In Section 3, we propose some important categories that are worth visualizing and we present a set of mapping views associated with vocabularies (Section 4). In Section 5, we describe the implementation of a wizard that can work on top of any RDF dataset. We detail the results of an experiment where high level categories and associated visualizations have been performed on numerous SPARQL endpoints (Section 6). Finally, we conclude and present some future work in the Section 7.
2
Related Work
There are currently many projects aiming at visualizing (RDF) Linked Data. A survey by Dadzie and Rowe [1] concluded by the fact that many visualization tools are not easy to use by lay users. In [2], there is a recent review of some visualizations tools that can be summarized as follows:
– Vocabulary based visualization tools:these tools are built for specific vocab-ularies and that help visualizing data modelled according to those vocabu-laries, such as CubeViz [5], FOAF explorer1 and Map4rdf [3]. They aim at visualizing data modelled respectively withdq,foafandgeo+scovo. – Mashup tools:they are used to create mashups visualizations with different
widgets and some data analysis, such as DERI Pipes [4]. Mashup tools can be integrated to LD wizard to combine different visual views.
– Generic RDF visualization tools: they typically support data browsing and entities rendering. They can also be used to build applications. In this cate-gory, we can mention Graphity2, lodlive3and Balloon Synopsis4.
While these tools are often extensible and support specific domain datasets, they suffer from the following drawbacks:
– They are not easy to set up and use by lay users. Sometimes, users just need to have a visual summary of a dataset in order to start exploring the data. 1 http://foaf-visualizer.gnu.org.ua/ 2 https://github.com/Graphity/graphity-browser 3 http://en.lodlive.it/ 4 https://github.com/schlegel/balloon-synopsis
The LDVizWiz approach is to provide such a lightweight javascript-based tool that supports a quick exploration task.
– They do not make recommendation based on categories. A tool similar to our approach is Facete5[8] which shows a tree-based structure of a dataset
based on some properties of an endpoint more target to geodata. A tabular view enables to visualize slices of data and a map view can be activated when there is geo data. Our approach aims to be more generic, offering more views (tabular, map, graph, charts, etc.) according to a systematic analysis of what are the high level categories present in a dataset.
Regarding wizards tools for visualizing data, similar approaches are available for tools consuming datasets in CSV/TSV. ManyEyes6 is a IBM online tool
that suggest charts according to the columns of a given CSV file. Similarly, Google Charts7 help achieving the same goals for creating embeddable charts by using DSP language in the framework. Datawrapper8 is an open source tool to enable the creation of basic charts originally target to journalists inspired by ManyEyes and Google Charts. All the visualizations are based on the type of the columns/fields of the data. In Linked Data, vocabularies are used for modeling datasets in RDF, thus making difficult to reuse directly those tools. The benefit of our approach is that it constructs specific SPARQL queries to detect the presence or not of predefined specific type of information, yielding to information type-specific visualisations to enable end users to quickly start to explore dataset in a generic manner.
3
Dataset Analysis
When developing an application, there are some “important” classes/categories, objects or datatypes that can be detected first to help guiding in the progress of creating a set of visualizations tied with those categories. We distinguish seven categories while acknowledging that this is not necessary an exhaustive list:
– § [Geographic information]: This category is for data modeled using
geo:SpatialThing, dbpedia-owl:Place, schema:Place or gml:_Feature
classes.
– §[Temporal information]: This category also includes dataset containing date, time (e.g: xsd:dateTime) and period or interval of time, using the OWL Time ontology.
– §[Event information]: This category is for any action of activity occurring at some place at some time.
– §[Agent/Person information]: This category is heavily influenced by the use of foaf:Personorfoaf:Agent.
5 http://cstadler.aksw.org/facete/ 6 http://www-958.ibm.com/software/data/cognos/manyeyes/ 7 https://developers.google.com/chart/ 8 http://datawrapper.de/
– §[Organization information]: This category is related to organizations or companies data, with the use of theorgvocabulary9or thefoaf:Organization
class.
– §[Statistics information]: This category refers to statistical data generally modeled using thedata cubevocabulary10 or the SDMX model11.
– §[Knowledge Classification]: This category refers to dataset describing schemas, classifications or taxonomies using theSKOSvocabulary.
4
Mapping Datatype, Views and Vocabularies
The On-line Library of Information Visualization Environments (OLIVE)12 is
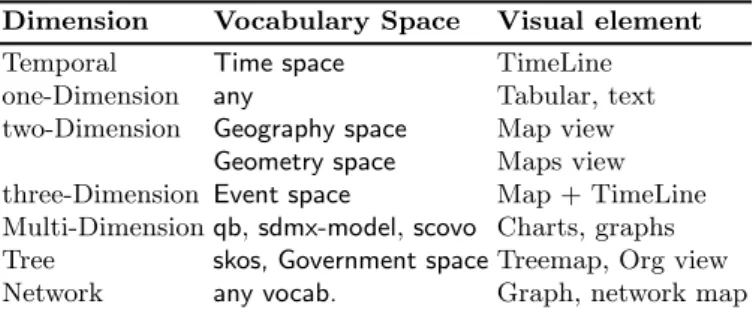
a web site describing eight categories of information visualization environments differentiated by data type and collected by students, following a visualization course given at Maryland College Park, mostly inspired from the work of Ben Shneiderman [6]. Based on the classification provided by OLIVE, we propose a set of mappings between those categories (excluding the workspace dimension), views that can be applied to this category and a suitable list of vocabularies from the Linked Open Vocabularies catalogue that correspond to those categories. Those vocabularies are easy to be found as there is a manual classification of vocabularies by the curators of the catalogue based on the content and scope of the terms and properties. According to the seven categories defined in Section 3, we have identified some of their corresponding one to one mapping with the set of vocabularies:
– Geographyspace, consisting of 21 vocabularies for features: geo, gn, gf,
om,geop,md,lgdo,loc,igeo,osadm,geod,ostop,place,geos,locn,coun,
postcode,osr,geof,g50k andad.
– Geometryspace, for vocabularies dealing with the geometries, mostly com-bined with the features, such as:
– Timespace, consisting of 14 vocabularies, such ascal,date,gts,interval,
ncal,oh,te, thors,ti, time,tl,tm, tvcandtzont.
– Eventspace, containing vocabularies such asevent,lode,music,sem,situ,
sport,stories,theatre,tisandtisc.
– Governmentspace, with 9 vocabularies (cgov, ctorg, elec, few, gc, gd,
oan, odd, parl) and the orgvocabulary belonging to the W3C recommen-dation vocabularies athttp://lov.okfn.org/dataset/lov/lov#W3C. Metadata vocabularies, such asrdfs,dctermsordcecan be used in association with any of the visual element to give basic description of the resource of a giving dimension. For example, a popup information can be fired on a map view to display the relevant information of a geodata resource such as the label, the abstract or description. Another application can be to detect which visualization
9 http://www.w3.org/TR/vocab-org/ 10 http://www.w3.org/TR/vocab-data-cube/ 11http://sdmx.org/ 12 http://lte-projects.umd.edu/Olive/
for geodata. Geodata belongs to a two-Dimension visual representation. Geodata is usually displayed using geographical-based visualizations (map, geo charts, etc.) and it is often modeled by vocabularies in the space namedGeometryand
Geography13 vocabularies in RDF datasets. Hence those vocabularies can be
combined to detect the presence or not of geographic information in a dataset, and thus yield to recommend a map view. Table 1 gives an overview of those mappings. For the tabular representation, it is the “default” visual representation of RDF data and can be used by any vocabulary without restriction.
Dimension Vocabulary Space Visual element Temporal Time space TimeLine one-Dimension any Tabular, text two-Dimension Geography space Map view
Geometry space Maps view three-Dimension Event space Map + TimeLine Multi-Dimensionqb,sdmx-model,scovo Charts, graphs Tree skos, Government spaceTreemap, Org view Network any vocab. Graph, network map
Table 1. A taxonomy of information visualization consuming Linked Datasets with associated views and suitable vocabulary space.
5
LDVizWiz: a Linked Data Visualization Wizard
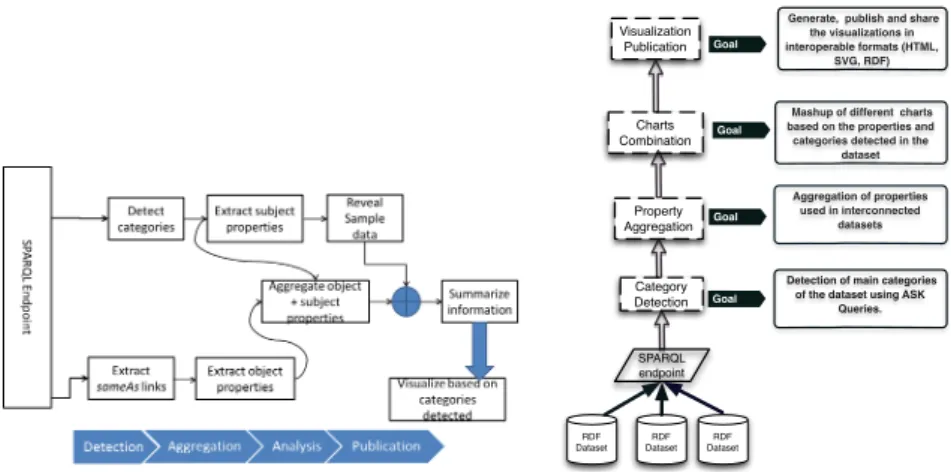
We propose a workflow composed of four principal steps for a Linked Data Visualization Wizard, as depicted in Figure 1. Our requirement is to provide a tool that hide the complexity of SPARQL to lay users and at the same time, can be embedded in existing Linked Data infrastructure and workflow. First, we proposed to detect the presence of data belonging to one of the seven categories (Table 1) using generic SPARQL queries. More precisely, we performASKqueries to test whether or not a particular query pattern has a solution. Second, we look at entities in a dataset that haveowl:sameAslinks with external objects and we retrieve the properties associated to those objects. We argue that the objects that are interlinked with other datasets are of primary importance in a visualization. We show the results of this mining process to the user (the categories that have been detected, the properties going with the categories and the external domain). Based on this information, the user can make a personalized “mashup” by aggregating the suitable visualization widgets. Some default visualizations are available according to the top categories detected. The last step is to publish the visualization and a metadata report in RDF/XML TURTLE or N3. 13
(a) The workflow of the different modules interacting in the Linked Data visualization wizard. RDF Dataset SPARQL endpoint Category Detection Property Aggregation Charts Combination Visualization Publication RDF Dataset RDF Dataset
Detection of main categories of the dataset using ASK
Queries.
Aggregation of properties used in interconnected
datasets Mashup of different charts based on the properties and categories detected in the
dataset
Generate, publish and share the visualizations in interoperable formats (HTML, SVG, RDF) Goal Goal Goal Goal
(b) High level functionalities of the Linked Data visualization wizard
Fig. 1.Big picture and architecture of the Linked Data visualization wizard.
Let consider a graph < G, c > to be G= {(s, p, o)|p∈ U RI, s∈U RI, o ∈
(U RI∪LIT)} where U RI is the set of URIs,LIT is the set of literals, andc
the context. We define L={V1, V2, ..., Vn|Vi =Pi∪Ti} the list of vocabularies
in LOV, with Pi and Ti respectively the properties and terms of a vocabulary
Vi. Let also D ={D1, D2, .., Dm} be the domains of vocabularies. We assume
∀V ∈L,∃Dk ∈Φ(L, D). We define a generic functionΣ : (G, c)7→B to detect
categories in a dataset as follows: Σ((G, c)) = {B|(∃(s, p, o) ∈ G : p ∈ V)∪
(∃(s, rdf :type, o)∈G:o∈V)}whereB ={T rue, F alse}.
In the following sections, we describe each of the steps involved in the Linked Data Visualization Wizard in more details.
5.1 Category Detection
The goal of the category detection task is to use SPARQL queries to detect the presence of some high level categories in the dataset. We performASKqueries as implementation of theΣ function using standard vocabularies as defined in the Table 1. We start with six categories, namely: geographic information, person, organization, event, time and knowledge organization systems. We select popular vocabularies based on two existing catalogues: LOV [9] and prefix.cc14.
ASK WHERE { { ? x a ? o . f i l t e r ( ? o= d b p e d i a−owl : P l a c e | | ? o=gml : F e a t u r e | | 14 http://prefix.cc
? o=g e o : S p a t i a l F e a t u r e | | ? o=gn : F e a t u r e | | ? o=admingeo : C i v i l A d m i n i s t r a t i v e A r e a | | ? o=s p a t i a l : F e a t u r e | | ? o=v c a r d : L o c a t i o n ) } UNION { ? x ? p ? o . f i l t e r ( ? p=g e o : l a t | | ? p=g e o : l o n g | | ? p=g e o r s s : p o i n t | | ? p=g e o : g e o m e t r y | | geom : g e o m e t r y ) } }
Listing 1.1.Generic query to detect geo data from a SPARQL endpoint Listing 1.1 shows seven classes of different vocabularies are used, respectively for the namespaces dbpedia-owl, geo, gn, admingeo, spatial and vcard, with relevant classes to check the presence of geographic data.
ASK WHERE {{? x a ? o . f i l t e r ( ? o=t i m e : T e m p o r a l E n t i t y | |
? o=t i m e : I n s t a n t | |
? o=t i m e : I n t e r v a l | | ? o=d b p e d i a−owl : T i m e P e r i o d | |
? o=t i m e : D a t e T i m e I n t e r v a l | | ? o=i n t e r v a l s : C a l e n d a r I n t e r v a l ) } UNION{ ? x ? p ? o . f i l t e r ( ? p=t i m e : d u r a t i o n | | ? p=t i m e : h a s B e g i n n i n g | | ? p=t i m e : inDateTime | | ? p=t i m e : h a s D a t e T i m e D e s c r i p t i o n | | ? p=t i m e : hasEnd )}
Listing 1.2.Generic query to detect time data from a SPARQL endpoint, usingtime, dbpedia-owl, intervalsvocabularies.
Listing 1.2 detects the presence of time information, while Listing 1.3, 1.4 and 1.5 detect persons, organizations and events respectively.
ASK WHERE {? x a ? o . f i l t e r ( ? o = f o a f : P e r s o n | |
? o=d b p e d i a−owl : P e r s o n | |
? o=v c a r d : I n d i v i d u a l ) }
Listing 1.3. Generic query to detect person categories from a SPARQL endpoint, usingfoaf, dbpedia-owl, vcardvocabularies.
PREFIX o r g :<h t t p : / /www. w3 . o r g / n s / o r g#>
PREFIX f o a f : <h t t p : / / xmlns . com/ f o a f /0.1/>
PREFIX d b p e d i a−owl : <h t t p : / / d b p e d i a . o r g / o n t o l o g y />
ASK WHERE {? x a ? o . f i l t e r ( ? o=o r g : O r g a n i z a t i o n | |
? o=o r g : O r g a n i z a t i o n a l U n i t | |
? o=f o a f : O r g a n i z a t i o n | |
? o=d b p e d i a−owl : O r g a n i s a t i o n )}
Listing 1.4.Generic query to detect ORG data from a SPARQL endpoint.
ASK WHERE{? x a ? o . f i l t e r ( ? o= l o d e : Event | | ? o=e v e n t : Event | |
? o=d b p e d i a−owl : Event )}
Listing 1.5.Generic query to detect event data from a SPARQL endpoint, usinglode, event, dbpedia-owlvocabularies.
For detecting data organized as taxonomy, skos vocabulary is used along with the most used classes and properties as showed in Listing 1.6.
ASK WHERE {{? x a ? o . f i l t e r ( ? o=s k o s : Concept | |
? o=s k o s : ConceptScheme | | ? o=s k o s : C o l l e c t i o n )}
UNION{ ? x ? p ? o . f i l t e r ( ? p=s k o s : f e a t u r e C o d e | |
? p=s k o s : a l t L a b e l | | ? p=s k o s : p r e f L a b e l | | ? p=s k o s : r e l a t e d M a t c h )} }
Listing 1.6.Generic query to detect SKOS data from a SPARQL endpoint, usingskos vocabulary.
5.2 Properties Aggregation
We take the benefits of the owl:sameAs links between entities to have access to the properties of the entities in the external namespaces different from the origin dataset. This module also aggregates the properties found in the dataset with the ones found in the interlinked sets. This is based on the assumption that during the linkage process, external datasets not only help in not breaking the
follow-your-noseprinciple, but also add more information to be viewed in visual-ization applications. As shown in the code below, at this stage, we have collected and aggregated external properties gathered from the enrichment process of the workflow.
1-LET Namespace(?s) = S and LET Namespace(?t) =T
2-SELECT owl:sameAs links
LET SEMTERM = list of ?s owl:sameAs ?t WITH T # S
3-IN T, SELECT distinct properties used in dataset 4-AGGREGATE (3) with properties FROM S.
5.3 Visualization Generator
This module aims at recommending the appropriate visualizations based on the categories detected by the wizard. It might also help the user to make a report summarizing the result of the mining process, and then use different visualization libraries to view the data. This module can be viewed as a recommender system because it derives visualizations based on the categories. The input to build each visualization is the corresponding SELECT query of each ASK queries used to detect the categories. Moreover, some adjustment are made to avoid blank nodes and to get the labels of there resources. The generator can be coupled with a mashup widget generator for some categories. For example, users could expect for event data, a combination of map view (where), a timeline (when) and facets based on the agents (who).
5.4 Visualization Publisher
The publisher module aims at exporting the combined visualizations, along with the report of all the process of mining the dataset, in a format easy to share, either as HTML, SVG or in the different RDF syntax flavor. For the lat-ter, apart from using metadata information (creator, issued date, license), we
model the categories we have detected using thedcterms:subjectproperty of a
dcat:Dataset, the queries used (using theprov:wasDerivedFromproperty), the
sample resources for each category (using thevoid:exampleResourceproperty) and the visualization generated (using thedvia andchart15vocabularies).
6
Experiment and Implementation
In this section, we describe the experiments and report the evaluation on detect-ing categories on 444 endpoints. We then describe a prototype as a proof-of-concept
of the proposal.
6.1 Experiment set up
We have evaluated our approach on the list of 444 endpoints referenced athttp:
//sparqles.okfn.org/. We have implemented a script in python to speed up
the process and obtain the results. Every ASK query for the different category is implemented in a separate function requesting a JSON response.
6.2 Evaluation
From the 444 endpoints used on the detection category module, 278 endpoints (62.61%) were able to give satisfactory (yes/no on either of the seven categories) results based on the queries. However, almost 37.38% of the endpoints were either down at the time of our experiments or the response header was in XML instead of JSON (as set up in the script). This result shows that our proposal with the current implementation (not covering all the vocabularies in LOV) make use of most popular vocabularies reused in the Linked Data.
Category number Percentage
GEO DATA 97 21.84% EVENT DATA 16 3.60% TIME DATA 27 6.08% SKOS DATA 2 0.45% ORG DATA 48 10.81% PERSON DATA 59 13.28% STAT DATA 29 6.6%
Table 2.Classification of the endpoints according to the datatype detected with our SPARQL generic queries
This also implies a good coverage of the method that uses standard queries and yet can be extended. The full result of the detection module on the queried 15
services is available at http://cf.datawrapper.de/3FuiV/2/, where for each column, the value 0 stands for no presence and 1 for the presence of the cat-egories. As provided in Table 2, 21.84% of geo data was detected, 13.288% of person data, 10.81% of org data and 3.6% of SKOS data.
Endpoint event geo org person skos time
dbpedia.org - X X X - -de.dbpedia.org - X X X - -el.dbpedia.org X X X X - -fr.dbpedia.org X X X X - X ja.dbpedia.org X X X X - -live.dbpedia.org X X X X - X nl.dbpedia.org X X X X - -pt.dbepdia.org X X X X -
-Table 3. Categories detected in some dbpedia endpoint domains, where “X” is the presence and “-” the absence of the given type of category.
Table 3 summarizes some findings for 8 DBpedia chapters endpoints where it’s easy to note the absence of SKOS data, and less presence of data modeled usingtimevocabulary. The Table also shows the differences in the standard vo-cabularies used to convert the wikipedia data into RDF across different chapters.
6.3 Implementation
A first prototype, implemented with javascript and bootstrap, is available at
http://semantics.eurecom.fr/datalift/rdfViz/apps/, as a proof of
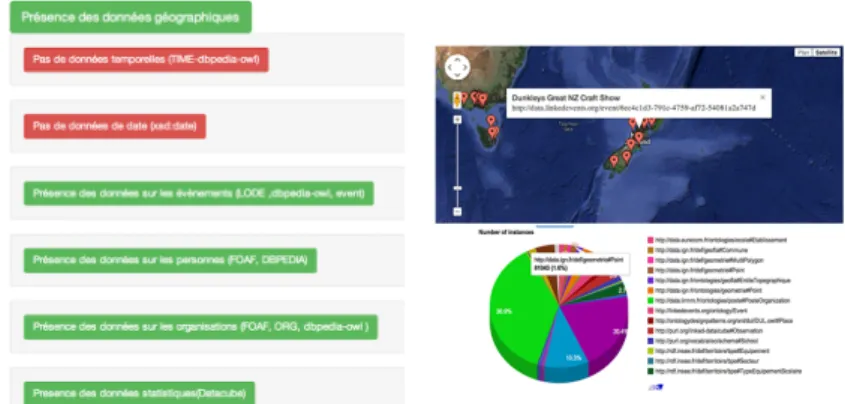
con-cept. We aim at providing a lightweight tool for lay users to quickly understand what the data is about and so that they get first visualizations based on cate-gories detected in the datasets. We also reusesgvizler [7] for generating charts according to the categories retrieved by the wizard. In the current implemen-tation, the user can enter any SPARQL endpoint, and with a “click”, the user can receive the list of categories detected together with sample resources. In the second step, the wizard retrieves the properties from the objects and subjects part of owl:sameAslinks. The last step shows different tabs with the summary of the previous steps, the visualizations available for each categories, and a re-port both in human and machine readable formats. Figure 2 depicts a sample visualization generated by the wizard for geo data and statistics data.
7
Conclusion and Future Work
In this paper we have presented an approach for creating visualizations on top of Linked Data. We first defined seven categories of objects worth viewing in a
(a) Overview of the report on cate-gories detected. Red ones mean ab-sence, while green ones mean pres-ence.
(b) Visualization generated by the wizard, a chart and map view.
Fig. 2.Categories detected and visualization generated by the Linked Data visualiza-tion wizard in the case of EventMedia endpoint service.
dataset, and we propose to associate them with common Linked Data vocabu-laries. We then present a description of the main components of LDVizWiz: a Linked Data Visualization Wizard. We describe a lightweight implementation in javascript as aproof-of-concept of our proposal, with the benefits to be used on-line or being extensible. We advocate that such a tool can be easily integrated in any workflow for publishing and linking data on the web, like Datalift16or the
GeoKnow stack17. We plan to use a more exhaustive set of vocabularies in our
generic queries for detecting those categories, plugging directly the wizard to the LOV catalogue. Regarding the aggregation properties, it can be extended to take into account other semantic relations (e.g:skos:exactMatch). Additionally, we plan to make an evaluation of the prototype and compare it to related tools such as the ones aiming to build a dataset profile.
8
Acknowledgments
This work has been partially supported by the French National Research Agency (ANR) within the Datalift Project, under grant number ANR-10-CORD-009.
16http://www.datalift.org 17
[1] A.-S. Dadzie and M. Rowe. Approaches to visualising linked data: A survey.
Semantic Web Journal, 2(2):89–124, 2011.
[2] J. Klimek, J. Helmich, and M. Neasky. Application of the Linked Data Visualization Model on Real World Data from the Czech LOD Cloud. In6th
International Workshop on the Linked Data on the Web (LDOW’14), 2014. [3] A. d. Leon, F. Wisniewki, B. Villaz´onTerrazas, and O. Corcho. Map4rdf -Faceted Browser for Geospatial Datasets. In Using Open Data: policy mod-eling, citizen empowerment, data journalism (PMOD’12), 2012.
[4] D. L. Phuoc, A. Polleres, C. Morbidoni, M. Hauswirth, and G. Tummarello. Rapid semantic web mashup development through semantic web pipes. In
18thInternational World Wide Web Conference (WWW’09), Madrid, Spain,
2009.
[5] P. E. Salas, M. Martin, F. M. D. Mota, K. Breitman, S. Auer, and M. A. Casanova. Publishing statistical data on the web. In Proceedings of 6th International IEEE Conference on Semantic Computing, IEEE 2012. IEEE, 2012.
[6] B. Shneiderman. The Eyes Have It: A Task by Data Type Taxonomy for Information Visualizations. In IEEE Symposium on Visual Languages ’96, IEEE, Los Alamos, CA (September 1996), pages 336–343, 1996.
[7] G. M. Skjaeveland. Sgvizler: A javascript wrapper for easy visualization of sparql result sets. In 9th Extended Semantic Web Conference (ESWC’12),
2012.
[8] C. Stadler, M. Martin, and S. Auer. Exploring the Web of Spatial Data with Facete. In Companion proceedings of 23rd International World Wide Web Conference (WWW), pages 175–178, 2014.
[9] P.-Y. Vandenbussche and B. Vatant. Metadata Recommendations For Linked Open Vocabularies. OKFN, 2012. http://lov.okfn.org/dataset/lov/