Bachelorthesis
Mikel Garralaga Alvarez
Detect and visualize vulnerable systems using
active vulnerability scans
Fakultät Technik und Informatik Department Informations- und Elektrotechnik
Faculty of Engineering and Computer Science Department of Information and
Detect and visualize vulnerable systems using
active vulnerability scans
Bachelor thesis based on the study regulations for the Bachelor of Engineering degree programme Information Engineering
at the Department of Information and Electrical Engineering of the Faculty of Engineering and Computer Science
of the Hamburg University of Aplied Sciences
Supervising examiner : Prof. Dr. Klaus-Peter Kossakowski Second Examiner : Prof. Dr. Heike Neumann
Title of the Bachelorthesis
Detect and visualize vulnerable systems using active vulnerability scans
Keywords
Cyber Security, Cyber Threat Intelligence, Vulnerability visualization, Yeti, OpenVas
Abstract
Cyber Threat Intelligence helps organisations to improve their security and protect against threats and attacks. The main basis of CTI is the collection and management of information. However, it is really hard to manage all this information separately, so that is why Threat Intelligence platforms are used. Vulnerability scanning is also a technique usually used in cyber security, that allows organisations to know their weak points. In this thesis both concepts are put together, creating an extension for threat intelligence platform YETI that allows to import, visualise and manage scan reports exported from vulnerability scanner OpenVAS.
Mikel Garralaga Alvarez
from the Polytechnic University of CataloniaTitel der Arbeit
Erkennen und visualisieren Sie verwundbare Systeme mithilfe aktiver Schwachstellensuche
Stichworte
Cyber Security, Cyber Threat Intelligence, Vulnerability visualization, Yeti, OpenVas
Kurzzusammenfassung
Cyber Threat Intelligence hilft Unternehmen, ihre Sicherheit vor Bedrohungen und Angriffen zu verbessern. Die Hauptgrundlage von CTI ist das Sammeln und Verwalten von Informa-tionen. Es ist jedoch wirklich schwierig, all diese Informationen getrennt zu verwalten. Aus diesem Grund werden Threat Intelligence-Plattformen verwendet. Das Scannen nach Sicher-heitslücken ist auch eine Technik, die üblicherweise in der Cyber-Sicherheit eingesetzt wird. In dieser Arbeit werden beide Konzepte zusammengestellt, wodurch eine Erweiterung für die Threat Intelligence-Plattform YETI geschaffen wird, mit der Scan-Berichte importiert, visuali-siert und verwaltet werden können, die aus dem Schwachstellenscanner OpenVAS exportiert wurden.
I would first like to thank my thesis supervisor Prof. Dr. Klaus-Peter Kossakowski of the Faculty of Engineering and Computer Science at Hamburg University of Applied Sciences. He assisted me with the development of my thesis and helped me to find right direction whenever I was lost. He also was always available to answer my questions by email.
I would like to thank my family too. They encouraged me to make an exchange program, and supported me during all this time, although they were far from me.
Finally, I would like to thank to my friends in Hamburg. They were my family on a place where I arrived alone. With them I lived many great moments and I had a lot of fun.
List of Figures 7
Listings 8
1 Introduction 9
1.1 Motivation and problem to solve . . . 9
1.2 Objectives . . . 9
1.3 Structure of the Thesis . . . 10
2 Theoretical basis 11 2.1 Cyber Threat intelligence . . . 11
2.1.1 Concepts of Threat Intelligence . . . 12
2.1.2 Subtypes of Threat Intelligence . . . 15
2.2 Visualising threat intelligence . . . 17
2.3 Threat Intelligence Platform: YETI . . . 18
2.4 Scanning for vulnerabilities . . . 20
2.4.1 Vulnerability scanners . . . 21
2.4.2 Vulnerability scanning . . . 21
2.4.3 Limitations of vulnerability scanning . . . 22
2.5 Vulnerabilities and threat intelligence . . . 22
2.6 Vulnerability scanner: OpenVAS . . . 24
2.6.1 Architecture . . . 24
2.6.2 Using OpenVAS . . . 25
2.6.3 Advantages and disadvantages of OpenVAS . . . 27
3 Concept 29 3.1 Overview of the situation . . . 29
3.2 Scanning and exporting with OpenVAS . . . 30
3.3 Importing and processing an OpenVAS report into Yeti . . . 31
3.4 Visualising OpenVAS reports in Yeti . . . 32
4 Implementation 34 4.1 Description of the environment . . . 34
4.2 OpenVas object . . . 34
4.3 Importing OpenVas report file . . . 36
4.4 Saving Observables . . . 38
4.5 Visualising OpenVAS report . . . 39
5 Test results 41 5.1 Preparation and test data . . . 41
5.2 Importing OpenVAS file . . . 42
5.3 Visualising results . . . 44
6 Conclusions and future perspectives 47 6.1 Conclusions . . . 47
6.2 Future perspectives . . . 48
2.1 Subtypes of Cyber Threat Intelligence . . . 16
2.2 Example of Yeti malware object . . . 19
2.3 Example of Yeti investigation graph . . . 20
2.4 Vulnerabilities that suppose a risk in front of existing ones . . . 23
2.5 Greenbone Security Management architecture . . . 25
2.6 Creating new OpenVAS task . . . 26
2.7 Example of result detected in the scan . . . 27
3.1 Diagram of the situation . . . 29
3.2 YetiImport Vulscan filescreen . . . 31
3.3 Vusualising imported scan report . . . 32
3.4 Vusualising scan report on Yeti graph . . . 33
5.1 OpenVAS results of the scan performed for the test . . . 42
5.2 Importing the test file into Yeti . . . 43
5.3 Possible errors importing a scan report file into Yeti . . . 43
5.4 List of imported scan reports . . . 44
5.5 Visualisation of imported report for the test . . . 45
5.6 Observable page . . . 45
5.7 Fragment of vulnerability visualisation page for Openvas object . . . 46
4.1 Fragment of Vulscan class . . . 35
4.2 Fragment of Openvas class . . . 35
4.3 Fragment of Result class . . . 35
4.4 Fragment of OpenvasResult class . . . 36
4.5 Openvas class functions . . . 37
4.6 Save observables function from Openvas class . . . 39
1.1 Motivation and problem to solve
Cyber Threat Intelligence aids organisations to improve their security systems, by the col-lection and management of large amounts of information about the environment. Threat intelligence platforms facilitate the management and visualisation of all this data, having all on the same place. One of these tools is Yeti platform, which offers several options for threat intelligence management. However, it still does not have support for importing vulnerabil-ity scans from other tools. Basing in the premise that the more information, the better for threat intelligence, this supposes a challenge for Yeti. The motivation of the thesis, is to improve Yeti platform so that it provides support for vulnerability scans visualisation, in this case from OpenVAS scanner. This will make Yeti a more complete tool that could be used by organisations at a professional level.
1.2 Objectives
The objective of this Bachelor Thesis is to combine two cybersecurity tools, the vulnerabil-ity scanner OpenVAS and the Threat Intelligence platform YETI. The idea is to implement an extension for Yeti that allows to import, store and visualise an OpenVAS scan report in order to make YETI a more complete tool. Development of this implementation it must take into account the theoretical concept of Cyber Threat Intelligence. This means extracting all information as possible from the report which could be useful for security, provide a clear visualisation of the data imported and the possibility to create relations between other ele-ments that allow users to have a wider view of the security environment. Information to be extracted refers to vulnerabilities detected, hosts scanned, ports used etc.
1.3 Structure of the Thesis
This Bachelor Thesis is structured in six chapters. First chapter is the introduction, and contains the objectives of the thesis and general information about the document. Chapter number two corresponds to the theoretical content on which the thesis is based. Here is explained the concepts of Threat Intelligence and vulnerability scanning, and how they are related. Also are described the two tools used in the thesis. Chapter three is about the concept to be developed. It is explained the overview of the situation and the idea of the extension. Next chapter, number four, explains the implementation of this idea, and in chapter five is performed a test of this implementation, describing the results obtained. The final chapter contains the conclusions of the thesis and what should come next.
In this chapter background of the theoretical information for the further understanding is provided. This involves explaining the basics about Cyber Threat Intelligence, as well as describing the two tools used for the practical part, Yeti Platform and OpenVAS scanner.
2.1 Cyber Threat intelligence
Nowadays it is common to hear about cyber threats and cyber attacks. Every year, these kind of incidents cause losses of many million euros. Organisations have to put a lot of effort and spend a lot of money trying to prevent cyber attacks. And after suffering an attack, they have to use lots of resources to repair damage as soon as possible.
Cyber Threat Intelligence (CTI), or just Threat Intelligence, is a recent concept in the field of Cyber Security that consists in in the collection and analysis of different type of data, in order to detect or even predict threats and potential cyber attacks. The main purpose is to offer organisations a proactive defensive method, providing useful information that can aid them to prepare and take decisions and security measures against a possible attack, especially zero-day-threats, exploits and APT.
Threat Intelligence is based on information. This information consists in data collected from different sources, like public or private feeds. It can be, for example, reports of previous attacks, information about malware types or Indicators of Compromise (IPs, hashes, do-mains...). Data is later processed and analysed by a dedicated team of experts, with the objective of providing a wider view of the risk landscape. This fact allows organisations to know information about attackers as well as understand their motivations, and take decisions according to it. The more information an organisation collects, the more knowledge about threats will have.
One of the main ideas of threat intelligence is threat sharing. This means that organisms can share information they have with others they trust, so that all of them are up to date about existing threats. But for the moment, this idea supposes an issue for CTI. This is because data is not standardised, and each organization uses their own format. There are some solutions that try to solve the problem of CTI sharing. One of them is STIX (Structured
Threat Information Expression), which is an opensource language that defines a format to share threat information [Bar14]. Trusted Automated Exchange of Intelligence Information (TAXII) is an application protocol used to exchange CTI over HTTPS. TAXII was first designed to share STIX data but can also be used with other formats [Ope18]. These are just two examples, but not the only ones. Desite that, threat sharing is it still a challenge for CTI.
2.1.1 Concepts of Threat Intelligence
Cyber Threat Intelligence includes a wide variety of concepts. In this section, the most important ones will be described.
Observables
In cyber security, the word observable refers to any stateful property or measurable event that can be observed in the area of computers and networks [Bar14]. Examples of common cyber observables are [Sta17]:
• IP addresses • MAC addresses • Host names • File hashes • URLs • Email addresses • Files • File paths • Bitcoin addresses
Analysing observables in isolation has not too much sense, because they do not provide much information about the threat situation. They need to be taken from a context where they have a relevant meaning, so that they can be analysed and processed.
Indicators of Compromise
Indicators of Compromise refer to those observables with contextual information about cyber security, that prove the existence of a possible threat or attack [Bar14]. When an attack takes place, it always leaves traces of its activity that can be possible Indicators of Compromise. Examples of typical IOC are virus signatures, patterns on files, irregularities on network traffic or excessive requests for the same file.
It is important for organisations to have a good management of indicators and compromise. There are some solutions that try to solve the challenge of IOC management, for example OpenIOC. OpenIOC is a standard XML format developed by Mandiant (now maintained by Fyre Eye)for describing, grouping and sharing indicators of compromise [Gib13] [Loc13].
Feeds
Feeds are one of the main information sources of Threat Intelligence. They suppose a con-stant and updated stream of data about cybersecurity events. This data can be for example, information about past and actual attacks, malware information or suspicious IP addresses. Generally, feeds focus on a specific area of interest.
Threat intelligence feeds are usually provided by different organisations, and can be free (open source) or paid. Free ones are generally distributed by organisations within the net-work security community, like CERTs. The problem of these fees is that they are not vali-dated, and they suppose a challenge in terms of accuracy. On the other side, paid feeds are in most cases provided by specific companies specialised on it. In this case compa-nies are the responsible of validating feeds before distribute them, so they are more precise [Rou15].
Threat actors
A threat actor is an entity that is responsible of a malicious incident against an organisation’s security. It may be just a single person or an organisation. In CTI, actors can be categorised as external, internal or partner. With external actors there is no previous trust, while with internal or partner [Rou16b] a previous trust existed. Also, threat actors can be divided into three groups , based on their motivations and targets [FB15]:
• Cybercriminals: their main objective is to obtain financial returns and their targets are usually financial accounts, personal information and credentials. In most cases they use email phishing or social engineering to arrive to the victim and then activate the malware.
• Competitors and Cyber Espionage Agents: the motivation of this group is to obtain commercial, political or military from other organisations, in order to get some advan-tages. They can be They can be companies trying to get information about competi-tors, or governments spying other governments. They usually use phishing and social engineering techniques, as well as different types of malware and botnets.
• Hacktivistis: individuals or groups that act motivated by political beliefs or ideologies. Their objective is usually to damage their opponents by stealing incriminating or em-barrassing information, or simply vandalism. Their types of attack are generally mal-ware, phishing, social engineering and DDoS.
TTP
Tactics, Techniques and Procedures (TTP) make reference to the modus operandi of threat actors. Techniques and procedures describe the way of how attackers orchestrate and man-age attacks, and tactics refer to the tools they use for it.
TTP is probably one of the most important information of threat intelligence. The knowledge of how an attacker acts, allows organisations to take measures and decisions about the techniques they should use to protect against the attack. TTPs from threat actors can be obtained from information about previous or current attacks, or tracking their activity on the Internet (forums, social media...) [Sta17].
Incidents and Campaigns
Incidents are discrete events that affect an organisation’s security, compromising their sys-tem or data. Incidents can be caused by people voluntarily or by accident. Examples of incidents can be attempts from unauthorised sources to access systems or data or DoS attacks [Rou16a].
Campaign is called to a group of incidents carried by a common Threat actor using specific TTP and for a particular purpose. Usually it is quite easy to identify incidents of a same campaign, because they are related to each other. They occur over the same specific period of time and share a set characteristics, like Indicators of Compromise or TTP [Cor18].
2.1.2 Subtypes of Threat Intelligence
Strategic
Strategic intelligence references to non-technical information, consumed at a high level by senior decision-makers. It consists basically in reports, briefings or conversations, about pos-sible upcoming attacks. Can be, for example, a report indicating that some actor is believed to perform an attack to an organisation [CR15].
Strategic intelligence focuses on the Who and Why questions. Information collected may allow to identify trends and actors, and also help to understand risks and impact of attacks, specially at a financial level. Responsible teams must design a business strategy for the organisation, basing on this information, in order to minimise impacts.
Operational
Operational intelligence focuses on information about imminent attacks. It tries to answer the questionsHow andWhenan attack will take place, and inform about the capabilities of the attacker. It is consumed by high level security staff, such as Incident Response teams, or Forensic Analysts.
The objective of Operational Intelligence is to predict attacks, and there are different ways of doing it. Can be, for example, analysing reports of past or current attacks to other organisa-tions, and observing trends to deduce which organisation could be next. Also it is important to pay attention to events in real world, sometimes attacks can happen following a specific event [CR15].
Finally, Operation Intelligence can be obtained from actors. This can be done by infiltrating in their groups or intercepting. In most cases it is difficult to do this, because actors usually use secure communications methods, but sometimes there are groups that make their com-munications through unprotected channels, social media or forums. Also, it is more likely for governments than for private organisations to get this intelligence, because the penetration in communications is the majority of cases considered an illegal activity [CR15].
Tactical
Tactical Intelligence is information about TTP of an attack (TTP). It focuses on answering the question What, and the objective is to help to understand how actors are likely to perform an attack. This information is mostly technical, and it is mainly consumed on a low level, by defenders of the organisation such as system architects and administrators [CR15].
Strategic Intelligence may probably be one of the most important intelligences. If defenders know how their organisation will be attacked, they will know what will be the appropriate mechanisms to mitigate the attack. This type of intelligence can be collected from feeds or reports from previous attacks [CR15].
Technical
Technical Intelligence consists basically on technical data about threats and attacks, such as indicators of compromise, and can be collected from feeds. This data is a low level information usually consumed by Security Operations Centres (SOC) and Incident Response team (IR). Examples of Technical Intelligence data are MD5 sums of malware or lists of malicious IPs. But this information has usually a short lifetime, because hashes and IP addresses can be easily modified by actors to make it harder to detect [CR15].
Figure 2.1: Subtypes of Cyber Threat Intelligence [CR15]
2.2 Visualising threat intelligence
Threat intelligence entails the collection of a large amount of information from different sources and with different formats, in most cases difficult to understand for human peo-ple. This fact makes it really hard for operators to organise and analyse this data without spending too much time, and in terms of security this is something inconceivable. For this reason the necessity of a tool to store, manage and visualise security information easily and quickly appears. This tools are called Threat Intelligence Platforms.
Threat intelligence platforms help organisations with the management and analysis of threat intelligence information. They allow to aggregate data from multiple sources and have all of them together in a unique place so that any operator can visualise it. This data is shown in a readable format facilitate its understanding, using graphics to make it more visual. TIPs have offer the capability to link different types of objects that may be related between them, such as indicators, actors or incidents. This platforms also facilitate the task of sharing threat intelligence. The three main functions of a TIP areAggregation,Analysis andAction
[Thr15].
• Aggregation: Consists of the collection, aggregation and storage of threat intelligence data. This data may come both from internal or external sources, such as incident-response reports or feeds, and has different formats. TIPs should be able to import and parse both structured and unstructured data, and should support several formats such as CSV, XML, STIX, OpenIOC etc. It is also important the automation of processing feeds to avoid overwhelming staff with data processing. Despite automation, human support is still needed in order to validate all this information [Thr14].
• Analysis: After aggregating data, it has to be analysed. The analysis should be au-tomated to get faster results and in greater quantity, but also with the supervision of humans. During this process, information collected is validated and placed in context. This means to find correlations between the different indicators, and create links that allow to have an clear view of the situation,for an actor linked to an incident and TTP [Thr15]. TIPs facilitate the visualisation of all this information by the use of rankings, graphics or graphs.
• Action: this means support response processing. TIPs should offer the capability to integrate with other security products using an application program interface (API). Integration facilitates the communication with other teams and improves incident re-sponse and network defense. Actions include deployment of indicators, creation of a feedback loop with other products for obtaining accurate metrics, and dissemination of threat intelligence data [Thr15].
2.3 Threat Intelligence Platform: YETI
YETI (Your Everyday Threat Intelligence Platform) is an open source threat intelligence plat-form built in python, meant to organise observables, indicators of compromise, TTPs, and knowledge on threats in a single, unified repository [CM16]. It also has the ability to automat-ically enrich, such as resolve domains or geolocate IPs. Yeti provides a graphical interface which be accessed from a web browser. It also offers an API so that it can interact with other software.
Yeti offers the possibility to manage several objects: • Observables • Entities – TTP – Actors – Campaign – Company – Malware – Exploit • Indicators – Yara Rule
– Regular Expression (RegEx) • Investigations
All this objects can be created manually from the web interface or automatically using the API. Observables can be also be imported from different sources (MISP instances, malware trackers, XML feeds, JSON feeds...). Yeti offers the capability to create links, manually or automatically, between objects that are correlated and visualise it, in order to have a clearer view. Yeti also provides the possibility to collect data from external feeds and export the data in user-defined formats that they can be used by third-party applications [CM16]. Figure 2.2 shows an example of a Yeti malware object.
Figure 2.2: Example of Yeti malware object [CM16]
One of the main functionalities that Yeti offers is the creation of investigations. Investigations are "groups" of observables, indicators and entities that are related and want to be analysed. There are three ways to create a new investigation: creating a new blank investigation, create an investigation from an object or import an investigation from a file or a web page. The advantage of investigations is that they offer the possibility to visualise all data included in a graph with icons and edges representing the links. This makes it much more easy to view relations between objects and perform a better analysis. Figure 2.3 shows an example of Yeti investigation graph.
Advantages of Yeti:
• It is open source and can be obtained for free • Has support for multiple operating systems • Provides a user-friendly interface
• Offers a clear visualisation of objects and relations Disadvantages of Yeti:
Figure 2.3: Example of Yeti investigation graph [CM16]
• There is few documentation and information about Yeti available
• No easy installation, it has to be installed from the source code from Github • It still have some issues
• It has not a large team behind, only two programmers and users that contribute on Github. This causes that support and issue fixes are a bit slow
2.4 Scanning for vulnerabilities
One common practice in the security of an organisation is the technique of vulnerability man-agement. It can be defined as the cyclical practice of detecting, classifying, remediating, and mitigating vulnerabilities [KDK13], and pays an important paper on the security of organi-sations. It allows to have a wider view of the security state, by knowing what weak points an organisation has, the risk they suppose and how to fix them. One part of the vulner-ability management process is vulnervulner-ability scanning, which is the action of detecting and identifying vulnerabilities on systems and networks.
2.4.1 Vulnerability scanners
Tools used to scan for vulnerabilities are the called vulnerability scanners, and they can be private or open source. Usually, vulnerability scanners are made up of four main modules [otH08]:
• User interface: allows the user to control the scanner. Can be graphical or command line.
• Scan engine: is the part that executes the scan, using information from the database to find vulnerabilities.
• Scan database: contains information about vulnerabilities. This information needs to be updated regularly, in order to be able to detect new vulnerabilities. It may be obtained from external sources, such as CVE database. Scan database contains also results from scans and other data used by the scanner.
• Report module: allows the user to get different types of reports of the results of a performed scan
Vulnerability scanners can not only identify vulnerabilities. They can also get information about host attributes (OS, open ports...) and out-of-date software [SSCO08]. Scanners can be divided into two types, host-based and network-based [Nil06]. Host-based scanners are installed on and run on each host. Network-based ones are installed on one host, and perform their scans over the network, finding hosts and ports. Host-based scanners have the advantage that they can perform a deeper analysis, but network based can be performed on a centralised way, and also provide information about the network situation. Most modern vulnerability scanners are network-based.
2.4.2 Vulnerability scanning
Before start scanning for vulnerabilities, it is important to plan and prepare the scan. This means decide what will be the scope It is recommended that for the first scan to start with a small number of systems or limiting the number of vulnerabilities to find, in order to prevent being overwhelmed with a big number of vulnerabilities [Pal13].
Depending on the perspective scans are performed, they can be classified as external or internal. External scans analyse the security of the part of the system that is exposed to the public. This includes for example network firewalls, web applications or ports. Internal scans are performed on the internal network of the organisation, and provides an overview of the internal security. Also both, internal and external, can be authenticated or not authenticated.
Authenticated ones use credentials and analyse from the perspective of a logged user. Usu-ally in a vulnerability management process both types of scan are combined [Pal13].
When scanning for vulnerabilities, there are several things that must be kept in mind. It is important to think about the location of the scanner on a network-based scan. Elements like firewalls and similar can affect the performance of the scanner [otH08]. Another thing to take into account is that scanners offer the possibility of performing an intrusive scan, attempting to exploit some vulnerabilities when they are found. This helps to provide a more detailed information about the risk of a vulnerability detected, but may disrupt systems and services or cause shutdowns. Also, network-based scanners require a large amount of network traffic, which may affect the performance of the network.
2.4.3 Limitations of vulnerability scanning
Although vulnerability scanning represents an important practise for organisations to obtain information about the security state of their systems and networks, there are still some lim-itations on the process. These limlim-itations are mainly due to the limlim-itations of vulnerability scanners.
• Snapshot in time: scans only represent a specific moment in time. Systems are con-stantly changing and new vulnerabilities may be added to the database. For this rea-son, it is recommended to perform scans regularly [otH08].
• Human judgement needed: vulnerability scanners have the ability to report vulnerabil-ities, but they still have not enough capacity of analysis. That is why qualified personal is needed, in order to check the results from the scans, and detect possible false neg-atives and false positives [Jha14].
• Only known vulnerabilities: scanners use their database to discover vulnerabilities, so they can only detect those which are in the database. Usually, known vulnerabilities correspond to popular applications and operating systems. For this reason, in most cases scanners can not detect vulnerabilities of custom software [Jha14].
2.5 Vulnerabilities and threat intelligence
Vulnerability management supposes an important task in cyber security, and it is related with threat intelligence. The knowledge of their own vulnerabilities helps organisations to have information about their security state and weak points, and to know where and how it is more likely that they are attacked.
A large amount of vulnerabilities are disclosed every year. However, not all of them are really new. A great percentage of them are variations of existing vulnerabilities exploited on different ways. And also, not all of these vulnerabilities are actually exploited. Usually, actors exploit those vulnerabilities that affect the most used technologies. For this reason, it makes no sense that organisations focus and spend their time patching all their vulnerabilities, when only some of them can suppose a risk. So the solution is to prioritise those that suppose a major risk for the organisation. Organisations need to do research and use intelligence in order to identify those vulnerabilities that suppose a major risk for them and that are more likely to be exploited [Pac18]. Figure 2.4 illustrate this situation of vulnerabilities that are a risk for an organisation in front of existing ones.
Figure 2.4: Vulnerabilities that suppose a risk in front of existing ones [Pac18]
All vulnerabilities that appear over the time are stored in vulnerability databases. One of the most important is NIST’s National Vulnerability Database (NVD), with information about more than 100,000 vulnerabilities. It also offers public feeds so that other organisations can make use of this data. But most vulnerability databases present some limitations. On one side, the way of classifying vulnerabilities may not be the most adequate in terms of risk. They focus on technical exploitability, basing how much damage a vulnerability can cause, instead of analysing active exploitation of vulnerabilities. On the other side, databases have a problem of time. They are not updated fast enough, and a lot of times vulnerabilities appear in other sources before databases. This fact supposes a problem for those organisations use the as a source for their information [Pac18].
In order to make more effective for organisations the task of vulnerability management and get an accurate risk, they need to combine internal vulnerability scanning data with external
intelligence. The first step for vulnerability management teams is to scan their systems and know which vulnerabilities affect them. Then, they have to analyse which of these have priority to be patched basing on the risk. To achieve this, responsible teams need to use external intelligence, analysing how each vulnerability has progressed over the time since it was initially identified. This intelligence can be obtained from different sources, such as technical feeds, information security sites, forums and social media, code repositories or the dark web. Sometimes organisations focus too much on zero-day threats, and actually a small percentage of vulnerabilities are exploited on day zero. For this reason it is important to understand too, why actors are targeting some vulnerabilities and ignoring others [Pac18].
2.6 Vulnerability scanner: OpenVAS
Open Vulnerability Assessment System (OpenVAS) is an open source vulnerability scanner developed by Greenbone Networks, and is one of the modules of the commercial product Greenbone Security Manager (GSM). It is a network-based scanner, and can be controlled using a web interface. OpenVAS uses a database of NVT (Network Vulnerability Tests) for the detection of vulnerabilities, which contain information about vulnerabilities. These NVTs are regularly updated with the Greenbone Community Feed (GCM), which is a public feed maintained by Greenbone that contains more than 50,000 NVTs and growing [Net]. Informa-tion about vulnerabilities is obtained from the NaInforma-tional Vulnerability Database (NVD).
2.6.1 Architecture
OpenVAS is a module part of the security management tool GSM, that is made up of several modules. Figure 2.5 shows the architecture of GSM [Wag18].
• GVMd: Greenbone Vulnerability Manager is the central service for vulnerability man-agement. Controls OpenVAS scanner via internal protocol and supports integration with other scanners using Open Scanner Protocol (OSP). It also offers Greenbone Management Protocol (GMP) for accessing data, and controls a database with config-uration and scan results.
• GSA: Greenbone Security Assistant is the user interface of GVM. It is a web interface that can be accessed via browser.
• OpenVAS Scanner: is the main scanner used to detect vulnerabilities. It uses NVTs from a database, which is regularly updated with Greenbone Community Feed (GCF).
Figure 2.5: Greenbone Security Management architecture [Wag18]
2.6.2 Using OpenVAS
OpenVAS GUI can be controlled via web interface using a browser. After login, the fisrt screen that appears is a dashboard with a summary of different information. GSM provides several screens showing different information each.
• Scans: information about results and scans. Also there is the option to create a new scan.
• Assets: information about hosts, operating systems and networks. • SecInfo: here is the information about NVTs, CVEs, CPEs...
To perform a scan first must be created a new task with the desired parameters. This can be done in the menu Scans > Tasks. OpenVAS offers two possibilities, task wizard or custom task. The first possibility is the easiest one but offers few options to configure. Basically can be defined the host and some additional parameters in the advanced wizard. The second possibility is the most complete and customizable. An example of task creation is shown in Figure 2.6. It offers the user different options to configure, such as target selection, min QoD, scan configuration, or maximum concurrently executed NVTs per host. By default, there are seven scan configurations, but users can create new ones [GSAR14].
• Discovery: used NVTs that provide information about the target system. No vulnera-bilities are detected.
• Host discovery: used NVTs that discover target systems and reports the list of systems discovered.
Figure 2.6: Creating new OpenVAS task
• System discovery: used NVTs a that discover target systems including installed oper-ating systems and hardware in use.
• Full and Fast: is the default option. It is based on the information obtained in port scan and uses almost all NVTs to detect vulnerabilities, excluding the ones that may damage the system.
• Full and Fast ultimate: expands previous configuration using NVTs that can disrupt the systems or services.
• Full and very deep: similar toFull and Fast configuration, but it does not depend on the port scan. This scan is very slow
• Full and very deep ultimate: extendsFull and and very deepadding NVTs that can be dangerous for the system.
Before creating a custom task, it is necessary to create a new target first, and this can be done in theConfiguration > Targetsmenu. There are several configurations available when creating a new target. This includes selecting desired hosts, ports of the host that will be scanned, alive test to check reachable hosts and different types of credentials if required. By default, the list of ports isAll IANA assigned TCP, which in most cases is often enough.
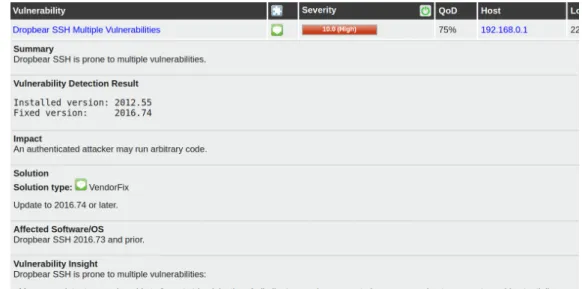
Results from finished scans are shown in the menuScans, with different formats and graph-ics. Tasks, both finished and non-finished, can be found in the sub menu Tasks. Clicking on a task will bring the user to a new screen with information about the results of the scan. In this new screen appear the name of the NVTs detected, with complementing information such as the severity, QoD, host and port. Also, if user clicks on any result, will appear a new screen with detailed information about it. This includes description about the vulnerability, solution if existent or references, such as CVEs and CERTs. Figure 2.7 shows an example of a result detected during the scan
Figure 2.7: Example of result detected in the scan
2.6.3 Advantages and disadvantages of OpenVAS
Advantages
• Open source: OpenVAS can be obtained for free.
• Scan multiple hosts simultaneously: it offers the possibility to perform a scan of more than one systems at the same time and saving time.
• Good database: OpenVAS makes use of a big database which is constantly updating. • Support for multiple platforms: it can be installed in different operating systems. • Great support: it has a good support from the developer as well as from the community.
Disadvantages
• Difficulty configure: OpenVAS is must be installed from source code, so it is recom-mended for users to familiar with this procedure.
• Complex to use: it offers a wide range of options and configurations, so this makes it difficult to use at first.
This chapter contains the information about the concept of the practical part, explaining in detail the idea to be developed. It will be described the OpenVAS file to import, as well as the idea of how the tool works.
3.1 Overview of the situation
In the previous chapter, two tools were described, the vulnerability scanner OpenVAS and the threat intelligence platform YETI. The situation can be described as follows: Administra-tors use both tools, the scanner for detecting vulnerabilities in systems and the platform to visualise and manage threat intelligence information. But data from both softwares is isolated from each other, making it more difficult for administrators to view correlations between them. So idea is to make an extension on Yeti that allows the import, visualisation and management of OpenVAS scan reports, in order to have all information in the same place.
3.2 Scanning and exporting with OpenVAS
The first step is to prepare and perform the scan of the desired targets, and once it is finished, export the report of the scan. OpenVAS scan offers multiple possible formats to export its data(PDF, CSV, XML...). The choice for the development of this thesis is the XML one and it is due to two main reasons. The first one because it contains complete information about the scan and the second one is because XML format is easy to import and parse for machines. It must be taken into account that when exporting a report file, only results displayed results will be included. To change this, user just needs to modify the filters.
An OpenVAS scan XML file contains a large amount of information and fields. Some of this fields are not important and are just for internal use of the scanner tool. So only the most relevant data for the clear visualisation of the report will be extracted. The information selected can be visualised below.
• Name of the scan • Creation time
• List of hosts scanned
• List of ports found during scan
• Severity: corresponds to the highest severity of vulnerabilities founded (0-100%) • Result count: number of vulnerabilities included in the report.
• List of results: list of NVT founded and its information.
– Name of the result
– Description
– Threat (Log, Low, Medium, High)
– Severity (0-100%)
– Host where it was found
– Port where it was found
– Quality of Detection (QoD): describing the reliability of the detection
– Information about the NVT
∗ Tags with several information: this contains useful information about the NVT, such as a summary, impact, solution etc.
∗ Various references: external references with information about the NVT (CVEs, CERTs and links)
3.3 Importing and processing an OpenVAS report into
Yeti
The main objective of the project is to extend Yeti platform to import and visualise a report of a scan from OpenVAS scanner. So a new menu entries is added to Yeti, under the item
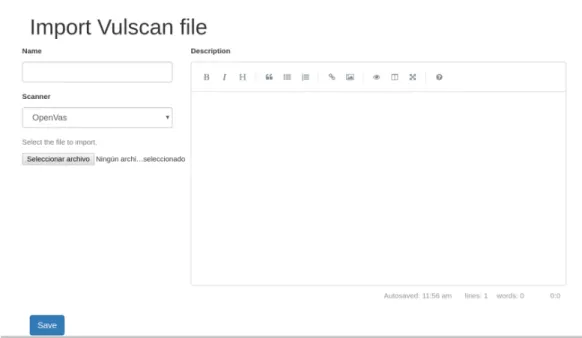
New, namedImport Vulscan file. The extension is designed with the idea of supporting the import of reports from different vulnerability scanners, but for the moment only OpenVAS is supported. Selecting this menu entry will bring to a new screen where files can be imported, which is shown in figure 3.2.
Figure 3.2: YetiImport Vulscan filescreen
The screen for importing a new scan file has several options. User can write a desired name for the imported object and a short description about it. These are optional fields, if no name is written the program will fill it. Also there is the option to select the scanner from which the file is exported in order that Yeti knows how to parse it. Finally there is a file input where the desired report will be selected. This field can not be empty and there is no restriction for file format (for this case is XML).
Once all fields are completed, clicking button Save will send the form to the backend, that will process and save it into the database. During this process, information about the scan will be saved (the one described in previous section). Also observables from the report (IP addresses) will be extracted and linked to the scan. There is the possibility the importing process has a failure, either because of a missing file, because a wrong format or any other reason. In this case, a message will indicate the user the existence of this failure.
3.4 Visualising OpenVAS reports in Yeti
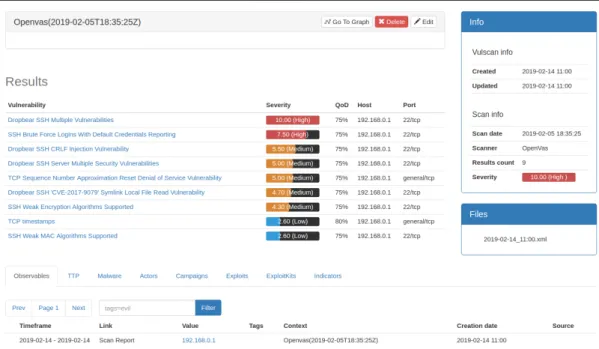
Once the scan is imported to Yeti platform, the user can visualise and manage it. Access-ing the menu item Vulscan/List will show a list with all scan reports that are stored in the database. Clicking on an item will bring the user to a new screen where the report can be visualised. In this screen there is general information about the scan, a list of the vulnerabili-ties and observables linked to this report. General information refers to scan date, import and update dates etc. The list shows vulnerabilities detected during the scan. Each line contains the name of the vulnerability, the severity, QoD and host and port where it was detected. Observables linked correspond to the IP addresses from the host scanned. Also, there is a list of all the files uploaded for this object with the date as name, which can be downloaded. Figure 3.3 shows the screen of a scan report visualisation.
Clicking on an item of the list of vulnerabilities will show a screen with all the information about it. This includes previous information (name, severity, QoD, host and port) and deeper information describing the vulnerability, such as impact, affected software, solution or refer-ences. All of this helps the user to understand what the vulnerability consists of. Also clicking on an observable will bring the user to the page of this observable. When importing a scan report and observables are extracted, a new context is added to each observable with the name of the vulnerabilities detected on each host.
Users can edit a vulscan clicking the buttonEdit. They have the possibility to change name and description and import a new file with updated information. It is also possible to create a new investigation from the report by clicking Go to graph button, which will open a new screen with an investigation graph containing this object. Figure 3.4 shows an example of graph visualisation of a report with multiple hosts.
In this chapter will is described the implementation of the concept from previous chapter,on a code level. Main functions will be explained with fragments of source code to illustrate them.
4.1 Description of the environment
YETI platform backend core is developed using Python 2.7. For the api and the frontend it is used Python module module Flask, which includes Jinja template engine for building dynamic html sites using Python. For the storage, Yeti makes use of the database MongoDB, that provides a more dynamic database. To make interaction between core and database easier it is used the module Mongoengine. Redis and Celery modules are also used by Yeti, but they are not necessary for this implementation.
Yeti source code is structured in different folders. Main folder is namedcore. This folder con-tains all the files necessary to make yeti work. This includes backend and frontend files. Here are defined all yeti objects, such as entity, observable, investigation etc, and the functions re-lated with the database. All the web content is under the sub folderweb. This folder contains the sub folders api andfrontend. The first one involves the files where the api is the fined, and the second one contains all the content related with the web side (HTML templates, css files...). For the implementation of this extension is used Yeti code from 25 January (commit 4641dd1) as base.
4.2 OpenVas object
In order to import and save an OpenVAS scan report file, it is necessary to create a new class describing the object, with the corresponding fields and methods. This class is named
Openvas, and inherits from classVulscan. Vulscan is a class created to define the basis of a general scan report object, and it inherits from Node. In case in the future new classes to import vulnerability scan reports from other scanners are implemented, they must inherit
fromVulscanclass. Files defining object’s classes are stored inside the foldercore. Listings 4.1 and 4.2 show fragments ofVulscan andOpenvasclasses respectively, with the defined fields.
1 c l a s s Vulscan ( Node ) :
SCANNERS = {" openvas ": " OpenVas "}
e x c l u d e _ f i e l d s = Node . e x c l u d e _ f i e l d s + [" scan_date ", " c r e a t e d ", " updated ", " c r e a t e d _ b y ", ’ r e s u l t s ’]
name = S t r i n g F i e l d ( verbose_name="Name" , unique =True , max_length =1024)
6 d e s c r i p t i o n = S t r i n g F i e l d ( verbose_name=" D e s c r i p t i o n ")
c r e a t e d = D at e T i me F i el d ( d e f a u l t = d a t e t i m e . utcnow ) updated = Da t e T im e F i el d ( d e f a u l t = d a t e t i m e . utcnow )
scan_date = D a t eT i m e Fi e l d ( verbose_name=" Scan c r e a t e d ")
scanner = S t r i n g F i e l d ( verbose_name=" Scanner ", c h o i c e s =SCANNERS. i t e m s ( ) , r e q u i r e d =True )
11 r e s u l t s = L i s t F i e l d ( R e f e r e n c e F i e l d ( ’ OpenvasResult ’, verbose_name="
R e s u l t s ") )
Listing 4.1: Fragment of Vulscan class
c l a s s Openvas ( Vulscan ) : o i d = S t r i n g F i e l d ( verbose_name=" OID ") h o s t s = L i s t F i e l d ( verbose_name=" Host ") 4 p o r t s = L i s t F i e l d ( verbose_name=" P o r t s ") r e s u l t s _ c o u n t = I n t F i e l d ( verbose_name=" R r e s u l t s c oun t ") s e v e r i t y = D e c i m a l F i e l d ( verbose_name=" S e v e r i t y ") e x c l u d e _ f i e l d s = Vulscan . e x c l u d e _ f i e l d s + [’ scan_date ’, ’ h o s t s ’,’ p o r t s ’ , ’ r e s u l t s _ c o u n t ’, ’ s e v e r i t y ’, ’ o i d ’]
Listing 4.2: Fragment of Openvas class
Apart from Openvas, it is also created the class Result, which inherits fromYetiDocument. This object corresponds to the results detected during the scan which are included in the report file. This class acts as parent for individual result classes of each scanner. In the case of OpenVAS, result class is named OpenvasResult, which inherits from Result, and corre-sponds to the NVTs discovered during the scan. Results are included in Openvas class in the fieldresults, which contain a list of object id referencing to the corresponding result object. Listings 4.3 4.4 contain fragments ofResultandOpenvasResultclasses respectively.
c l a s s R e s u l t ( YetiDocument ) :
2 meta = {" a l l o w _ i n h e r i t a n c e ": True }
DISPLAY_INFO = [ ]
p o r t = S t r i n g F i e l d ( verbose_name=" P o r t ")
7 h o s t = S t r i n g F i e l d ( verbose_name=" Host ")
i n f o r m a t i o n = D i c t F i e l d ( verbose_name=" I n f o r m a t i o n ")
Listing 4.3: Fragment of Result class
c l a s s OpenvasResult ( R e s u l t ) :
2
DISPLAY_INFO = [ (" d e s c r i p t i o n ", " D e s c r i p t i o n ") , (" summary ", " Summary ") , (" i m p a c t ", " Impact ") , (" a f f e c t e d ", " A f f e c t e d S o f t w a r e /OS") , (" i n s i g h t ", " V u l n e r a b i l i t y I n s i g h t ") , (" s o l u t i o n ", " S o l u t i o n ") , (" v u l d e t e c t ", " V u l n e r a b i l i t y d e t e c t i o n method ") ] t h r e a t = S t r i n g F i e l d ( verbose_name=" T h r e a t ") f a m i l y = S t r i n g F i e l d ( verbose_name=" T h r e a t ") 7 s e v e r i t y = D e c i m a l F i e l d ( verbose_name=" S e v e r i t y ")
qod= I n t F i e l d ( verbose_name="QoD")
r e f e r e n c e s = L i s t F i e l d ( verbose_name=" References ") c e r t s = L i s t F i e l d ( verbose_name=" C e r t s ")
cves = L i s t F i e l d ( verbose_name="CVE")
Listing 4.4: Fragment of OpenvasResult class
In Openvas and result classes are defined the necessary fields and methods for the man-agement of the objects. Fields included are the important ones extracted from the report file, which are defined in section 3.2 from previous chapter. Methods contained allow to import and create the vulscan report, delete end extract different information, such as ob-servables.
4.3 Importing OpenVas report file
To access the importing page, it is necessary to add a new entry to the menu, in this case in New/Import Vulscan file. This is done by editing the file core/web/frontend/tem-pates/base.html. This redirects to a new HTML template with the form to import the file. It is created intemplates/vulscanand is namededit.html. This page is also used to edit a vulscan object.
URL endpoints for the web side are defined in a new file namedvulscansand stored inside
core/web/frontend. This file contains the class VulscanView, which inherits from Gener-icView, and contains the basic functions to interact with the web interface, such as importing a new report file, getting the list of vulscans, getting a single vulscan etc.
Importing a new file makes use of endpoint/vulscan/new, with the function new. To create a new vulscan object, scanner type is checked and functionimport_fileof the corresponding class is called, in this case Openvas. This method gets as parameters the form, the file uploaded and update option, which indicates if it is a new object or an update (by default update=False). Function import_file checks if file exists, and launches NoImportFile error depending on if update parameter is true or false. If update is false and no file exists, error is be launched. If file exists, function create is called. This function receives the file as a parameter, and parses it to extract information. To parse the XML file is used the module
xml.etree.ElementTree. Listing 4.5 shows functions for creating and saving a new object from Openvas class, respectively. Also during the import process, Result objects are created using theCreatemethod from the class, and added to the fieldresultsof vulscan object.
d e f i m p o r t _ f i l e ( s e l f , f i l e , update= F al se ) : i f (f i l e) : t r y : 4 s e l f . c r e a t e (f i l e) e x c e p t N o t U n i q u e E r r o r as e : r a i s e N o t U n i q u e E r r o r ( ) e x c e p t E x c e p t i o n as e : r a i s e I m p o r t V u l s c a n E r r o r (" E r r o r i m p o r t i n g f i l e ") 9 e l s e: i f (n o t update ) : r a i s e N o I m p o r t F i l e (" No f i l e found ") s e l f . save ( v a l i d a t e = Fa ls e ) 14 r e t u r n s e l f d e f c r e a t e ( s e l f , f i l e) : f = ET . parse (f i l e) r e p o r t = f . g e t r o o t ( ) . f i n d (’ r e p o r t ’) 19 s e l f . o i d = f . g e t r o o t ( ) . a t t r i b . v a l u e s ( ) [ 3 ] i f n o t s e l f . name :
s e l f . name = ’ Openvas ( { } ) ’.f o r m a t( f . g e t r o o t ( ) . f i n d (’ name ’) . t e x t ) s e l f . scan_date= d a t e t i m e . s t r p t i m e ( f . g e t r o o t ( ) . f i n d ( ’ c r e a t i o n _ t i m e ’) . t e x t , ’%Y−%m−%dT%H:%M:%SZ ’) s e l f . r e s u l t s _ c o u n t = r e p o r t . f i n d ( ’ r e s u l t _ c o u n t ’) . f i n d (’ f i l t e r e d ’) . t e x t 24 s e l f . s e v e r i t y = r e p o r t . f i n d ( ’ s e v e r i t y ’) . f i n d ( ’ f i l t e r e d ’) . t e x t s e l f . e x t r a c t _ h o s t s ( r e p o r t . f i n d a l l ( ’ h o s t ’) ) s e l f . e x t r a c t _ p o r t s ( r e p o r t . f i n d ( ’ p o r t s ’) . f i n d a l l ( ’ p o r t ’) ) s e l f . e x t r a c t _ r e s u l t s ( r e p o r t . f i n d ( ’ r e s u l t s ’) ) 29 f i l e. seek ( 0 ) r e t u r n s e l f
d e f e x t r a c t _ h o s t s ( s e l f , h o s t s ) : l i s t = [ ] 34 f o r h o s t i n h o s t s : i p = h o s t . f i n d (’ i p ’) . t e x t l i s t . append ( i p ) s e l f . h o s t s =l i s t 39 d e f e x t r a c t _ p o r t s ( s e l f , p o r t s ) : l i s t = [ ] f o r p o r t i n p o r t s : l i s t . append ( p o r t . t e x t ) s e l f . p o r t s =l i s t 44 d e f e x t r a c t _ r e s u l t s ( s e l f , r e s u l t s ) : l i s t = [ ] f o r r i n r e s u l t s : r e s u l t =OpenvasResult ( ) . c r e a t e ( r ) 49 l i s t . append ( r e s u l t ) s e l f . r e s u l t s =l i s t
Listing 4.5: Openvas class functions
During the importing process of a scan report file, it is possible that something fails, so exceptions must be caught. In this case, there are three main exceptions contempled. First one is NotUniqueError, and is thrown when a new object trying to be saved is already in database. This happens if names of two vulscan objects are the same, because name is a unique field. Second error is ImportVulscanError, and corresponds to any error happened during the import process that causes its interruption. This can be due to different reasons, for example a wrong file that can not be parsed. Last error isNoImportFile, and is generated when no file for parsing is found. When any of this errors are thrown, a message will indicate the user the problem.
4.4 Saving Observables
Once information from file is extracted and vulscan object is created and saved into database, next step of the process to extract and save observables. This task is performed in the
Vuscanclass functionsave observabes. This methods takes IP address from hosts included in the scan and gets or creates (if not exist) an IP observable for each one, creating a link with the name "Scan Report" between the observable and the report. Also, for each obervable, a context is added with the name of the vulnerabilities that where detected on this host. This
context is removed from the observable when the vulscan report is deleted. Listing 4.6 shows the functionsave_observablesfrom Openvas class.
d e f save_observables ( s e l f ) : r e s u l t s = s e l f . r e s u l t s
f o r h o s t i n s e l f . h o s t s :
i p = I p . g e t _ o r _ c r e a t e ( v a l u e = h o s t )
5 i p . a c t i v e _ l i n k _ t o ( s e l f ," Scan Report "," web i n t e r f a c e ")
c o n t e x t = {’ source ’: s e l f . name } i =1 f o r r e s i n r e s u l t s : i f r e s . h o s t == h o s t : 10 c o n t e x t [ ’ R e s u l t _ { } ’.f o r m a t( i ) ] = r e s . name i +=1 r e s u l t s . remove ( r e s ) break i p . a d d _ c o n t e x t ( c o n t e x t , r e p l a c e _ s o u r c e = s e l f . name )
Listing 4.6: Save observables function from Openvas class
4.5 Visualising OpenVAS report
To visualise the list of vulscans a new entry in menu is created, Vulscans/List and the page
templates/vulscan/list.html. Visualisation of a single element is possible by clicking on it, which calls the endpoint/vulscan/<id>, which renders new page with the information of the object corresponding to this id.This page istemplates/openvas/single.html and it is adapted to show Openvas objects information. In case a new scanner is implemented, it should include its own single.html in a folder with the name of the scanner. Listing 4.7 shows a fragment of filesingle.html from openvas, corresponding to list of vulnerabilities.
1 < d i v c l a s s=" row "> < d i v c l a s s=" c o l−md−12"> < t a b l e c l a s s=" t a b l e t a b l e−condensed main−t a b l e y e t i−t a b l e t a b l e− hover "> < c a p t i o n ><h3> R e s u l t s < / h3 > </ c a p t i o n > <thead > 6 < t r > < th > V u l n e r a b i l i t y < / th > < th > S e v e r i t y < / th > < th >QoD< / th > < th >Host < / th > 11 < th > P o r t < / th >
</ t r > </ thead > <tbody > {% f o r r e s u l t i n v u l s c a n . r e s u l t s %} 16 < t r > < td ><a h r e f =" { { u r l _ f o r ( "f r o n t e n d . VulscanView : r e s u l t" , i d = r e s u l t [ ’ i d ’ ] , scanner = ’ openvas ’ ) } } "> { { r e s u l t . name } } < / a > </ td > < td > { { openvas . d i s p l a y _ t h r e a t b a r ( r e s u l t . t h r e a t , r e s u l t . s e v e r i t y ) } } < / td > < td > { { r e s u l t . qod }}% </ td > < td > { { r e s u l t . h o s t } } < / td > 21 < td > { { r e s u l t . p o r t } } < / td > </ t r > {% e n d f o r %} </ tbody > </ t a b l e > 26 </ d i v > </ d i v >
Listing 4.7: Fragment of Openvas single.html page
Details of a vulnerability from a vulscan object can be visualised clicking on an item from the list. This calls the endpoint/vulscan/result/<id>and renders the pageresult.html. This page is insidetemplates/openvas, and likesingle.html, is only adapted for Openvas objects. Other scanners will need to implement another page. Both, designs of Openvas single.html and
result.html are based on the original Greenbone web interface.
Also from the single page, it is also possible to access the graph and create a new in-vestigation, by cliking the button Go to graph. This calls the endpoint /graph/<class>/<id>, which creates a new investigation from the object corresponding to the id, and renders the graph page1. In order to be able to visualise a vulscan object in the graph, file
frontend/static-files/yeti/js/graph.jsis modified to bind an icon to this type of object, in this case is icontext70
from frontend/staticfiles/yeti/css/flaticon.svg. For future implementations of new scanners it is necessary to define the icon too.
1There was some problem with the graph at the beginning and it was not working. It was tried to be fixed and
new issue was opened on Yeti’s Github. Finally, for some unknown reason, graph worked. Possibly it was a problem related with browser and libraries.
In this chapter is tested the implementation described in previous chapter. A scan report file form Openvas is imported and results are described and shown using screen shots.
5.1 Preparation and test data
Before starting the test, environment has to be prepared. For this case, following components used are:
• Ubuntu 18.04 LTS as OS, with Python 2.7.15rc1 installed.
• GSM CE on version 4.2.20 installed on virtual machine in Virtual Box
• Yeti Platform with OpenVAS extension implemented, based on source code from com-mit 4641dd1 from 25 January.
• MongoDB CE version 4.0.6
• Google Chrome version 72.0.3626.109
First step is to define and run the OpenVAS scan. The host scanned for this test is a device with IP address 192.168.0.1, so a new target is created for this host. Target configuration includes IP address, all IANA assigned TCP port list and default configuration as alive test. Then a new task is created and performed, usingfull and very deep as scan config. After the scan has finished, the report is exported in XML file1. Figure 5.1 shows a screenshot
from OpenVAS with the list of vulnerabilities detected during scan. Only the ones that match the filter are shown, which are 9 from 27 results. The filter for this case is the default one: minimum 70% of QoD and only High, Medium and Low severity classes are shown.
1File used for this test can be found in the CD inside the folder "test_data" with the name
Figure 5.1: OpenVAS results of the scan performed for the test
5.2 Importing OpenVAS file
After file is exported from OpenVAS, it is imported into Yeti Platform in order to be pro-cessed and stored. For the import it is just necessary to fill the form and select the file. In this case, the vulscan object is named Report_test, the scanner isOpenVAS, file is re-port_192.168.0.1.xml and a short description is written. All this is shown in figure 5.2. When
Save button is clicked, Yeti will start processing the file and extracting necessary informa-tion.
In this case no problems occurred during the importing process. But to try that error catching works and see what happens, several attempts with wrong files are also performed. Figure 5.3 shows the three main possible errors. First one is because no import file has been selected, second one is due to a file with wrong format and last one is caused by trying to save an object with a name that is already in database.
Figure 5.2: Importing the test file into Yeti
5.3 Visualising results
Once the scan file is imported into Yeti it can be visualised. Just when the process is finished, web page is redirected to the single page of this report. Here can be seen all the information about the scan imported, such as the list of vulnerability, observables extracted and general information about the scan. All saved reports can be accessed from the list of vulscans, as shown in figure 5.4.
Figure 5.4: List of imported scan reports
In this case Report_test is visualised, which is the one imported for the test. Figure 5.5 shows the visualisation of this object in Yeti. As it can be seen, the list of vulnerabilities contain the same ones that where in the screenshot from OpenVAS in figure 5.1. On right side of the page there is the general information about the scan, such as dates, scanner type or severity, and also the files attached to this object. Below the list of vulnerabilities there is the list of observables linked to the report, in this case 192.168.0.1. From here can be accessed to the observable page with all its information, as shown in figure 5.6. It can be observed that the observable has a context with the name of the vulnerabilities2and on the side the linked vulscans.
2Each context element has a number on its key (Result_X). This does not mean any order, it is just because
Yeti does not allow to have two elements with same key in the same context, so number is just to differentiate them.
Figure 5.5: Visualisation of imported report for the test
From the report single page it is possible to visualise the detailed information about each vulnerability, such as description, severity, impact, affected software, references etc. Figure 5.7 shows a fragment of the detailed page of the vulnerability TCP Sequence Number Ap-proximation Reset Denial of Service Vulnerability belonging to the scan of the test. Also from the report single page a new investigation is created and graph visualised, as shown in figure 5.8. It can be observed that in the graph there are two elements linked, which correspond to the report imported and the observable related with this object. Also selecting the observable can be seen the context on the left bar.
Figure 5.7: Fragment of vulnerability visualisation page for Openvas object
6.1 Conclusions
Cyber security is an important field nowadays in the digital era. Organisations need to have a strong security system in order to protect themselves from possible threats and attacks. Cyber Threat Intelligence aids to improve security of organisations, by offering a proactive defensive method that tries detect or even predict potential threats and attacks, and helps administrator to take decisions related to security. Threat intelligence is based on collect-ing, managing and sharing information, but it is difficult to manage and detect correlations between separated data. Threat Intelligence Platforms try to solve this challenge, by provid-ing a centralised tool where all CTI data is stored, and offerprovid-ing a clear visualisation and the possibility to set relations between data.
Vulnerability scanning is a frequently method used by organisations in order to discover which are their weak points and maybe guess where can they be attacked. However, there are a huge amount of vulnerabilities, so it is practically impossible for organisations to patch all of them. This means prioritisation must be applied, not all vulnerabilities suppose the same threat. So the combination of vulnerability scanning with threat intelligence will help to detect which vulnerabilities suppose a major risk focus more on these.
Yeti Platform is a quite complete threat intelligence open source platform. But it did not have any support for importing data from vulnerability scanners. Now, after this thesis, Yeti provides the possibility to import and visualise scan report files from the open source vulner-ability scanner OpenVAS. This will allow users to have a more complete tool for managing, visualise and share threat intelligence.
Yeti extension was developed tanking into account the idea of threat intelligence. This means the clear visualisation of information and the creation of links with other data, in order to discover relations between elements and have a wider view of the environment. This is possible in the new Yeti by the extraction of IP observables from each scan and the creation of a link between them. Also the possibility to create an investigation from a report object and visualise it in the graph.
The development of the program did not suppose a major problem. Only at the beginning there were some difficulties to start, due to the fact of looking into an unknown code made by other people. Also at some point of the process was an issue with the graph that did not work, but it suddenly fixed. Maybe there was a problem with browser and libraries. The implementation of the extension has been according to Yeti’s visual design. But also the visualisation of the results from the scan report has taken as base the OpenVAS interface. So users that are familiar with both, Yeti and OpenVAS tools will not have any difficulty to understand the visualisation.
6.2 Future perspectives
In this thesis it has been implemented the basis for importing and visualising a scan report file from OpenVAS, but there are still some additional functionalists that could be implemented in the future to improve Yeti extension. One of this possibilities is to add support for other vulnerability scanners. For the moment only OpenVAS is supported, but in the development the door has been left opened for the integration of other scanning tools.
Threat intelligence supposes the management of a huge amount of data, so a large number of reports will probably be managed, or even a single report itself could contain a great quantity of information (results, hosts, ports...). Searching specific elements in this amount would be a difficult task, so it is necessary the implementation of some kind of filter that allowed to filter basing on different parameters.
Now, only IP observables corresponding to the hosts scanned are linked to the report object. However, it should be great to have the possibility to create links with other types of observ-ables or objects (entities or indicators), and supporting the use of tags. Also, extracted IPs could maybe be part of the private network of an organisation and not a public IP, so it would be good to implement any option that allowed to differentiate between public and private addresses.
Another possible implementation would be having some type of vulnerability database, and link them to the results in the reports imported. This will allow to create relations between vulnerabilities and other objects (for example a malware that exploits a specific vulnerability). And link IP observables to vulnerabilities they contain, instead of only linking addresses to reports. This would improve the visualisation, because in the graph a user could visualise for example an IP object and the link to an specific vulnerability that has some interest for him.
Finally, some other points related with current implementation could be improved, such as optimise the process of importing a file. There are some steps of the process that are not
optimised and could affect the performance of the program, specially if large files are pro-cessed. This refers for example to some large loops that are present in the process.
![Figure 2.1: Subtypes of Cyber Threat Intelligence [CR15]](https://thumb-us.123doks.com/thumbv2/123dok_us/796783.2600729/16.892.237.650.514.936/figure-subtypes-of-cyber-threat-intelligence-cr.webp)
![Figure 2.2: Example of Yeti malware object [CM16]](https://thumb-us.123doks.com/thumbv2/123dok_us/796783.2600729/19.892.164.752.161.529/figure-example-of-yeti-malware-object-cm.webp)
![Figure 2.3: Example of Yeti investigation graph [CM16]](https://thumb-us.123doks.com/thumbv2/123dok_us/796783.2600729/20.892.164.753.163.527/figure-example-of-yeti-investigation-graph-cm.webp)
![Figure 2.4: Vulnerabilities that suppose a risk in front of existing ones [Pac18]](https://thumb-us.123doks.com/thumbv2/123dok_us/796783.2600729/23.892.277.643.432.695/figure-vulnerabilities-suppose-risk-existing-ones-pac.webp)
![Figure 2.5: Greenbone Security Management architecture [Wag18]](https://thumb-us.123doks.com/thumbv2/123dok_us/796783.2600729/25.892.177.730.167.423/figure-greenbone-security-management-architecture-wag.webp)