ACT
A D A P T A T I O N T O
C L I M A T E C H A N G E T E A M
W W W . S F U . C A / A C T
PAYING FOR URBAN INFRASTRUCTURE
ADAPTATION IN CANADA
An Analysis of Existing and Potential Economic
Instruments for Local Governments
by ACT (Adaptation to Climate Change Team) June 2015
ISBN: 978-1-77287-027-5
With support from Natural Resources Canada through the Adaptation Platform Economics Working Group, the Cowichan Valley Regional District and The Real Estate Foundation of British Columbia.
1 CONTENTS. ... 1 LIST OF ACRONYMS. ...9 ACKNOWLEDGEMENTS. ... 10 EXECUTIVE. ...11 SUMMARY. ...11 I. INTRODUCTION. ... 17
II. CANADIAN CLIMATE CHANGE CONTEXT. ...23
II.1. A “Commitment” to Global Climate Change. ...24
II.2 Climate Change in Canada. ...28
III. ADAPTATION TO CLIMATE CHANGE. ...35
III.1 The Cost of Adaptation. ...36
III.2 Adaptation and Climate Resilience at the Local Government Level. ...37
III.3 Canadian Infrastructure Deficit . ...39
III.4 The Economic Case for Adaptation. ...40
III.5 Cost/Benefit Considerations. ...42
III.6 Value of Blue Green Infrastructure (BGI). ...44
IV. PAYING FOR ADAPTATION: THE CANADIAN EXPERIENCE. ...47
2
IV.1 Finance Tools. ... 51
IV.2 Tool Evaluation Methodology. ... 51
IV.3 Summary of Results. ...54
IV.4 Evaluation Criteria and Best Practice Tools. ...55
Effectiveness. ...55
Ease of Implementation. ...55
Public Acceptance. ...56
Equity. ...57
Flexibility. ...57
V. INTERNAL SOURCES FOR ADAPTATION INVESTMENTS AT THE LOCAL LEVEL. ....58
V.1 Conventional Financing . ... 61
Borrowing. ... 61
Design. ...64
Application to Climate Change Adaptation. ...64
Feasibility. ...65
Reserve Funds. ...65
Application to Climate Change Adaptation. ...66
Benefits. ...67
Limitations. ...67
Feasibility. ...67
V.2 Innovative Financing . ...68
Green Bonds and Climate Bonds. ...68
Design. ...68
Application to Climate Change Adaptation. ...68
Benefits. ...69
3
Canadian Case Studies. ...70
Feasibility . ...70
Tax Increment Financing (TIF). ... 71
Design. ... 71
Application to Climate Change Adaptation. ...72
Benefits. ...72
Limitations. ...72
Canadian Case Studies. ...73
Feasibility Study. ...73
V.3 Conventional Funding . ...73
Property Taxes. ...74
Application to Climate Change Adaptation. ...75
Benefits. ...75
Limitations. ...75
Feasibility Study. ...76
Tax Levy. ...76
Design. ...76
Application for Climate Change Adaptation. ...76
Benefits. ...76
Limitations. ...77
Canadian Case Studies . ...77
Challenges. ...78
Feasibility . ...79
V.4 Innovative Funding . ...79
Local Improvement Charges (LICs). ...79
Application to Climate Change Adaptation. ...79
Benefits. ...80
Limitations. ...80
4
Surrey Drainage Tax. ...82
User Fees. ...83
Application to Climate Change Adaptation: Stormwater Management Systems. ...83
Benefits. ...84
Limitations. ...85
Canadian Examples. ...85
Prince George lessons learned:. ...86
City of Victoria lessons learned: . ...86
Feasibility. ...88
Development Cost Charges (DCCS). ...89
Implementation. ...89
Application for Climate Change Adaptation. ...90
Benefits. ...90
Limitations. ...90
Canadian Examples. ...90
Feasibility. ... 91
VI. EXTERNAL SOURCES OF REVENUE FOR INFRASTRUCTURE ADAPTATION. ...93
VI.1 Conventional Sources . ...95
The Federal Gas Tax Fund. ...95
Application to Climate Change Adaptation. ...95
Benefits. ...97
Limitations. ...97
Feasibility. ...98
Intergovernmental Grants. ...99
Design. ... 100
Application to Climate Change Adaptation. ...101
Benefits. ...101
Limitations . ...101
Canadian Examples. ...101
Feasibility Study. ... 103
5
Public-Private Partnerships (P3s). ... 104
Application to Climate Change Adaptation (CCA). ... 105
Benefits. ... 106
Limitations. ... 106
Examples. ... 107
Business Case. ... 107
Feasibility . ... 107
Carbon Fund (BC Only). ... 108
Design. ... 108
Application to Climate Change Adaptation. ... 108
Benefits. ... 109
Limitations. ... 109
Canadian Case Studies. ... 109
Feasibility Study. ...110
Climate Action Revenue Incentive Program (CARIP) Grant (BC Only). ... 111
Design. ... 111
Application to Climate Change Adaptation. ... 111
Benefits. ...112
Limitations. ...112
Feasibility Study. ...112
VII. CREATING INCENTIVES FOR CLIMATE CHANGE ADAPTATION AT LOCAL LEVELS . ...113
Local Financial Incentives and Rebates. ...115
Design. ...115
Application to Climate Change Adaptation. ...116
Benefits. ...116
Limitations. ...116
Case Study Examples. ...117
Feasibility Study. ...117
Local Improvement Charge (LIC) Financing. ...118
Application for Climate Change Adaptation. ... 120
Benefits . ...121
6
Feasibility. ...121
Density for Benefit Agreements (Bonuses/Transfers). ... 123
Design. ... 123
Application to Climate Change Adaptation. ... 124
Benefit. ... 124
Limitations. ... 125
Canadian Case Study. ... 125
Feasibility Study. ... 126
Natural Area Tax Exemption. ... 126
Design. ... 126
Application to Climate Change Adaptation. ... 127
Benefits. ... 128
Limitations. ... 128
Canadian Case Studies. ... 129
Feasibility Study. ... 130
VIII. INSURANCE AND DISASTER MITIGATION. ...131
Insurance. ... 133
How is insurance already involved?... 134
How could insurance be involved more?. ... 134
Overland flood insurance in Canada. ... 135
National Disaster Mitigation Strategy. ... 136
IX. INFRASTRUCTUREADAPTATION PLANNING CONSIDERATIONS. ...141
Decision #1: How will up-front costs be secured?. ... 144
Decision #2 - How will the costs be recovered?. ... 145
New Infrastructure. ... 147
Upgrades. ... 148
Operations and Maintenance. ... 148
Community-wide infrastructure. ... 148
X. RECOMMENDATIONS AND CONCLUSIONS. ... 149
Recommendations for Local Governments. ...151
7
Areas for Further Research and Next Steps. ... 154
Conclusions. ... 156
REFERENCES. ... 157
APPENDIX I: ADAPTATION EXPERIENCE IN OECD COUNTRIES. ... 165
Super Levee Financing in Japan. ... 166
Dutch Delta Program. ... 166
APPENDIX II: PROVINCIAL BORROWING LEGISLATION AND REGULATIONS IN CANADA. ... 170
APPENDIX III: GROUND-TRUTHING RESULTS WITH THE COV AND THE CVRD... 174
APPENDIX IV: MUNICIPAL ADAPTATION PLANS. ... 199
APPENDIX V: PROVINCIAL ADAPTATION STRATEGIES AND FUNDING FRAMEWORKS. ...209
APPENDIX VI: DETAILED EVALUATION OF FINANCIAL INSTRUMENTS. ...211
Borrowing. ... 212
Reserves. ... 214
9
AR5 Fifth Assessment Report of the Intergovernmental Panel on Climate Change
BGI Blue Green Infrastructure
CCA Climate Change Adaptation
CAC Community Amenity Contributions
CO2 Carbon Dioxide
CoV City of Vancouver
CVRD Cowichan Valley Regional District
GHG Greenhouse Gas
DCC Development Cost Charges
DFAA Disaster Financial Assistance Arrangements
FAR Floor Area Ratio
FEMA Federal Emergency Management Agency
GMF Green Municipal Fund
IBC Insurance Bureau of Canada
ICLEI Local Governments for Sustainability
IPCC Intergovernmental Panel on Climate Change
LIC Local Improvement Charge
NDMP National Disaster Mitigation Program
NRTEE National Roundtable on the Environment and the Economy
FCM Federation of Canadian Municipalities
OECD Organization for Economic Cooperation and Development
P3 Public Private Partnership
PPM Parts Per Million
ROI Return on Investment
TIF Tax Increment Financing
10
This report was prepared by researchers Julia Berry, School of Resource and Environmental Management, SFU, and Lisa Danielson, School of Public Policy, SFU, under the supervision of Deborah Harford, Executive Director, ACT (Adaptation to Climate Change Team), School of Public Policy, SFU, and Dr. Nancy Olewiler, Professor, School of Public Policy, SFU. Many thanks to the panel of experts invited to review and comment on this document, including: Cathy LeBlanc and Joshua Craig, Ministry of Community, Sport and Cultural Development, Government of British Columbia; Brad Badelt and Randy Pecarski, City of Vancouver; Yaheli Klein, ACT; and Kate Miller, Cowichan Valley Regional District (CVRD). The report was developed by ACT through a project supported by Natural Resources Canada (NRCan), under the program of the Economics Working Group of Canada’s Adaptation Platform with additional funding by the CVRD.
We also deeply appreciate the support of those whose invaluable comments and insight helped shape this report, including: Carrie Baron, City of Surrey; Marc Lee, Canadian Center for Policy Alternatives; Tamsin Mills, Leslie Ng, and Michel Desrochers, City of Vancouver; Gina Layte Liston, City of Prince George; Ed Robinson, City of Victoria;
Bruce Sampson, Bruce Fraser, Keith Lawrence and Sharon Moss, CVRD; Erin Anderson, Ladysmith; and Michelle Geneau, City of Duncan.
Finally, we thank Dr. Benoit Laplante (economist and consultant, Sooke, British Columbia) for the technical editing of the report.
Denmark’s Ramboll, Inc. assisted in initial planning of the report.
All recommendations, omissions and remaining errors are solely those of the authors and may not be attributed to any of the people mentioned above.
11
11
EXECUTIVE
SUMMARY
12
As global climate change advances,
Canada’s
climate is also changing. The scientific community
has warned that the world is committed to further
changes in climate, regardless of future greenhouse
gas emission (GHG) scenarios. While mitigating
emissions remains necessary to avoid catastrophic
change, adaptation to the risks posed by climate
change is key to minimizing their impacts.
13
A number of lessons are emerging from the worldwide experience with adaptation in recent decades:
First, while adaptation can contribute to the welfare of current and future popula-tions, the potential for adaptation, as well as constraints and limits to adaptation, varies among sectors, regions, communities, and ecosystems. Hence, it is now rec-ognized that no single approach for reducing climate change risks is appropriate across all geographical settings.
Second, while engineered and technological options are often necessary to re-duce the risks of climate change impacts, there is increasing recognition that, in order to limit the impacts and the costs of projected climate change, adaptation needs to become embedded in medium- and long-term planning processes at all levels of government.
Finally, and perhaps most importantly for the purpose of this report, it is increas-ingly recognized that cost-effective adaptation takes place at different levels of government, including local governments.
As is the case in many other countries in the Western hemisphere, local governments in Canada have a significant role to play in minimizing the impacts of climate change on their population, economy, and fiscal budgets. Simultaneously, local governments typically experience limited capacity, expertise, and limited financial resources.
In the absence of adaptation, estimates indicate that climate change may cost the people of Canada approximately $5 billion per year by 2020, and between $21-$43 billion by 2050 (NRTEE, 2011). These rising costs are already becoming evident. Local governments must therefore develop a clear understanding of anticipated climate change impacts in order to analyze the costs of inaction. This involves assessing geographical areas, sectors and populations at risk from climate hazards, characterizing expected damages, and identifying infrastructure, people, businesses, etc., that may be at risk. It is important that all costs associated with extreme weather events are calculated, including socio-economic impacts such as loss of production, unemployment from destroyed or
14
bankrupt businesses, loss of biodiversity and green infrastructure, loss of housing price value, lost tax revenue, etc.
Unless comprehensive understanding is created based upon the estimated costs of inaction, the design of solutions will be skewed and risk placing disproportionate pressure on isolated parts of local governments’ areas of responsibility.
This report examines a number of instruments that local governments in Canada may use to generate revenues in support of adaptation in general, and in support of the development of climate resilient infrastructure in particular. The report also examines instruments aimed at incentivizing behavioural changes at local levels that may reduce the need for public investments in adaptation, and could thereby reduce the need to generate revenues in support of such investments. The most effective combination of incentives and investments is likely to vary across local governments.
There are numerous policies and instruments available to local governments to increase investment in climate change adaptation infrastructure. A review of the literature suggests the following three over-arching messages:
First, public sector financing of adaptation infrastructure may require giving lower levels of government greater access to public sources of revenue.
Second,it is clear that public sector financing will not be sufficient to fund all climate change adaptation measures at local levels, especially where local levels of government are already facing infrastructure deficit.
Third, gaining public buy-in is a key factor in any infrastructure adaptation project. The report distinguishes between tools for financing and tools for funding climate change adaptation infrastructure: Financing refers to securing capital for a project in advance, whereas funding infrastructure refers to repaying or saving for payment of the up-front capital costs. Funding also includes the operation and maintenance of infrastructure. Examples of tools include: borrowing, reserve funds, green and climate bonds, tax increment financing (TIF), user fees, development cost charges (DCCs), local improvement charges (LICs), tax levies, inter-government grants, Gas Tax Grants, public-private partnerships (P3s), incentive programs, density bonuses, and land trusts. All tools
15
are evaluated through a framework to enable systematic, evidence-based assessment of the different options.
We present two sets of recommendations: for local governments, and for other levels of government.
FOR LOCAL GOVERNMENTS, IT IS RECOMMENDED TO:
• Include adaptation in long-term stra-tegic planning using downscaled cli-mate change projections.
• Reduce incremental costs associat-ed with climate change by incorpo-rating adaptation actions into exist-ing municipal processes (e.g., into infrastructure maintenance and re-placement programs, or in updates of community plans).
• Act strategically and be creative with the current tools available.
FOR OTHER LEVELS OF GOVERNMENT, IT IS RECOMMENDED TO:
• Reduce barriers for local govern-ments to borrow or issue bonds for resilient or adaptation projects.
• Remove barriers and incentivize public-private partnerships for resil-ient or adaptation projects.
• Assess the continued appropriate-ness of the existing provincially ad-ministered Disaster Financial Assis-tance (DFA) funding formulas in light of increase flood-related damage due to climate change.
• Explore opportunities to link mitiga-tion and adaptamitiga-tion projects.
• Provide regulatory support for an overland flood insurance program.
17
18
Over the 20
thcentury,
average temperatures
in Canada have increased by 1.5°C, precipitation
patterns have changed, floods have increased in
both frequency and intensity, and sea level has risen.
As noted in the Fifth Assessment Report (AR5) of the
Intergovernmental Panel on Climate Change (IPCC
2014), the world is committed to further significant
changes in climate even if strong mitigation
19
efforts were to rapidly take place. Across general circulation models, climate change projections until approximately 2050 remain nearly identical regardless of GHG emissions scenarios in coming decades.
First, while adaptation can contribute to the welfare of current and future popula-tions, the potential for adaptation, as well as constraints and limits to adaptation, varies among sectors, regions, communities, and ecosystems. Hence, it is now recognized that no single approach for reducing climate change risks is appropri-ate across all geographical settings as well as socio-economic characteristics of impacted populations.
Second, while engineered and technological options are often necessary to re-duce the risks of climate change impacts, there is increasing recognition that, in order to limit the impacts and the costs of projected climate change, adaptation needs to become embedded in medium- and long-term planning processes at all levels of government.
Finally, and perhaps most importantly for the purpose of this report, it is increas-ingly recognized that cost-effective adaptation takes place at different levels of government, including local governments.
Adaptation aims to reduce the risks of climate change impacts. A number of lessons are emerging from the worldwide experience with adaptation in recent decades:
National governments can coordinate adaptation efforts of local and sub-national governments, for example by protecting vulnerable groups, supporting economic diversification, and providing information, policy and legal frameworks, and finan-cial support. Local governments and the private sector are increasingly recognized as critical to progress in adaptation, given their roles in scaling up adaptation of communities, households, and civil society and in managing risk information and financing. (IPCC, 2014, p.116)
The various levels of government experience different strengths and limitations in tackling climate change. At the local level, limited financial and human resources remain a common constraint.
20
The purpose of this research is to explore existing economic instruments currently in use in the Canadian public sector and ways these instruments might be modified and applied to finance adaptation measures in Canada, especially in the local government context. In doing so, the report looks at approaches currently in use in other OECD countries (see Appendix 1 for detailed examples), and new approaches that can be modified or utilized for adaptation. The outcomes of this review are applied to the City of Vancouver (CoV), with the goal of helping the city adopt economic instruments that promote adaptation within the urban environment.
The Cowichan Valley Regional District (CVRD) joined the project as a partner representing a contrasting mix of rural, resource and peri-urban communities. These results are also included in our analysis, and a customized report was developed for direct delivery to the CVRD. However, the national scope of this report did not allow in-depth analysis for the wide variety of municipal regulations across Canada’s provinces, and this is recommended as an option for future research.
The research proceeded in three stages:
First, we conducted desktop research in the areas of municipal finance, climate change adaptation infrastructure, and intergovernmental infrastructure financing. In the process, we explored the potential of innovative financing options, including green bonds and climate bonds.
Each tool identified was evaluated based on seven objectives and 12 criteria developed from a review of literature and interviews with key experts including academics, city planners, and municipal financial officers. A scale of high, medium or low was used to rank each tool, based on its ability to achieve the goals and objectives reflected in the chosen categories and reflecting how tools score in comparison to others. Table 6 illustrates the evaluation criteria and ranking. The tools were evaluated in a table format (see Appendix 6 for detailed results), and each result was colour-coded to indicate how the tool ranked in each criterion section.
The criteria we employ are qualitative and subjective, but by providing a common basis for understanding what it would take to achieve a particular level of score for each category, it is possible to analyze the potential success of each tool.
21
has practical applicability to the financing of adaptation infrastructure projects in those jurisdictions.
Third, the results were compiled in order to share our findings on the tools currently in use in Canada, or that have potential for use in financing urban infrastructure adaptation.
The report is structured as follows: In the next section (II), we briefly review global and Canadian-specific climate change literature. Issues pertaining specifically to adaptation and the role of resilient infrastructure are discussed in Section III. Section IV discusses paying for adaptation in the Canadian context and provides a summary of the tool evaluation criteria, research results, and best practices. The tools are examined in detail from section V to VII: Section V explores internal financing and funding tools, Section VI
discusses external revenue sources, and Section VII discusses innovative instruments.
Section VIII explores the role of insurance and disaster financial assistance in incentivizing adaptation infrastructure. Section IX briefly examines considerations for planning adaptation infrastructure, followed by recommendations, areas for further research, and conclusions in Section X.
23
23
II. CANADIAN
CLIMATE CHANGE
24
II.1. A “Commitment” to Global Climate Change
Global and regional data records
show that
land surface air temperatures and sea surface
temperatures have both increased in the course
of the last century. Records also show that the
maximum and minimum temperatures over land
have increased since the mid 20
thcentury, and that
25
than any previous decade in recorded history (IPCC, 2014). Reductions in the volume of glaciers and ice sheets, combined with thermal expansion of the oceans, have led to a rise in global mean sea level.1 Records show that the rate at which global mean sea level
is rising has increased from 1.7 millimeters per year (mm/y) over the period 1901-2010 to approximately 3.2 mm/y over the period 1993-2010.
Looking to the future, the IPCC’s AR5 report confirms many findings of earlier assessment reports: we can expect further increases in temperature, further rise in sea levels, and greater frequency and/or higher intensity of extreme weather events.
AR5 reasserts the fact that near-term warming from past emissions is unavoidable: barring major volcanic eruptions and significant changes in solar irradiation, global mean surface temperature for the period 2016-2035 is likely to be 1-1.5°C above the average temperature observed over the period 1850-1900.2 Mitigation actions, even if strong and
immediate, do not produce different climate change outcomes for the next 30 years or so. Similarly, while there remains uncertainty as to the extent of sea level rise, (AR5 reports average sea level rise projections ranging from approximately 0.4-0.7 meters, with a maximum rise of 0.98 meters, by 2100), there remains no uncertainty as to the nature of the change: sea level will continue to rise for the forthcoming decades, if not centuries (Levermann et al., 2013; Meehl et al., 2012). This is generally referred to as the earth’s “commitment to climate change.” Plattner et al. (2008) and Solomon et al. (2009) show that increases in atmospheric temperature resulting from increased CO2 concentration
1 Domingues et al. (2008) estimate that thermal ocean expansion has contributed to approx. 40% of ob-served sea level rise over the period 1961-2003, with the melting of glaciers and ice caps contributing 35%, and large polar ice sheets of Greenland and Antarctica contributing approximately 25%. IPCC (2013) projects thermal expansion to be the single largest contributor to sea level rise in the 21st cen-tury. However, as warming continues, melting and dynamic changes in the Greenland and Antarctic ice sheets are projected to become dominant contributors to sea level rise (Hanna et al., 2013; King et al., 2012; Nick et al., 2013 and Rignot et al., 2011).
2 Important sources of uncertainty with respect to projected global mean temperatures pertain to the future role of land and oceans in acting as carbon sinks (Canadell et al., 2007), as well as the possi-ble release of large quantities of methane, a more potent GHG than CO2, from thawing permafrost (DeConto et al., 2012). Climate sensitivity – the estimated change in global equilibrium mean surface temperature as a response to changes in radiative forcing following a doubling of atmospheric con-centration of carbon dioxide – remains a critical source of uncertainty when projecting future global temperatures (Rogelj et al., 2012; Rohling et al., 2012).
26
are largely irreversible up to 1,000 years after emissions cease.
While a global temperature increase of 2°C has been defined as “dangerous anthropogenic interference” with climate systems, the likelihood of limiting global warming to less than 2°C is considered to be very small as it would require immediate and deep cuts in global emissions (UNFCCC, 2009a).
It is generally estimated that achieving such a targeted limit on the increase in global temperature will require stabilizing GHG concentrations at less than 450 parts per million (ppm) of carbon dioxide equivalent (CO2eq) (IPCC, 2007).3 It is worth noting that the
atmospheric concentration of carbon dioxide (CO2) increased by 2.10 ppm in 2011 (Blunden & Arndt, 2012), and exceeded 400 ppm for the first time since instrumental records began. Signatories to the Copenhagen Accord at the UNFCCC’s Convention of Parties held in Copenhagen in 2009 recognized that achieving such stabilization would require large reductions in CO2 emissions:
We agree that deep cuts in global emissions are required according to science, and as documented by the IPCC Fourth Assessment Report, with a view to reduce global emissions so as to hold the increase in global temperature below 2 degrees Celsius, and take action to meet this objective consistent with science and on the basis of equity. (UNFCCC, 2009b)
Ramanathan and Xu (2010) estimate that, if CO2 emissions were to peak in 2015 and remain at that level until 2100, then the atmospheric concentration of CO2 would exceed 550 ppm by 2100. The authors estimate that maintaining GHG concentrations at less than 450 ppm requires a reduction in emissions in the range of 50% by 2050, and 80% before 2100. As pointed out by numerous authors (e.g., Kharecha & Hansen (2008), Matthews
3 “Ppm” (parts per million) is the standard measure of GHG concentrations in the atmosphere. There are numerous GHGs. The three most potent gases are carbon dioxide (CO2), methane (CH4) and nitrous oxide (N2O), each of which has a different global warming potential. Methane has 25 times the global warming potential of CO2, nitrous oxide 298 times. CO2 equivalent represents the con-centration of CO2 alone that would give an equivalent radiative forcing to that provided by a basket of anthropogenic GHGs. Despite the greater warming potential of CH4 and N2O, CO2 remains by far the largest contributor to global warming as a result of being discharged in the atmosphere in much larger quantities.
27
& Caldeira (2008), Lackner et al. (2012)), not only would emissions from coal have to cease by 2050, but emissions from all other fossil fuels would also have to be significantly reduced. Beyond 2050, CO2 emissions would have to continue to fall and approach zero by 2100 in order to achieve the required stabilization of CO2 concentration.
Nordhaus (2010), Rogelj et al. (2012) and numerous other studies now conclude that it is unlikely that the Copenhagen temperature target of 2°C will be attained, even if countries meet their ambitious (but voluntary) objectives under the Accord. Joshi et al. (2011) estimate that, in higher GHG emission scenarios, the global average 2°C warming threshold is likely to be crossed by 2060. Peters et al. (2013) note that the latest CO2 emissions continue to track the high end of emission scenarios and that a shift to a 2°C pathway requires immediate significant and sustained global mitigation, with a probable reliance on net negative emissions in the longer term.
A recent World Bank report notes that, without further commitments and action to reduce GHG emissions, the world is likely to warm by more than 3°C (World Bank, 2012). The same report notes that “present emission trends put the world plausibly on a path toward 4°C warming within the century.”
Smith et al. (2011) argue that, given the likelihood of exceeding 2°C and reaching an increase of 4°C, adaptation to climate change “needs to be re-conceptualized away from the incremental handling of residual risk to preparing for continuous (and potentially transformational) adaptation.”
“While a global temperature increase of 2°C
has been defined as “dangerous anthropogenic
interference” with climate systems, the likelihood
of limiting global warming to less than 2°C is
considered to be very small as it would require
28
Crucial to understanding the nature and extent of the adaptation challenge is recognition of the projected significant increase in energy demand over the period 2010-2035. Primary energy consumption from OECD and non-OECD countries is expected to increase by approximately 45% and 220% respectively. Furthermore, by 2035, approximately 80% of total energy demand will continue to be supplied by fossil fuels, only slightly down from 84% in 2005 despite rapid increases in both nuclear and renewable sources of energy (IEA, 2011). World oil production capacity alone is projected to increase from the existing 93 million barrels per day (mbd) to approximately 110 mbd by 2020 (Maugeri, 2012). As a result, annual global CO2 emissions are projected to increase from approximately 33 million metric tons in 2010 to 43 million tons in 2035 (IEA, 2011). A large share of this increase is projected to take place in non-OECD countries.
Hence, far from stabilizing GHG emissions at any given level sufficient to avoid dangerous interference with climate systems, concentrations of GHG emissions are projected to continue to increase well into the first half of the 21st century.
As a result, while mitigation must remain an important objective to avoid catastrophic climate change, there is significant empirical evidence to support a strong emphasis on adaptation.
II.2 Climate Change in Canada
Along with global climate change, Canada’s climate is changing, with observed shifts in air temperature, precipitation, snow and ice cover and other indicators. Further changes in climate are inevitable (Warren et al., 2014, Table 1).
As a result of its significant impacts, the damages caused by climate change are also increasingly becoming evident. Estimates by Swiss Re (2014) show that global annual insured losses due to extreme weather events (especially extreme precipitation) have increased from around $6 billion in the 1980s to around $30 billion in the 2000s. In the US, the Federal Emergency Management Agency (FEMA) estimates that 20-25% of flood-related insurance claims stem from stormwater damages (2011), and correspond to an annual minimum loss of $250 million.
29
CLIMATE
SYSTEM OBSERVED TRENDS PROJECTED TRENDS
Temperature The annual average surface air temperature over the Canadian landmass has warmed by 1.5°C over the period 1950-2010.
The frequency of warm days has increased, while the frequency of cold nights has decreased since 1950.
Increases in the frequency and magnitude of unusually warm days and nights and decreases for unusually cold days and nights are
projected to occur throughout the 21st century.
The length, frequency and/or intensity of warm spells, including heat waves, are projected to increase over most land areas, including Canada. Rare heat extremes are currently projected to become more frequent. For example, a one-in-20-year day of extreme heat is projected to become about a one-in-five year event throughout most of Canada by mid-century.
Precipitation Canada has generally become wetter in recent decades.
In several regions of southern Canada, there has been a shift in precipitation type, with decreasing snowfall and increasing rainfall.
More frequent heavy precipitation events are projected, with an associated increased risk of flooding.
Historically rare extreme precipitation events are projected to become about twice as frequent by mid-century over most of Canada. Permafrost Permafrost temperatures
at numerous borehole sites across Canada have increased over the past two to three decades.
Warming of the permafrost is projected to continue at rates surpassing those observed in records to date. However, low average temperatures of much of the permafrost in the Arctic mean it will take decades to centuries for colder permafrost to completely thaw.
30
Ocean Relative sea level rise of over three mm/y has been observed on the coastline of Atlantic Canada and the Beaufort Sea coast, with lower amounts along Pacific coastlines. Long-term changes in ocean temperature (increasing), salinity (variable sign), and acidity (increasing) have been observed in all three of Canada’s oceans. Long-term decreases in subsurface dissolved oxygen levels have also been
observed in the Atlantic and Pacific oceans off Canada.
Estimates of the magnitude of future changes in global sea level by the year 2100 range from a few tens of centimeters to more than a meter. BC provincial government projects 1.2 meters of SLR by 2100.
Patterns of change along Canadian coastlines will continue to be influenced by land uplift and subsidence as well as by changes in the oceans. Sea-level rise will continue to be enhanced in regions where the land is subsiding, and sea level is likely to continue to fall in regions where the land is rapidly rising. Regions where the land is slowly rising may experience a transition from sea level fall to sea level rise.
Sea ice End-of-summer minimum ice
extent has declined at a rate of 13% per decade from 1979-2012, while maximum winter sea ice extent has declined at a rate of 2.6% per decade.
A nearly ice-free summer is considered a strong possibility for the Arctic Ocean by the middle of the century, although summer sea ice may persist longer in the Canadian Arctic Archipelago region.
31
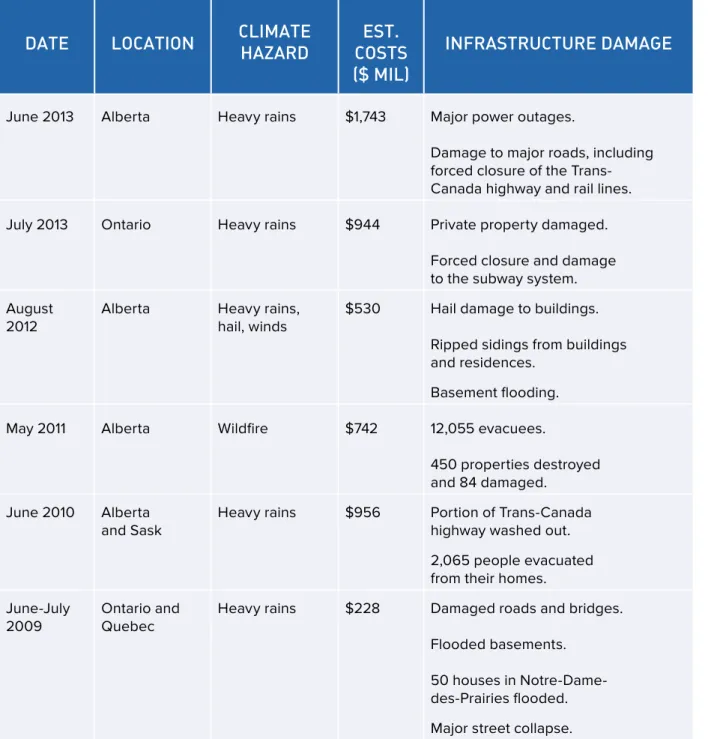
Bureau of Canada (IBC) calculated the trend in catastrophic losses related to extreme weather events over the last 30 years (Figure 1) and found that, on average, annual losses were “stable” at $400 million a year in the period 1983-2008. Over the last five years, however, annual losses have surged to above $1 billion in insurable damages (Table 2). It should be noted that these numbers do not include damages from residential overland flooding.
Figure 1: Catastrophic Losses in Canada 1983-2013
1983 1986 1989 1992 1995 1998 2001 2004 2007 2010 2013 $.0.00 $3.50 $3.00 $2.50 $2.00 $1.50 $1.00 $.50 -$.50 Years $ Billions
32
Table 2: Insured Costs of Selected Weather-Related Disasters in Canada
DATE LOCATION CLIMATE HAZARD COSTS EST. ($ MIL)
INFRASTRUCTURE DAMAGE
June 2013 Alberta Heavy rains $1,743 Major power outages.
Damage to major roads, including forced closure of the Trans-Canada highway and rail lines.
July 2013 Ontario Heavy rains $944 Private property damaged.
Forced closure and damage to the subway system. August
2012 Alberta Heavy rains, hail, winds $530 Hail damage to buildings. Ripped sidings from buildings and residences.
Basement flooding.
May 2011 Alberta Wildfire $742 12,055 evacuees.
450 properties destroyed and 84 damaged.
June 2010 Alberta
and Sask Heavy rains $956 Portion of Trans-Canada highway washed out. 2,065 people evacuated from their homes.
June-July
2009 Ontario and Quebec Heavy rains $228 Damaged roads and bridges. Flooded basements.
50 houses in Notre-Dame-des-Prairies flooded. Major street collapse.
3 3
August
2005 Southern Ontario Wind/rainstorm $625 Collapse of Finch Avenue (major thoroughfare).
Damage to two high-pressure gas mains, and a portable water main. Damage to telephone, hydro and cable service lines. June 2005 Southern
Alberta Flooding >$400 Sewer backup.
Roads, parks, sewers, bridges, buildings, agriculture affected.
SOURCE: ADAPTED FROM ALEXANDER & MCDONALD (2014)
In the absence of adaptation, it has been estimated that climate change may cost Canadians approximately $5 billion per year by 2020, and between $21-$43 billion by 2050 (NRTEE, 2011). As we have noted and demonstrated, these rising costs are already evident.
III. ADAPTATION TO
CLIMATE CHANGE
36
III.1 The Cost of Adaptation
Recent years have witnessed development
of a large number of studies and reports providing
estimates of the economic costs of both climate
change and the costs of the actions required for
adaptation, which are generally presented as the
investment necessary to restore an estimated
baseline reference of development.
37
A 2010 World Bank study represents an influential example of such studies at the global level, with estimates of the global annual cost of adaptation ranging between $70-$100 billion up to 2050 (in 2005 prices).1 Following a similar methodology, annual
adaptation costs have been estimated to reach approximately $40 billion in Asia and the Pacific over the period 2010-2050. The Asia Development Bank (ADB) (2009, 2013b, 2014b) and Westphal et al. (2013) represent other examples of such analysis at the regional level. Parry et al. (2009) note the vast discrepancy in methods, as well as in geographical and sectorial coverage, across the existing set of analyses, resulting in a large range of estimates of the economic costs of climate change and of adaptation.
The above studies and numerous others present estimates of adaptation costs at the global, regional, or national levels. However, only a few studies have examined adaptation issues at local and municipal levels.
III.2 Adaptation and Climate Resilience at the Local
Government Level
The impacts of a changing climate are already leading local governments around the world to take action on adaptation to emerging hazards. Many local governments around the world and in Canada have already begun taking action to reduce vulnerability to the effects of climate change.
Table 3 identifies common climate triggers in Canada, related hazards, local responses to mitigate the impacts of those hazards, and case study examples of cities that have implemented one or more of the identified responses. “Climate trigger” refers to the impacts or effects of climate change that produce environmental or social hazards that require infrastructure responses at the local scale. “Climate hazard” refers to impacts that have the potential to negatively affect human populations. “Reponses” refers to specific infrastructure measures that reduce damage resulting from these hazards, and may provide dual mitigation and adaptation benefits. Last, Table 3 identifies selected cities that
38
have implemented the responses identified in the table; these case studies are examined in more detail throughout the report.
Table 3: Canadian Climate Change Triggers, Hazards, Responses, and
Global Case Studies
CLIMATE
TRIGGERS HAZARDS RESPONSE CASE STUDY
Hotter, drier summers,
and heat waves Health and safety impacts to vulnerable populations, water supply shortages, shortened lifecycle of transportation infrastructure, increased risk of forest fires
Green/cool roofs Urban forests Flexible pavement Toronto Edmonton Quebec Increased intensity and frequency of heavy rain events
Surface water flooding, sewer backups and overflows, landslides Permeable pavement Separated sewers Natural wetland preservation Kitchener/Waterloo Vancouver Copenhagen Toronto (Corktown Commons)
Sea level rise and increased storm surges
Increased flooding in coastal areas, coastal property damage/ loss, increased shoreline erosion
Sea walls Dikes Near-shore buffer areas Netherlands New York
Extreme storms Increased ice storms, hurricanes,
hail, windstorms, and tornadoes Window protection on buildings Back-up power
Florida Toronto
39
Permafrost
degradation Ground and slope instability and buckling, reduced strength and reliability of physical infrastructure Vulnerability mapping of current infrastructure built on permafrost Ongoing monitoring of road infrastructure Northwest Territories
SOURCE: ADAPTED FROM: BIZIKOVA ET AL. (2008); BOYLE ET AL. (2013); NORTHWEST TERRITORIES (2008); AND RICHARDSON, G. R. A. (2010).
III.3 Canadian Infrastructure Deficit
It is widely acknowledged that Canadian municipalities face a major infrastructure deficit (Hanniman, 2013; FCM, 2012; Mirza & Haider, 2003). This significant long-term deficit in infrastructure improvements has left systems vulnerable. For example, in some areas of the country, the current storm and sanitary sewer infrastructure is simply unable to handle the increasing frequency and severity of rain events.
The Canadian Infrastructure Report Card2 is an assessment of the condition of municipal
infrastructure between 2009 and 2010 that analyzed responses from 123 municipalities across all provinces and extrapolated the results to create a national picture (Félio, 2012). The full report card examines four primary asset categories of municipal infrastructure: (1) drinking water systems; (2) wastewater infrastructure; (3) stormwater networks, and (4) roads. Overall, the report card ratings for the four asset categories show that, on average,
2 Report created by Félio (2012) for the Canadian Society for Civil Engineering (CSCE), the Canadian Public Works Association (CPWA), the Canadian Construction Association (CCA) and the Federation of Canadian Municipalities (FCM).
4 0
30% of municipal infrastructure ranks between “fair” and “very poor.” The replacement cost of these assets alone totals $171.8 billion nationally, or $13,000 per Canadian household (Félio, 2012).
The Canadian Infrastructure Report Card findings examine infrastructure service life under current practices (investment, operations, maintenance). However, the report fails to analyze the implications of future climate change projections or incorporate issues associated with projected climate change impacts. Issues such as increased extreme weather events exceeding system capacity will further shorten infrastructure lifespans, suggesting that the deficit may in fact be even more profound.
III.4 The Economic Case for Adaptation
The need to build a detailed business case when working to build resilience is important to local governments as they are pressured on many sides to be as cost-effective as possible, providing the highest amount of services for the least amount of taxes. Local governments must ask: Do we spend our money in a cost-effective manner? The business case therefore becomes an important tool, as economics is a question of prioritizing scarce resources and, by designing for multiple benefactors, local governments can create value through smart investments.
Local governments must have a clear understanding of the anticipated climate change impacts to analyze the costs of inaction. This involves assessing geographical areas at risk from climate hazards, understanding expected damages, and identifying infrastructure, housing, businesses, etc. that may be affected. ICLEI Canada (Local Governments for Sustainability) provides a framework that local governments can use to carry out this assessment: the Building Adaptive and Resilient Cities (BARC) tool. In addition, it is important that all costs associated with extreme weather events are calculated, including socio-economic impacts such as loss of production, supply chain interruption, unemployment from destroyed or bankrupt businesses, loss of biodiversity and green infrastructure, loss of housing price value, lost tax revenue, etc. Unless a full understanding is created based upon the costs of inaction, the design of the solutions will be skewed and will tend to favour isolated parts of local governments’ areas of responsibility.
41
Based upon this detailed understanding of the costs of inaction, local governments can create impact assessments to identify benefits to each sector that may experience losses due to extreme weather events. Adaptation solutions can then be prioritized in a cost-benefit analysis, which will show where the local government can achieve the best return on investment for stakeholders.
Thinking through investments
from a strategic and holistic
perspective will aid local
governments in minimizing
and sharing the costs of
construction, as well as
increasing benefits.
Once local governments have established a comprehensive estimate of the costs and benefits to specific sectors, they have a business case to present to stakeholders who may benefit from the actions, and therefore may have an interest in becoming co-financiers of the solution. For example, in terms of extreme precipitation management, developers
42
may see advantages in the use of integrated blue-green resilient solutions that provide attractive green neighbourhoods, rather than an underground piped solution that does not provide any visible benefit. This approach considers the benefit to the physical, social, and cultural capital of the neighbourhood. Renovation of city streets geared to adaptation can be done in concert with other maintenance work or installation of fibre optics, district heating, gas pipes, or other large infrastructure, thus allowing the local government to share costs between departments and save capital, as well as minimize disruption to traffic flow and noise pollution from construction.
Thinking through investments from such a strategic and holistic perspective will aid local governments in minimizing and sharing the costs of construction, as well as increasing benefits.
Once having identified the costs, benefits and appropriate stakeholders, as well as the financial instruments that will be most beneficial to the project, planning financing for the project can proceed. It is clear that the cost of doing nothing is severe and desperately needs to be managed (City of Vancouver, 2012); where no action has yet been taken, the risks urgently need to be evaluated. However, we must ask whether the benefits of adapting will outweigh the costs required.
In the following section, we highlight cases from around the world in which adaptation has been either started or is fully implemented. We also briefly illustrate some benefits of adapting to a changing climate that may not be obvious at first glance.
III.5 Cost/Benefit Considerations
The simplest way to demonstrate the benefits of climate change adaptation is to measure whether the direct investment costs are outweighed by the projected prevented damages. The economic benefits of these prevented damages can be compared to the capital, operational and maintenance costs of the adaptation measure. Swiss Re published a report in 20093 on the economics of climate change adaptation called “Shaping
Climate-3 Together with the Climate Works Foundation, Global Environment Facility, the European Commission, McKinsey & Co., The Rockefeller Foundation, and Standard Chartered.
4 3
Resilient Development: A Framework for Decision-Making,” which outlines a cost=benefit analysis for eight case studies showing that the benefits outweigh the costs (Swiss Re et al., 2009). In Florida, for instance, flooding from hurricanes currently poses the risk of an annual loss of $17 billion4 that is expected to increase to $30-$33 billion by 2030.
These figures take into account damages from windstorms, storm surges, rainstorms, increasing economic growth, and a changing climate. Interestingly, the measures with the lowest cost-benefit ratio are the measures that handle water through natural blue-green infrastructure (BGI) elements, whereas more expensive measures fall within the classic grey infrastructure investments.
The City of Copenhagen has developed measures to adapt to increasing precipitation in what they called their Cloudburst Adaptation Plan, which outlines how avoided damages exceed the cost of adaptation, but only up to a certain point (Copenhagen, 2013). Following the same procedure as Swiss Re, the cost-benefit analysis by Copenhagen shows that it is only economically viable to prevent a certain amount of damages; in response, Copenhagen has settled for a security level that can prevent damages from a 100-year event. This conclusion was reached by analysing the cost of initiatives to prevent damages at certain security levels, compared with estimated costs of prevented damages up to a 400-year event. The results showed that, as the level of security increases, so does the cost of adaptation. When the cost of adapting becomes higher than the prevented damages, the incentive to act is reduced.
Copenhagen found that the total benefit to society of the BGI-based solution that it selected was $90 million more than that of the grey infrastructure solutions, partly due to the lower cost of BGI, but not entirely. The total socio- and environmental-economic benefits of Master Plan (MP) 1 were conservatively estimated at $300 million (Leonardsen, 2013). Table 4 below shows estimates from the socio-economic costs and benefits for MP1 and MP2, as analyzed in Copenhagen’s Cloudburst Adaptation Plan.
4 4
Table 4: Socio-economic Costs and Benefits of MP1 and MP2 (NPV million
EUR)
ITEMS MP1 (BGI) MP2 (GREY
INFRASTRUCTURE)
Air pollution 22 21
Real estate taxes 42 42
Insurance damages 320 349
Real estate value 151 150
Renewal/upgrade savings 96 96
Municipal investment -75 -71
Utilities investment -260 -368
Municipal operational costs -96 -72
Utilities operational costs -58 -68
Total Benefit 142 78
SOURCE: LEONARDSEN (2013)
III.6 Value of Blue Green Infrastructure (BGI)
Infrastructure renewal and upgrades, and new development, are all key actions for cities adapting to climate change (American Rivers, 2012). However, using BGI provides additional benefits, for instance:
• Lower capital, operational and maintenance costs by as much as 75% • Fewer land acquisitions due to smaller footprint
4 5
• Reduction in energy demand in buildings through use of green roofs; cooling effect of trees on neighbourhoods
• Cleaner environment • Enhanced biodiversity
The City of Virginia’s 33,640-acre park system illustrates the enormous added value of BGI, as it is estimated to provide a total of $700 million per year in benefits to society, of which stormwater management cost represents less than one percent (Trust for Public Land, 2011). Likewise, research in cities such as Philadelphia and Denver shows that stormwater management is low on the total contribution of BGI to the social and environmental economics of society (Trust for Public Land, 2008, 2010). Overall, the total annual benefit of BGI in these cities was found to be in the range of $500-2,000 million.
International engineering consulting firm ARUP has identified 24 additional social and environmental benefits of BGI, categorized into three groups: environmental, economic and social, with each group containing eight benefits (Table 5). In relation to health care costs, for instance, ARUP indicates that green spaces deliver social and health benefits of up to £1.44 billion per year for the UK economy. It also found that people living in close proximity to green areas (e.g., trees on streets or in parks) reported lower levels of mental distress and had a higher degree of life satisfaction compared to people living in areas without greenery (ARUP, 2014).
There are therefore demonstrable benefits from investing in BGI. However, there is a need to develop a business case to identify who benefits, and showcase how blue/green climate change resilient infrastructure is beneficial, not only in preventing damages, but also in improving the liveability of a region.
4 6
Table 5: Environmental, Economic and Social Benefits of BGI-based
Adaptation at Local Levels
ENVIRONMENTAL
BENEFITS ECONOMIC BENEFITS SOCIAL BENEFITS
Improved visual amenity Increased property prices Encouraging physical activity Enhanced urban microclimate Increased land values Improved childhood development Improved air quality Faster property sales Improved mental health
Reduced flood risk Encouraging inward investment Faster hospital recovery rates Better water quality Reduced energy costs Improved mental health Improved biodiversity Improved chances of gaining
planning permission Improved workplace productivity Reduced ambient noise Improved tourist and
recreation facilities Increasing social cohesion Reduced CO2 concentration Lower healthcare costs Reduction in crime
IV. PAYING FOR
ADAPTATION:
THE CANADIAN
4 8
Planning for resilient infrastructure
at local
levels offers innovative opportunities for climate
change adaptation. Local governments typically have
authority over the selection of infrastructure projects
made at the municipal level, as well as over land use
decisions, which may in turn determine infrastructure
needs and associated investment requirements.
49
financing should be connected to long-term land use planning, and should take place in that context.
Simultaneously, local governments are typically confronted with a severe deficit of infrastructure financing. Planning payment for climate change adaptation investments may therefore require consideration of new financing options. According to a recent survey of 468 cities in OECD and non-OECD countries, most cities (approximately 60%) do not receive any external financial support for their adaptation actions; 24% identify the national level of governments as the most common source of financial support for adaptation; and 8% report support from private foundations and non-profit organizations (Carmin et al., 2012).
A 2014 survey of 481 local governments across Canada found that all of Canada’s larger cities (those with populations greater than 500,000) are engaged in adaptation planning. However, smaller communities were in general less likely to be planning for adaptation; in fact, despite widespread experience with severe weather, many Canadian communities are not yet planning for adaptation (NMAP, 2014).
A 2010 survey found that the costs of adaptation were “the most significant barrier to taking climate change into account in decision making” for over half of municipal government respondents (Environics Research Group, 2010). In the academic literature on climate change action in Canada, limited financial resources are often cited as one of the principal barriers to adaptation (Amundsen et al., 2010; Burch, 2010). As indicated in Appendix 4, the costing and financing of climate change action plans at local levels appear to be significant barriers, as these have rarely been implemented to date.
Numerous policies and instruments are available to local governments that wish to increase investment in climate resilient infrastructure, however. A review of the literature suggests the following three overall messages:
First, public sector financing of resilient infrastructure may require giving lower levels of government greater access to public sources of revenue. This may be achieved by expanding taxation authority in order to increase autonomous sources of revenue. Simultaneously, transfer programs from national or provincial to local governments could be designed to incentivize investments in climate change adaptation in general, and climate resilient infrastructure in particular. A variety of states in Brazil, Germany and India,
50
for example, have introduced environmental criteria to allocate state tax shares to local governments. Alternatively, national government can facilitate access to municipal green bonds through tax exemptions and subsidies.
Second,it is clear that public sector financing will not be sufficient to fund all climate change adaptation measures at local levels, especially where local levels of government are already facing infrastructure deficit. In this regard, private sector investment will be required. A key role of national governments is to ensure that policies are conducive to, and incentives are compatible with, the creation of a suitable environment for private investment in resilient urban infrastructure.
Third, gaining public buy-in is a key aspect for any resilient infrastructure project. Local council ultimately approves most local funding, which relies on local votes; therefore, having public buy-in and support for adaptation is critical, regardless of the financing approach.
The tools that we found to
be the most effective are
financing tools, traditional
property tax, and outside
revenue streams.
51
INTERNAL REVENUE
• Federal Gas Tax • Intergovernmental Grants • Public-Private Partnerships (P3) • CARIP Grant (BC Only) • Carbon Fund EXTERNAL
REVENUE INNOVATIVE PROGRAMS
• Financing • Borrowing • Reserve Funds • Climate/Green Bonds • Tax Increment Fiancing • Funding • Property Taxes • Tax Levy • Local Improvement Charge (LIC) • User Fees • Development Cost Charges • Local Incentives and Rebates • LIC Financing • Density for Benefit
Agreements • Natural Area Tax
Exemption
IV.1 Finance Tools
Our study examines 18 finance tools, listed below, that have the potential to address adaptation infrastructure finance challenges. The tools were evaluated using the criteria presented in Table 6, and are explained in detail in sections V-VII, including an explanation of each tool, the benefits and limitations of its use, the implementation or design of the tool, applicability to adaptation infrastructure, case studies, and a summary of the feasibility of its use by the CoV and CVRD.
IV.2 Tool Evaluation Methodology
Each tool was evaluated based upon seven objectives and 12 criteria. A scale of high, medium and low was used to rank each tool, based on its deemed ability to achieve the
52
goals and objectives reflected in the chosen categories. Table 6 illustrates the criteria and ranking used to evaluate each tool. The rating reflects how the tool scores in comparison to the others. The tools were evaluated in a table format (see Appendix 6) and each result was colour-coded to indicate how the tool ranked in each criterion section.
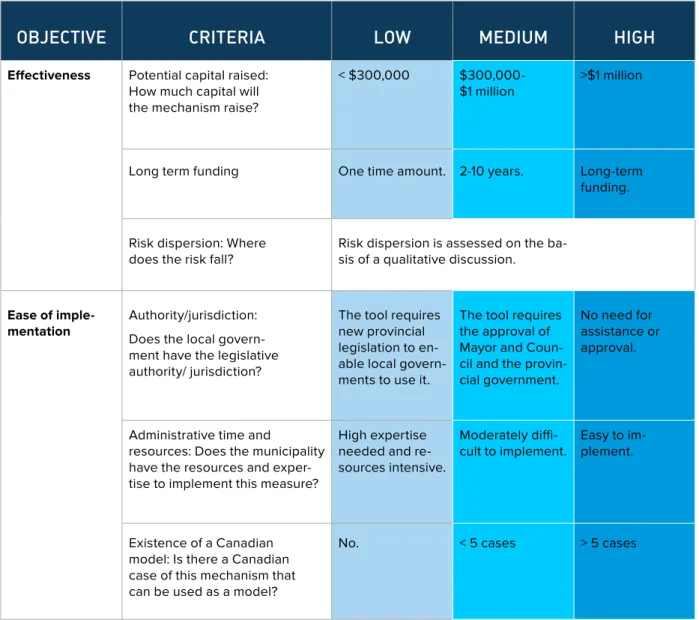
Table 6: Evaluation Chart: Objectives and Criteria
OBJECTIVE CRITERIA LOW MEDIUM HIGH
Effectiveness Potential capital raised: How much capital will the mechanism raise?
< $300,000
$300,000-$1 million >$1 million
Long term funding One time amount. 2-10 years. Long-term funding.
Risk dispersion: Where
does the risk fall? Risk dispersion is assessed on the ba-sis of a qualitative discussion.
Ease of
imple-mentation Authority/jurisdiction: Does the local
govern-ment have the legislative authority/ jurisdiction?
The tool requires new provincial legislation to en-able local govern-ments to use it.
The tool requires the approval of Mayor and Coun-cil and the provin-cial government.
No need for assistance or approval.
Administrative time and resources: Does the municipality have the resources and exper-tise to implement this measure?
High expertise needed and re-sources intensive.
Moderately
diffi-cult to implement. Easy to im-plement.
Existence of a Canadian model: Is there a Canadian case of this mechanism that can be used as a model?
5 3
Public
ac-ceptance Accountability: Is there a clear link between the tool and the project?
No clear link between tool and project. Less defined link between tool and project. Clear link between tool and project. Communicability: How complex is the mechanism to explain?
Very complex and difficult to communicate.
Moderately
complex. Simple and easy to com-municate.
Equity Benefits-received princi-ple: Are the payers also those who benefit?
Charge is not related to ser-vice received.
Charge based
on access. Charge is based on use.
Equity: Will any group
be unfairly burdened? Some groups are unfairly burdened by charge. Yes. But actions can be taken to re-duce burden. No groups are unfairly burdened. Intergenerational equity: Is there fairness in timing of costs and benefits?
Charges will fall dispropor-tionately on the present or future generation. Charges are moderately distribut-ed across generations. Charges are fairly distrib-uted across generations.
Flexibility Flexibility of tool: Can the tool be adapted to suit changing project needs or other projects?
No flexibility. Moderate
limitations. No limitations.
Incidence Incidence: Who bears the
final burden of the charge? Incidence is assessed on the ba-sis on a qualitative discussion.
Political will Political will: To what extent is there political will to legislate or require action?
Political will is assessed on the ba-sis on a qualitative discussion.
The rating given to each tool reflects how the tool performs in relative comparison to the others. The categories are qualitative and subjective criteria, but by providing a common basis for understanding what it would take to achieve a particular level of score for each category, it is possible to analyze the potential success of each tool with less variability in results.
5 4
IV.3 Summary of Results
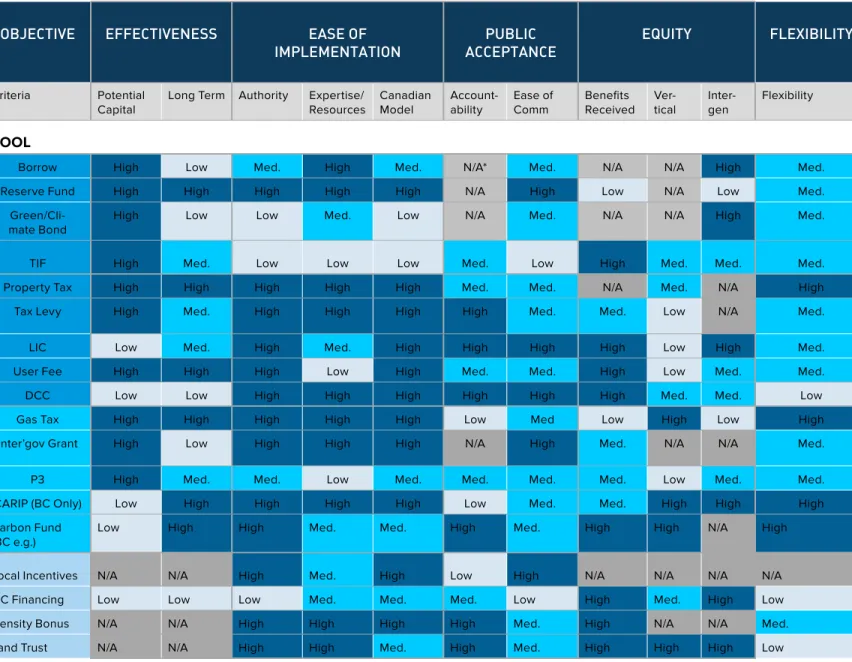
Table 7: Summary of Evaluation
OBJECTIVE EFFECTIVENESS EASE OF
IMPLEMENTATION ACCEPTANCEPUBLIC EQUITY FLEXIBILITY
Criteria Potential Capital
Long Term Authority Expertise/ Resources Canadian Model Account-ability Ease of Comm Benefits Received Ver-tical Inter-gen Flexibility TOOL
Borrow High Low Med. High Med. N/A* Med. N/A N/A High Med. Reserve Fund High High High High High N/A High Low N/A Low Med.
Green/Cli-mate Bond
High Low Low Med. Low N/A Med. N/A N/A High Med. TIF High Med. Low Low Low Med. Low High Med. Med. Med. Property Tax High High High High High Med. Med. N/A Med. N/A High Tax Levy High Med. High High High High Med. Med. Low N/A Med. LIC Low Med. High Med. High High High High Low High Med. User Fee High High High Low High Med. Med. High Low Med. Med. DCC Low Low High High High High High High Med. Med. Low Gas Tax High High High High High Low Med Low High Low High Inter’gov Grant High Low High High High N/A High Med. N/A N/A Med. P3 High Med. Med. Low Med. Med. Med. Med. Low Med. Med. CARIP (BC Only) Low High High High High Low Med. Med. High High High Carbon Fund
(BC e.g.)
Low High High Med. Med. High Med. High High N/A High Local Incentives N/A N/A High Med. High Low High N/A N/A N/A N/A LIC Financing Low Low Low Med. Med. Med. Low High Med. High Low Density Bonus N/A N/A High High High High Med. High N/A N/A Med. Land Trust N/A N/A High High Med. High Med. High High High Low
* N/A INDICATES NOT MEASURABLE. RISK DISPERSION, INCIDENCE AND POLITICAL WILL ARE NOT INCLUDED IN THIS TABLE AS THEY WERE ANSWERED QUALITATIVELY. FULL ASSESSMENTS CAN BE FOUND IN APPENDIX 6.
55
IV.4 Evaluation Criteria and Best Practice Tools
Effectiveness
It is widely noted in the literature that there is a need for reliable, predictable, and dedicated funding to support multi-year infrastructure investment strategies. In addition, maintenance and upgrades are a crucial aspect of infrastructure resilience. Each financial tool is assessed in terms of its capacity to provide sufficient upfront capital for resilient infrastructure projects and/or provide sustainable funding for the operation, maintenance, and upgrading of such projects, if needed.
The tools that we found to be the most effective are financing tools, traditional property tax, and outside revenue streams. This in part reflects the difficulty local governments face in attempting to access new sources of revenue, such as charging fees for a new service previously included in property tax. Tools that fall in the category of “innovative programs” are the least effective by this measure, because they do not generate new revenue, but instead provide cost saving opportunities for the local government.
Two relatively untested but promising tools are green bonds and public private partnerships (P3s). Both tools have the ability to capitalize on private investment to help raise the large sums of capital that may be required for large adaptation projects.
Ease of Implementation
We evaluate each financial tool based on the administrative burden associated with its implementation, and whether or not local governments have the legislative authority to implement it. A financial tool facing high legislative barriers is less likely to be used. Similarly, a tool requiring significant resources and expertise is less likely to be adopted or, if adopted, is less likely to be effectively implemented.
In the Canadian context, it is important to note that local governments receive their power and authority from provincial statutes (such as Ontario’s Municipal Act, Alberta’s Municipal Government Act, and BC’s Local Government Act). Moreover, some municipalities have special charters giving them slightly different levels of authority (such as the cities
56
of Vancouver and Winnipeg). In addition to municipal acts, other specific statutes and regulations provide further powers to local governments (Thompson & Bevan, 2010). Therefore, there is significant variation in powers of local government over property taxation, fees and other financial mechanisms. In this regard, the possibility of learning from existing Canadian experience with a selected financial tool may be an important feature of financial planning. Lessons learned from implementation experiences by other municipalities may aid in the analysis of appropriateness of each tool for specific needs of each situation and location.
Tools that are already widely used in Canada, for example, reserve funds, tax levies, and intergovernmental grants, scored highest in this category. There may be a trade off between ease of implementation and flexible use, however, as it can be difficult to be innovative with existing tools. Finally, ease of implementation is a category that can be improved upon through changes in legislation or collaboration with other levels of government or outside consultation.
Public Acceptance
For a funding mechanism to be successful, it is necessary to establish “buy-in” from the public. To establish buy-in, a tool should be both accountable and communicable.
Accountability requires that the design of the financial instrument be clear to taxpayers and that the link between the beneficiaries of a government service and payment for that service be tight (Kitchen, 2006). Communicability refers to how easy it is to communicate how the tool works to the public. There can be a trade-off between the two, as highly accountable mechanisms may be complex and therefore more difficult to communicate.
Some of the case studies reviewed in this report indicate the importance of public acceptance, as certain user fees and tax levy initiatives were not implemented due lack of public support. Public acceptance hinges more on communicability than accountability. The tools that are reported as the easiest to communicate are reserve funds, local improvements charges, development costs charges, intergovernmental grants, and local incentives.
57
Equity
Equity is evaluated through the distribution of the burden of financial instruments. Three principles are used:
1. The benefits principle states that the extent of taxes paid by individuals should be reflective of the extent of the benefits received.
2. The ability-to-pay principle states that the extent of taxes paid by individuals should be reflective of their financial capacity to pay.
3. While equity may be examined across groups within a given generation, it may also be examined across generations, as a financial instrument may shift financial bur-dens from current to future generations.
Given the long-term nature of climate impacts, borrowing, green/climate bonds, and tax incr