e d u c at i o n m a s t e r p l a n
education master plan
c o m m u n i t y
c o l l e g e
d i s t r i c t
r e v i s e d d r a f t: m ay 2 0 1 2
s o l a n o
The Solano Community College District (SCCD) Educational Master Plan (EMP) establishes a framework to guide SCCD educational program development through the year 2025. This document will serve as a roadmap for programmatic directions, resource allocation and overall educational innovations.
The overarching purpose of the Educational Master Plan is to advance SCCD’s Strategic Plan goals and educational programs through a set of integrated strategies designed to achieve programmatic, resource and service-related goals. In addition, the EMP informs the Facility Master Plan, Technology Plan, Staffing Plan and budget priorities for the District. This plan was developed based on administration, faculty, staff and community input, analysis of student and business and community needs, and assessment of current programs and related student support services.
Background
The EMP is an important element of SCCD’s long range planning, joining the Facility Master Plan and Technology Plan to complete the SCCD’s strategic planning process. These key planning processes are critical to the District’s success in effectively serving its growing and changing communities.
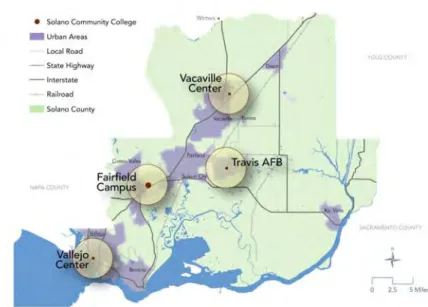
SCCD’s service area includes the cities of Benicia, Dixon, Fairfield, Suisun City, Vacaville, Vallejo and unincorporated areas in Solano County, and Winters in Yolo County. The main Solano Community College campus is located in Fairfield, with three education centers in Vacaville, Vallejo and Travis Air Force Base.
Since the last EMP update in 2007, local population growth and growth in the regional and State economies have slowed. At the same time, the State has called on California’s community colleges to refocus its mission towards strengthening basic skills, transfer opportunities, and career and technical education. The policy and programmatic direction presented in this plan reflects these changes.
Plan Overview and Organization
The Educational Master Plan is organized in the following sections:
I. Introduction
The first section of the Plan provides an overview of the plan development process, plan components, and the context for strategic planning related to SCCD educational programs and services.
II. Organizational Focus
This section outlines SCCD’s four mission areas and the rationale for heightened focus on basic skills, career technical education/workforce training and academic transfer. SCCD’s organization of services and programs, and its organization by academic schools, are also summarized. Additionally, this section provides an overview of SCCD’s organizational and shared governance structures.
III. Planning Framework
SCCD’s vision for the future, its core values, and the goals, strategies and planning principles will guide the District’s programmatic and educational policy approach to fulfilling its mission. This section restates the framework in place at SCCD to contextualize the Education Master Plan.
IV. Planning Environment
This section presents key findings from the Environmental Scan conducted for this process, including service area population and demographics; enrollment trends and student success rates at SCCD and its feeder high schools; and local, regional and national economic, employment and industry trends.
V. Growth Projections
This section assesses current participation rates and historic enrollment, and projects the District’s potential growth through 2025 based on short and long-term trends.
VI. Educational Program Assessment
The results of a key point of faculty input on program-specific strategies, this section explains the process and the results of the updated program assessment.
VII. Educational Master Plan Goals and Strategies
This chapter describes the ten Educational Master Plan goals. For each goal listed, a series of key strategies is identified.
VIII. Plan Implementation
The implementation of this plan includes the refocusing of SCCD on the realities of basic skills, transfer and workforce needs. Implementation will also include recommendations for tracking progress toward the EMP goals. This chapter is not included in the preliminary review draft, as it will be developed based on faculty/staff input on April 24th.
Planning Process and Methods
Beginning in summer 2011, SCCD engaged in a comprehensive and interactive planning process to update the Educational Master Plan. The Superintendent/President’s Cabinet guided the process, with integral involvement from the deans, counseling and representatives of the Academic Senate. The Superintendent/President’s Cabinet provided oversight for Plan content and methodology. Students, faculty, staff and administrators, as well as community and business leaders, provided valuable input and feedback during the process. SCCD retained MIG, Inc., a Berkeley-based planning firm, to develop a comprehensive environmental scan, review and evaluate current programs and business and community needs, and identify goals and recommend strategies for future program development.
METHODS AND DATA SOURCES
The planning team used a variety of methods and information sources to develop the Educational Master Plan. These include:
Analysis of population and demographic data gathered from the US Census, California Department of Finance, Association of Bay Area Governments (ABAG), and the Sacramento Area Council of Governments (SACOG).
Review of current student enrollment trends from the California Community College Chancellor’s Office (CCCCO), California Postsecondary Education Commission and SCCD’s Office of Research and Planning.
Assessment of local secondary enrollment trends and projections from the California Department of Education and the California Department of Finance.
Review of the local economic and business landscape using data from the California Employment Development Department (EDD), Caltrans Office of Transportation Economics, U.S. Bureau of Labor Statistics, and reports and information gathered from Solano County, local cities and outside researchers.
Evaluation of certificate and degree programs offered by the top competitive educational providers in the region, as presented in current course catalogues. Research included a comparison with the programs currently offered by SCCD.
Evaluation of current program needs and projected trends through use of a questionnaire completed by faculty, academic staff, and school deans.
Qualitative information gathered through a comprehensive series of forums and meetings conducted with community and business leaders, faculty, staff and students.
PROCESS DESCRIPTION
In the summer of 2011, Solano Community College District (SCCD) initiated an update to the institution’s Education Master Plan. The planning process was launched with College leadership in May 2011 to discuss successes and challenges for SCCD since the last EMP process. As the project team developed summary materials about the planning environment, two parallel efforts included a broad range of community voices as well as targeted conversations with an interdisciplinary faculty and staff team.
SCCD Faculty, Staff and Student Input
Faculty and staff members were invited to attend all of the community forums, but particularly to those held at the Fairfield campus, Vacaville and Vallejo centers. The forums provided an important opportunity for faculty and staff to share their insight on key strengths, issues and planning opportunities for SCCD.
To ensure a broad and comprehensive engagement with the faculty, a series of three interdisciplinary faculty strategic conversations (IFSC) were held during fall and winter 2011/12 to provide input, direction and content for the plan. These meetings included representatives of faculty, including deans, counseling staff and the Academic Senate. In addition, IFSC forums focused on:
Review and discussion of current internal and external trends and the plan environmental scan document;
Brainstorming emerging opportunities and challenges facing SCCD;
Identification and refinement of critical plan goals and strategies.
Community Input
As a part of the update process, seven community forums were conducted to gather ideas and information from SCCD’s service area, which includes Solano County and the City of Winters. These forums were held in each of the population centers served by SCCD. Over 200 community members, faculty, staff and students participated in the forums. A number of key themes and unique ideas emerged from the discussions, many of which are reflected in the updated document.
Environmental Scan
In the fall of 2011, the consultant team developed an Environmental Scan Report to update and analyze internal and external conditions impacting the District and provision of programs and services. The Scan assessed key data related to:
Population and demographics;
High school performance, enrollment and projections;
SCCD enrollment and student success;
Competing educational providers in the region; and
Employment and workforce trends, locally, regionally and nationally.
The results of the Scan began to reveal the future direction for the County, which in turn provided a lens in which to review and evaluate existing SCCD programs and services.
Educational Program Review
The basis for the Plan is a stronger understanding of the current needs and projected trends for each of SCCD’s programs. Faculty members and school deans provided their expertise and knowledge to update the EMP through a program assessment questionnaire. The deans and faculty of each program were provided a set of enrollment and performance data and given an opportunity to identify strategies specific to the program and update a description of the role of the program and any factors influencing its success. The data collected through the questionnaire process highlights program specific needs that inform the broad directions for SCCD.
Plan Review
The Draft EMP will be reviewed by the Shared Governance Council on May 23rd with
subsequent review by the campus community and the Governing Board. Following a review period the Final EMP will be presented to the Governing Board.
Organizational History
SCCD was founded in 1945 as part of the Vallejo Unified School District. In 1965, Solano County voters approved the development of a community college district, and two years later approved a bond to build SCCD’s main Fairfield campus. Expansion of SCCD continued with the 2002 voter-approved bond, which funded construction of two permanent centers in Vacaville and Vallejo. At that time, Solano County voters approved Bond Measure G, which provided $124.5 million in bond funding to support the development of new facilities. The two permanent sites for the Vallejo and Vacaville Centers, whose locations who chosen based on projected population growth, opened in 2007 and 2010 respectively, and have since increased access to SCCD for students and community members.
Today, The Solano Community College District provides a comprehensive range of educational offerings, from Associates degrees and certificates to transfer preparation and lifelong learning. SCCD has recently expanded these offerings by partnering with Sonoma State University to offer a Bachelor of Arts in Liberal Studies.
In July of 2011, SCCD reorganized the academic programs from seven divisions in to four schools. This reorganization allowed SCCD to streamline senior leadership and break down some organizational barriers between programs with similar purposes.
Mission Areas
The SCCD has a broad mission that includes offering academic programs designed to meet students’ academic, vocational, developmental, and continuing education needs. The following areas represent the four major mission areas of SCCD:
ACADEMIC/TRANSFER
Core to the mission of SCCD, academic programs provide students with a solid foundation to transfer successfully to a four-year institution and develop skills to gain employment. Academic programs work in conjunction with other SCCD programs, including occupational, developmental and continuing education.
CAREER TECHNICAL EDUCATION/WORKFORCE TRAINING
Linked to the mission of ensuring an educated and skilled workforce, the vocational component of SCCD’s mission emphasizes students developing skills targeted toward specific employment occupations. The educational experience includes meeting credential
standards; developing skills to attain a specific position, furthering a current career or building the foundation to embark on a new career; and attaining a certificate or an Associates degree.
BASIC SKILLS
Student success and attainment of educational and career goals must be supported by the development of a strong foundation of core skills. SCCD programs and support services are provided to prepare students for success in college-level work and the workforce. Students enrolling at SCCD have a range of preparation levels, and key to meeting all SCCD mission areas is ensuring that students have access to the resources and tools to develop proficiencies in English, reading and math. Support is provided both inside and outside of the individual classes in which students are enrolled.
CONTINUING EDUCATION
SCCD recognizes that education is a continuous process and community members will seek educational experiences and training throughout their careers and lifetimes. SCCD programs and courses are available to provide continuing education experiences for all members of the community.
MANDATED FOCUS
The continuing lack of adequate funding has resulted in a necessary refocusing of effort by the statewide community college system. Recognizing the impact of necessary cuts to the State budget for community college base funding, the California Legislature has called upon all colleges to prioritize three of the four mission areas: transfer, career technical education/workforce training and basic skills. The statement of intent by the Legislature indicates that the community college districts shall implement necessary workload reductions to course and programs that do not directly support students in their efforts to achieve basic skills, workforce training or transfer goals.
Major SCCD Organizational Areas
SCCD’s organizational structure is critical to the success of the three focus mission areas. The interconnected and interdependent services and programs provided by Academic and Student Affairs (led by an executive vice president), Finance and Administration (led by a vice president), and Technology Services and Support (led by a director) provide an environment conducive to meeting students’ academic and career goals.
Additionally, the Human Resources Department, Solano College Educational Foundation and Community Services all provide important services to ensure a strong workforce, additional funding sources and a strong public presence in the community.
SCCDACADEMIC ORGANIZATION
In July of 2011, SCCD reorganized its seven academic divisions to create four schools. SCCD schools fall under the organizational area of Academic & Student Affairs and include:
School of Liberal Arts School of Sciences
School of Career Technical Education and Business School of Human Performance and Development Figure 2-1 SCCD Organization
Throughout this document, SCCD Counseling and Special Services will commonly be referenced as a fifth unit alongside the four schools.
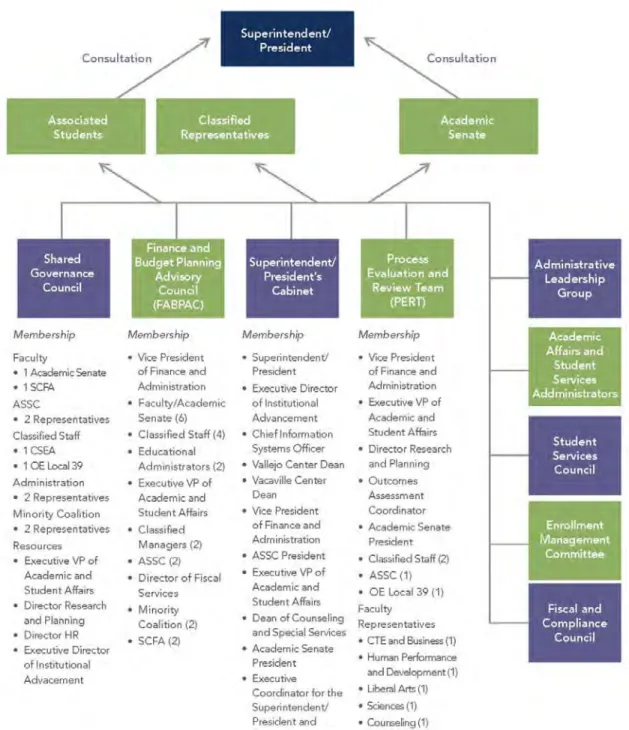
SHARED GOVERNANCE
Shared Governance is defined in SCCD policies as the “collaborative participation of appropriate members of the College in planning for the future and in developing policies, procedures and recommendations under which the College is governed and administered.” This includes the Academic Senate, Associated Students of Solano College (ASSC), staff, faculty and District Administrators, as well as others.
The Educational Master Plan is built upon on the Solano Community College District’s Strategic Plan mission, vision, goals and values. District administrators, faculty, staff and students will use the EMP with the Strategic Plan to guide future decision-making.
For clarity and consistency, the following definitions of planning framework elements are offered:
SCCD Mission. The purpose and primary focus of Solano Community College District. This is a long-term component.
Vision. The preferred future for SCCD, based on a five-year outlook. Values. Key principles that inform and guide implementation.
EMP Goals. Directions for long-range change. Goals reflect higher level, desired results that are often measurable.
EMP Strategies. Plan strategies (introduced in Chapter 7) take the form of programmatic and policy-level changes and actions. Many EMP strategies are cross-cutting and may have a beneficial effect that helps achieve multiple goals.
Mission
The mission of Solano Community College is to prepare a diverse student population to participate successfully in today’s local and global communities. We accomplish our mission by providing:
Quality teaching;
Innovative programs;
Effective transfer preparation;
Economic and workforce development;
Services that are responsive to the needs of our students;
Life-long learning; and
Vision
Solano Community College will be a recognized leader in educational excellence − transforming students’ lives.
Core Values
Solano Community College is committed to excellence. We have adopted the following core values to guide our policies, procedures and daily practices:
Integrity: Firm adherence to a code of ethical values in thought and behavior.
Critical thinking: The use of intellectually disciplined, logically sound processes involving data driven decision-making.
Mutual respect: Valuing the intrinsic worth of each person in an atmosphere of collegiality.
Collaboration: Working together across areas of responsibility and interest to achieve common goals and objectives.
Innovation: The search for and use of effective processes or procedures.
Accountability: Individual and collective responsibility for achieving the highest level of performance.
Student well-being: Considering and addressing the impact on students of any and all actions or inactions.
District Strategic Plan Goals
SCCD organizational management and change is driven by the following Strategic Plan goals.
Goal 1: Foster Excellence in Learning
Goal 2: Maximize Student Access and Success Goal 3: Strengthen Community Connections Goal 4: Optimize Resources
Educational Master Plan Goals
The following Educational Program Plan goals establish an overarching structure for SCCD Educational program development.
Goal A: Align program offerings, policies and communications with transfer goals. Goal B: Develop workforce-ready career/technical graduates.
Goal C: Improve basic skills of all students. Goal D: Reduce gaps in achievement.
Goal E: Create a district-wide policy framework for program development and management. Goal F: Improve student access to courses and services.
Goal G: Engage as a partner in community efforts. Goal H: Connect students to the Campus community. Goal I: Build alternative funding and revenue sources. Goal J: Optimize existing campus and centers.
The relationship between the Strategic Plan and the EMP is illustrated in the SCCD Education Master Plan Framework graphic presented on the following page.
• ... • ... • ... • ... • ... Strengthen program development through research and
assessment Reduce gaps in achievment in all programs Develop work-force-ready career/ technical graduates Strengthen community partnerships Improve basic
skills of all students
Align program offerings for transfer
achievement Improve student access to courses and services Connect students to the campus community Build alternative funding and revenue sources Optimize existing campus and
centers
Integrity
Critical
Thinking
Respect
Mutual
Collaboration
Innovation
Accountability
Well-being
Student
Maximize
Student Access
& Success
Optimize
Resources
Strengthen
Community
Connections
Foster
Excellence in
Learning
Programs
Staffing
Solano Community College prepares a diverse student population to participate successfully in today’s local and global communities.
We accomplish our mission by providing:
A recognized leader in educational excellence - transforming students’ lives
• economic and workforce development • services that are responsive
to the needs of our students
• life-long learning • a broad curriculum • quality teaching
• innovative programs
• effective transfer preparation
• ... • ... • ... • ... • ... • ... • ... • ... • ... • ... • ... • ... • ... • ... • ... • ... • ... • ... • ... • ... • ... • ... • ... • ... • ... • ... • ... • ... • ... • ... • ... • ... • ... • ... • ... • ... • ... • ... • ... • ... • ... • ... • ... • ... • ...
vision
mission
values
strategic plan goals
key
strategies
implications
education
master plan goals
The purpose of this chapter is to provide an overview of the current planning environment for the District. Developing a clear understanding of the present landscape, current trends and anticipated changes moving forward positions SCCD to make informed decisions about programs, resources and services. Specifically, the chapter covers trends for:
Population and demographics; Enrollment;
Student success rates;
Educational competition; and The economic and business climate.
Service Area
The Solano Community College District includes four centers of education, including the main Fairfield campus, and Vacaville, Vallejo and Travis Air Force Base locations. The District’s service area accounts for approximately 95 percent of the total population in Solano County, and includes Winters in neighboring Yolo County. The service area is bordered by Napa County to the northwest, Yolo County to the northeast, Contra Costa County to the south and Sacramento County to the east.
Population and Demographics
Changes and trends in population and demographics will shape potential SCCD students and influence the types of programs, courses and support services that will be required. In recent years, SCCD has responded to projected population growth through the development of new education center locations to increase community access. Through the District’s Educational Master Plan process, SCCD conducts regular assessment of changing demographics and explores how these changes influence future educational programs.
Across all cities in the SCCD service area, population is expected to increase by approximately 21 percent from 2010 to 2035. At the county level, this could potentially result in an additional 83,886 residents.1 The cities of Vallejo, Fairfield
and Vacaville are expected to contribute the greatest number of new residents, though Winters’ anticipated growth represents the largest percentage increase of new residents in any one service area community.
Solano County will continue to become more ethnically diverse in the coming decades. By 2040, Hispanic/Latino residents are projected to account for approximately 35 percent of the county population; the Asian community is expected to comprise 24 percent of the population.2
The youth and adult populations of Solano County (defined as persons ages 1 to 14 and 15 to 54, respectively) are projected to remain fairly stable as a proportion of the entire population. However, by 2040 adults 55 years and older are expected to account for roughly 18 percent of all residents, compared to 11 percent in 2010.3
Nearly 20 percent of Solano County’s population is foreign born, and almost 30 percent (28.5) of county residents over the age of five speak a language other than English at home. 4
1 Association of Bay Area Governments (ABAG) and California Department of Finance (see Table 1-1 in
Environmental Scan developed for this plan effort).
2 California Department of Finance (Environmental Scan, Table 1-3) 3 California Department of Finance (Environmental Scan, Table 1-2)
4 U.S. Census Bureau. 2005-2009. American Community Survey 5-Year Estimates (Environmental Scan p.
Table 4-1: Projected Population Growth for Solano Community College District Service Area (2000 – 2025) 2010-2025 2010-2025 City 2000 2010 2015 2020 2025 % change # change Benicia 26,865 26,997 29,000 29,300 29,600 9.64% 2,603 Dixon 16,103 18,351 19,400 20,600 21,800 18.79% 3,449 Fairfield 96,178 105,321 115,800 118,900 121,900 15.74% 16,579 Suisun City 26,118 28,111 30,200 31,200 32,300 14.90% 4,189 Vacaville 88,625 92,428 102,600 105,000 107,300 16.09% 14,872 Vallejo 116,760 115,942 127,400 130,900 133,600 15.23% 17,658
Winters 6,125 6,624 N/A N/A N/A N/A N/A
Service Area
Cities Total 376,774 393,774 424,400 435,900 446,500 13.39% 52,726
Table 4-2: Solano County Population Growth by Age
Age 2010 % 2040 % % Change 2010-2040 0 to 14 89,023 20% 140,489 20% 57.8% 15 to 24 67,074 15% 94,618 14% 41.1% 25 to 34 58,879 13% 91,375 13% 55.2% 35 to 44 57,980 13% 89,248 13% 53.9% 45 to 54 66,737 15% 88,285 13% 32.3% 55 to 64 53,170 12% 67,217 10% 26.4% 65 to 74 26,982 6% 54,478 8% 101.9% 75 and over 21,216 5% 71,496 10% 237.0% Total 441,061 100% 697,206 100% 58.1%
California Department of Finance Projections July 2007
Enrollment Trends
A close look at enrollment patterns at SCCD and local high schools, and the general educational level of the local population, can help anticipate trends in future District enrollment and demand. Enrollment trends are linked to population and demographics and inform how SCCD will approach serving the needs of future students.
According to the U.S. Census American Community Survey estimates for 2005-2009, over 85 percent of Solano County residents aged 25 and over have a high school diploma or higher. Nearly 24 percent have a Bachelors degree or higher.
Approximately 24.5 percent of adults age 25 and over do not complete or pursue education above the high school level.5
Solano County’s population continues to grow, but the educational attainment of adults aged 25 years and older has worsened. In 2005, approximately 60 percent of adults age 25 years and older did not have a college degree (Associate, Bachelor, Graduate or Professional), According to the most recent census estimates, this proportion has grown to 67 percent. High numbers of county residents without a college degree may result in a workforce that lacks the knowledge and training to meet the needs of the changing job market.
An average of 21 percent of all high school graduates from the District’s top 12 feeder schools attend SCCD. Between 2004-05 and 2009-10, the majority of top feeder high schools witnessed a decrease in enrollment. Nearly all feeder schools witnessed an increase in the percentage of non-white students, and an increase in the percentage of students enrolled in the free/reduced lunch program.
Between 2004-05 and 2008-09, top feeder high school graduation rates have decreased nearly across the board. At the same time, the API base ranking of all feeder schools has increased, with one exception.6
In recent years, SCCD student enrollment as measured by headcount has ranged from a low of 10,983 in 2006, to a high of 12,261 in 2009. In Fall 2010, student enrollment was 11,836.7
Between 2005 and 2010, the proportion of full-time students (students enrolled in 12 or more units) fluctuated between a low of 29 percent (Fall 2008) and a high of 36 percent (Fall 2007). In Fall 2010, 34 percent of SCCD students were enrolled full-time.
State and college statistics show that District enrollment is more or less representative of the service area population as far as racial/ethnic breakdown, with a slightly smaller percentage of white students (38% enrolled v. 45% of service area) and a
5 Environmental Scan p. 15.
6 California Department of Education (comparison of 2004-05 and 2008-09 as reported in SCCD EMP
environmental scan documents for 2007 and 2012).
notably larger population of African-American students (21% enrolled v. 12% of the service area population).8
Almost one-half (47 percent) of the District’s Fall 2010 students indicated that their educational goal was to transfer to a four-year college or university. Another 15 percent were undecided; 13 percent wanted to earn a degree or certificate; and 10 percent were taking courses to prepare for or enhance their career.9
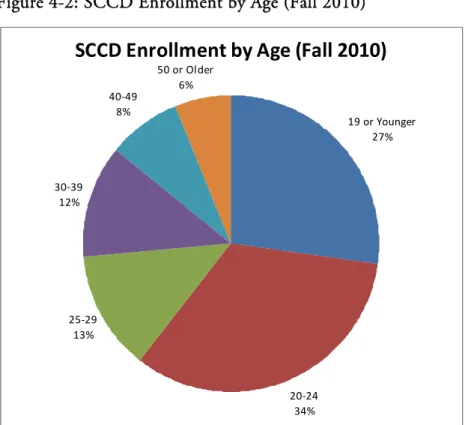
Figure 4-2: SCCD Enrollment by Age (Fall 2010)
SCCD
Enrollment
by
Age
(Fall
2010)
19 or Younger 27% 20‐24 34% 25‐29 13% 30‐39 12% 40‐49 8% 50 or Older 6%
8 California Department of Finance and California Community College Data Mart (Environmental Scan, pp
11 and 13).
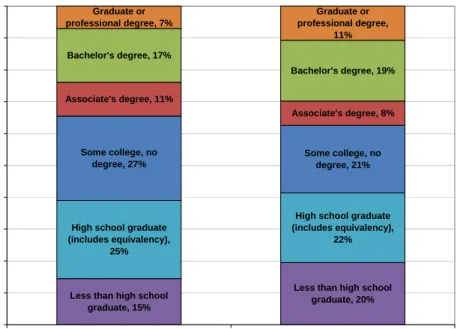
Figure 4-3: Educational Attainment: Solano County, California
Less than high school graduate, 15%
Less than high school graduate, 20% High school graduate (includes equivalency), 22% Some college, no degree, 27% Some college, no degree, 21% Associate's degree, 11% Associate's degree, 8% Bachelor's degree, 17% Bachelor's degree, 19% Graduate or professional degree, 7% Graduate or professional degree, 11%
High school graduate (includes equivalency), 25% 0% 10% 20% 30% 40% 50% 60% 70% 80% 90% 100%
Solano County California
Source: American Community Survey 2005-2009 five year estimates, US Census Bureau
Table 4-3: Assessment Results for Top 5 Feeder Schools, Sorted by % Attending SCCD (2009-10)
High School Language Arts
% Basic and Above
Math % Basic and Above
Science % Basic and Above
History Social Science % Basic and Above
Armijo High 71% 42% 66% 67%
Fairfield High 68% 42% 61% 56%
Vanden High 81% 66% 87% 79%
Will C. Wood High 72% 61% 72% 54%
Vacaville High 74% 41% 72% 70%
Solano County Total 79% 70% 73% 68%
State Total 79% 72% 74% 70%
Figure 4-4: SCCD Enrollment by Ethnicity (Fall 2010)
SCCD
Enrollment
by
Ethnicity
(Fall
2010)
African American 21% American Indian 1% Asian/Pacific Islander 7% Filipino 11% Latino 19% White 37% Multi‐Ethnicity 4%
Figure 4-5: SCCD Duplicated Enrollment by Location (Fall 2008-2010)
SCCD
Duplicated
Enrollment
by
Location
(Fall
2008
‐
2010)
0 2000 4000 6000 8000 10000 12000 En ro llm e n t Year 2008 2009 2010 Fairfield Campus 9,355 9,613 9,222 Vacaville Center 1,244 1,324 1,669 Vallejo Center 1,911 2,588 2,857 Distance Education 2,352 2,645 2,661 Other Location 707 382 279 1 2 3
Figure 4-6: SCCD Percent of Enrollment by Educational Goal (Fall 2010) Earn 4‐Yer College
Credits Transfer Degree/Certificate Discovery Career Preparations Personal Interest Developmental Undecided
Student Success, Retention and Transfer
Student success and retention rates10 are important indicators to measure how well students
are achieving their educational and career goals. Factors influencing student success include access to support services, student basic skills preparation, course curriculum and financial support, among others. Success and retention rate disparities among student population groups should inform how SCCD develops directions and goals to increase overall student success and successfully address gaps in achievement.
Overall SCCD course success and retention rates have remained relatively steady since Fall 2005.11 In Fall 2010, the District reported a success rate of 63 percent and
a retention rate of 82 percent. Broken down by ethnicity, African American students had a lower success and retention rates than other subgroups (50 percent and 77 percent, respectively).
10 Success rates are defined by the State as the percentage of students who complete a course with an A, B, C or
Credit grade. Retention rate is the percentage of students who do not withdraw from a course.
Between academic years 2004-05 and 2009-10, the number of degrees awarded to SCCD graduates decreased to a low of 802 in 2006-07 before rising steadily to 1,023 in 2009-10. The number of certificates awarded fluctuated between a high of 298 in 2004-05 to a low of 190 in 2008-09 before increasing to 213 in 2009-10.
Twenty-one percent of the 2007 student cohort of first-time, full-time students graduated within three years12, compared to 31 percent of the 2006 cohort and 22
percent the year previous.
During the most recent six-year period, the number of District students transferring to the California State University system fluctuated from a high of 374 in both 2006-07 and 2008-09 to a low of 289 in 2009-10. The number of students who transferred to the University of California system varied from a low of 111 in 2004-05 to a high of 159 in 2008-09.
Thirty-seven percent of first-time freshman in Fall 2004 (2004-05 cohort) who completed 12 units and attempted a transfer level math or English course successfully transferred to a four-year college or university within six years. The cohort’s Latino students transferred at the lowest rate (30%), while Asian/Pacific Islander students had the highest transfer rate by ethnic group (49%).13
12 This graduation rate is the percentage of first-time, full-time students in a fall semester who completed a
degree or certificate or become “transfer prepared” by completing 60 transferable units with a 2.0 or better GPA. Source: Integrated Postsecondary Education Data System (Environmental Scan, p. 31).
Figure 4-7: SCCD Transfers to CSU, UC, Private In-State Universities, and Out-of-State Universities (2004-05 to 2009-10) 0 50 100 150 200 250 300 350 400 450 2004 ‐05 200 5‐06 200 6‐07 200 7‐08 2008 ‐09 2009 ‐10 UC CSU Private In‐State Universities Out‐of‐State Universities
Table 4-4: SCCD Retention and Success by Ethnicity (Fall 2010) Ethnicity
Retention
Rate Success Rate
African-American 77% 50%
American Indian/Alaskan Native 82% 63%
Asian 84% 69% Filipino 81% 63% Latino 83% 63% Multi-Ethnicity 81% 57% Pacific Islander 86% 64% Not Specified 84% 67% White 82% 68% Total 82% 63%
Figure 4-8: SCCD Six-Year Cohort Transfer Rate by Ethnicity14 (2004-05) 32% 31% 49% 45% 30% 36% 0% 10% 20% 30% 40% 50% 60% African American American Indian Asian/Pacific Islander
Filipino Latino White Percent
Competition
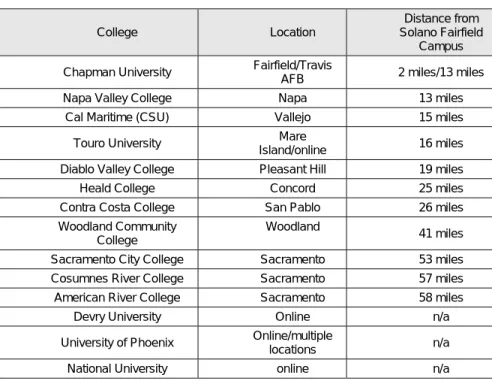
Assessing programs offered by competitive education providers is particularly important to identify market trends and potential gaps or underserved niches for future programs. Other education providers can also provide partnership opportunities and programmatic models.
There are seven local competitors within 30 miles of Solano Community College offering a range of certificate and degree programs.
SCCD’s Fall 2010 success rate of 62.9 percent is slightly lower than the success rate of community colleges statewide (68.4). Relative to other community colleges in the region, SCCD’s success rate is low.
Solano’s distance education program accounts for a larger share of the District’s total FTES (12.2 percent) than any of the comparison community colleges.
Within basic skills classes, Solano’s success rate is lower than all comparison colleges except Diablo Valley. The basic skills retention rate compares favorably to that of other community colleges in the region.
14 Percentage of first-time freshmen who completed 12 units, attempted a transfer level math or English course, and transferred to a four-year university within 6 years. Source: California Community Colleges Data Mart
SCCD has a number of degree programs that are not currently offered at other institutions. Examples of these programs include Banking Operations, Industrial Education, Interior Design and Life Management. These niche programs could potentially provided important growth opportunities, and market differentiation.
Table 4-5: Alternative Educational Providers
College Location
Distance from Solano Fairfield
Campus Chapman University Fairfield/Travis
AFB 2 miles/13 miles Napa Valley College Napa 13 miles
Cal Maritime (CSU) Vallejo 15 miles Touro University Mare
Island/online 16 miles Diablo Valley College Pleasant Hill 19 miles Heald College Concord 25 miles Contra Costa College San Pablo 26 miles Woodland Community
College
Woodland
41 miles Sacramento City College Sacramento 53 miles Cosumnes River College Sacramento 57 miles American River College Sacramento 58 miles
Devry University Online n/a University of Phoenix Online/multiple
locations n/a National University online n/a
Economic and Business Climate
Community colleges play an important role in preparing students for employment, through skill development, attainment of a degree, transfer preparation and continued learning opportunities. Understanding the current and projected economic and business climates provides an important context in which to plan programs and understand the types of workers that will be needed in the future economy.
Affordable and readily available housing will continue to draw residents from neighboring counties. By 2035, the number of households in Solano County is projected to increase by over 15 percent from 2010, representing a total increase of
23,130 households.15 Vallejo, Fairfield and Vacaville will achieve the greatest
growth.16
Between 2010 and 2050, the Solano County job growth rate is forecast to average two percent each year, compared to a 1.6 annual average growth rate for California overall.17 California Department of Transportation forecasts that the county
unemployment rate will decrease steadily, from 11.4 percent in 2011 to 7.4 percent by 2015, and 5.5 percent by 2035.
Looking ahead, the ratio of jobs in the county to employed county residents will increase to as much as 0.80 in 2035. Both Fairfield and Benicia are projected to have more jobs than employed City residents. All other cities will experience a surplus of employed residents.18
Across all occupations, the number of jobs requiring as Associates degree is growing faster than occupations with other education and training requirements.19
According to the U.S. Bureau of Labor Statistics, half of the fastest growing occupations in the U.S. are related to health care. Within the health care field, demand has grown for physician/medical assistants, medical aides and dental hygienists. Registered nurses and home health aides are estimated to create the largest numbers of new jobs in the country.
Biomedical engineering is the fastest growing occupation in the country.20 However,
because the current number of jobs in this occupation is low, and the total number of jobs nationwide is expected to increase by only 11,600.
15 Current projections in growth in the number of households over the next 20 years represent a significant
readjustment from 2005 projections looking towards 2025 (a nearly 48 percent decrease in total number of new households).
16 Association of Bay Area Governments (ABAG). San Francisco Bay Area Population, Household and Job
Forecasts: Projections and Priorities 2009.
17 California Department of Transportation (CDOT). Long-Term Socio-Economic Forecasts by County.
Solano County Economic Forecast. 2010.
18 Association of Bay Area Governments (ABAG). San Francisco Bay Area Population, Household and Job
Forecasts: Projections and Priorities 2009.
19 U.S. Department of Labor Bureau of Labor Statistics Division of Occupational Outlook (Environmental
Scan, p. 46)
According to the Association of Bay Area Governments, health and educational service industries currently contribute the greatest number of jobs to Solano County’s economy (22.5 percent of the total), and will continue to do so through 2035. The proportion of total county jobs that these industries contribute is expected to remain steady.
According to ABAG, Solano County’s information services field is expected to grow the most, with the total number of jobs increasing by over 78 percent between 2010 and 2035.21 In comparison, the California Employment Development Department
projects no growth in employment in the information industry.
Employment in life sciences has become more highly concentrated in Solano County relative to other parts of the San Francisco Bay Area. Core industries of the county’s life science cluster include biotechnology, pharmaceuticals, medical devices, and scientific research and development.
The 2009 Solano Economic Development Corporation report, “Solano County’s Energy Cluster”, describes the emergence of a diverse local energy industry and its potential to generate economic momentum in Solano County. According to this same report, clean energy occupations require an Associates degree more frequently than do carbon-based energy occupations. Carbon-based energy remains the largest sector of the county’s energy industry cluster, but experienced only two years of annual growth between 1995 and 2007. In comparison, clean energy is a much smaller sector but is fast-growing.
The number of households in Solano County is projected to increase as development and redevelopment projects continue. Affordable and readily available housing will continue to draw residents from neighboring counties. Between 2005 and 2025, the county is projected to increase by 44,310 households. The largest household growth is projected for the cities of Fairfield, Vacaville and Vallejo22.
Education levels of Solano County residents may affect industry growth. As jobs and vocations require more problem solving skills and interaction with technology, adult workers may need to seek additional education. SCCD can play a dual role of preparing the next generation of workers while simultaneously training and retraining current workers.
21 ABAG. San Francisco Bay Area Population, Household and Job Forecasts: Projections and Priorities. 2009. 22 Ibid.
Table 4-6: Solano County Job and Employee Balance 2035
City Total Jobs Employed
Residents Ratio Benicia 19,010 16,810 1.13 Dixon 10,650 14,420 0.74 Fairfield 71,640 66,600 1.08 Rio Vista 6,120 11,240 0.54 Suisun City 6,460 18,880 0.34 Vacaville 43,920 57,550 0.76 Vallejo 47,870 72,440 0.66 Remainder 6,210 6,760 0.92
Table 4-7: Industry Employment Projections for Solano County (2008-2018) Annual Average
Employment Employment Change
Industry Title 2008 2018 Jobs Percent
Government 26,900 27,600 700 2.6%
Retail Trade 17,700 17,600 -100 -0.6% Education Services, Health Care and Social
Assistance 17,700 20,800 3,100 17.5% Leisure and Hospitality 13,400 14,500 1,100 8.2% Professional and Business Services 10,600 12,000 1,400 13.2% Self Employment 10,400 10,200 -200 -1.9%
Manufacturing 9,400 9,300 -100 -1.1%
Construction 9,200 9,600 400 4.3%
Financial Activities 5,000 4,900 -100 -2.0% Transportation, Warehousing and Utilities 4,800 5,000 200 4.2% Wholesale Trade 4,100 4,200 100 2.4% Private Household Workers 1,900 2,500 600 31.6%
Information 1,600 1,600 0 0.0%
Total Farm Employment 1,600 1,600 0 0.0% Mining and Logging 300 300 0 0.0%
Source: California Employment Development Department. 2008-2018 Industry Employment Projections. Vallejo-Fairfield Metropolitan Statistical Area. December 28, 2010.
Staff and Community Perspectives
INTERDISCIPLINARY FACULTY STRATEGIC CONVERSATIONS
Three Interdisciplinary Faculty Strategic Conversations (IFSC) were held over the course of the EMP development process (October 2011, November 2011 and January 2012). The three-meeting process was designed to build faculty awareness of and ownership in the Education Master Plan process through guiding the development of key ideas and opportunities explored during the process. The IFSC meetings also provided an opportunity to fact check data and guide the direction of the EMP goals and strategies. The following themes emerged from IFSC meetings:
SCCD is experiencing a crisis in access: the enrollment cap limits capacity, but demand continues to grow.
Look at various models provide students with the greater guidance they require as they move through programs. Implement a full first-year experience to channel students through skill improvement and services.
Work with peer schools to facilitate access to programs. Engage with four-year institutions. Coordinate curriculum with high schools and university programs. Address challenges related to access, including transportation and child care
availability. Expand hours that services are available.
Consider establishing a learning resource center that includes a number of co-located student support and resource facilities, including an upgraded library.
Increase basic skills instruction and integrate basic skills across curriculum. Increase staff development for basic skills support.
Expand support services and the use of alternative learning modalities, particularly in support of basic skills instruction and support for special populations. Build in greater flexibility, including the use of shorter courses, mini or non-credit options, peer tutoring, and other approaches outside of the classroom. Expand online and hybrid educational opportunities.
Understand student success and retention and the impact that various factors have on success and retention (i.e., program cost, online vs. traditional classes, counseling services, etc.). Obtain quality data on incoming students and their levels of skill. Track employment and success of graduates.
COMMUNITY FORUMS
In the summer and fall of 2011, SCCD held a series of seven community forums. Participants included members of the K-12 community; parents of high school and community college students; local employers, leaders and officials; SCCD faculty, staff and students; and Travis Air Force Base personnel.
At each community forum, participants shared positive impressions of the role of SCCD, and identified challenges and opportunities to help SCCD focus the efforts of this Educational Master Plan. Several factors were the focus of discussions of why students choose Solano: most notably, affordability, proximity and course availability. Many past and present students mentioned the key role that SCCD plays in opening doors to four-year universities and achieving success in their academic careers.
The points below summarize other key themes that emerged from the community forums: Expand course offerings based on emerging career trends and majors in high
demand.
Strengthen outreach and ties to high schools by establishing partnerships that result in academic and counseling programs that bridge the strengths of the college and high school, such as college readiness, basic skills and industry-specific certifications. Strengthen focus on developing soft skills. Offer additional language courses to
complement Spanish.
Address limitations and barriers related to access and transportation to and from college campuses and centers, in part by sharing and maximizing the use of local facilities and supporting distance education.
Major changes in the forces that drive population and enrollment growth, along with constraints resulting from declining levels of funding from the State, make the planning for future potential growth of SCCD both more challenging and more important than ever. The projected and actual patterns of growth will impact the demand, the quantity of educational offerings and supporting services, as well as the facilities needed to accommodate them. The most challenging issue facing SCCD is the disconnect between this growth potential, which is substantial, and the available funding available to address that growth. In the short term, growth will be hampered due to lack of funding and the District will need to aggressively build alternative funding sources. This section assesses current SCCD participation rates and historical enrollment, and projects the District’s potential growth through 2025. Growth projections for SCCD are based on a number of factors, including County demographic projections, historical student enrollment data, and regional growth projections. At a finer scale, projected growth is also
impacted by the refocusing of the California Community Colleges on three of the core mission areas: transfer, basic skills and career technical education.
Community colleges measure enrollment in a number of ways, including overall headcount, full-time equivalent students (FTES)1, and weekly student contact hours (WSCH, measured in the fall term of each year)2. Facilities planners use growth in WSCH to determine the need for additional square footage. Projections made in FTES are backed up with WSCH numbers where available to facilitate the facilities planning process.
Population Projections
The SCCD service area includes Solano County and the adjacent city of Winters (in Yolo County). Some sources of information describe only Solano County, but the full service area is considered where ever information is available. The District’s location between two major metropolitan areas, the San Francisco Bay Area and Sacramento Area, linked by a major highway corridor, offers a strong and unique economic driver for growth over the next 25 years. The amount of available land for affordable residential development, in comparison to many of the more urban Bay Area cities that have reached or are close to reaching build out, will also contribute to growth in the long-term. While Solano County has been hard hit by the nation-wide housing crisis, with some communities losing population, in the long-term the geographic and economic positioning of the region assures growth. Based on projections from the Association of Bay Area Governments (ABAG), the County will experience overall growth of 18 percent, or approximately 1.1 percent annual growth from 2010 to 2025.
College-Wide Enrollment Projections
A number of factors contribute to the total SCCD enrollment. As population in the service area grows and as competition for entry-level positions increases, there will be a resulting increase in demand for post-secondary education. However, there are also factors that constrain the amount of instructional space available; primarily, the level of funding for course offerings and related services.
Historical trends in enrollment and student contact have not yet completely absorbed the development of the Vacaville (2007) and Vallejo (2010) Centers. The increased access to SCCD courses has both allowed existing students to take classes closer to home and create opportunities for students who could not have otherwise
participated. The enrollment for each new center will form patterns relating to the offerings and student needs that have not yet been established. In addition, there is long-term potential for the expansion of the Vacaville Center to a full-size campus and for the Vallejo Center to add a second phase of development, thus attracting potential students and increasing local access to educational resources.
DEMAND:PARTICIPATION RATE
Statewide, participation rates for community colleges (measured in unduplicated headcount of students per 1,000 population) have averaged between 84 (2009-10) and nearly 90 (2008-2009) per 1,000 population over the past three years. However, this rate varies greatly based on gender and ethnicity3.
Applying the statewide average participation rate to the service area population results in over 35,000 potential community college participants. Over the past ten years, the average participation rate for SCCD has remained just below 45 per 1,000, with the 2010 rate (at 44.3) resulting in a 2010 full-year headcount of 18,617. The difference between the statewide average participation rate and current enrollment at SCCD could be associated with a number of geographic and social conditions, including the number of alternative adult education providers in the County, the proximity to many community college and university alternatives, and the low educational attainment of the population relative to other counties. Participation rates can be raised through a variety of means, including: expanded community outreach, added schedule flexibility, new and enhanced programs, and increased physical access through the expansion of the two Centers in Vacaville and Vallejo. However, with participation rates measured in headcount and the funding levels determined by full-time equivalent students, simply increasing headcount, and the resulting participation rate, does not necessarily improve results for students. Each additional unique student reduces the number of hours each student has available to them (based on a set level of funding), which is counter to the trend of SCCD students taking more hours per student over time.
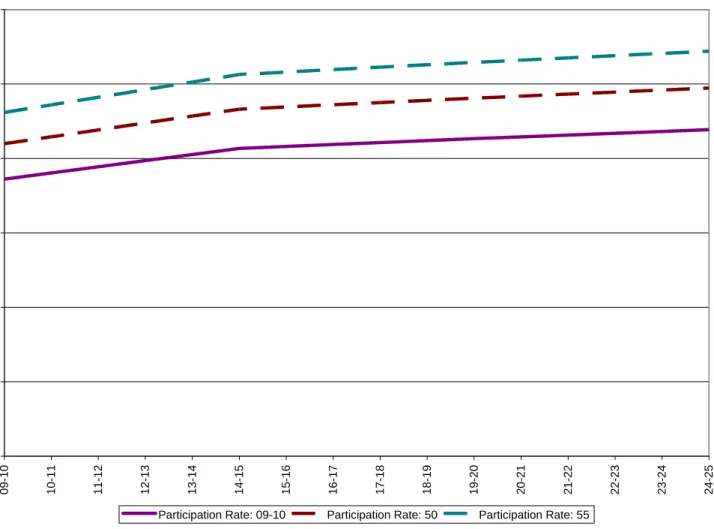
The participation rate for SCCD has stayed fairly consistent over the past ten years, ranging from 42 to 46 per 1,000 population. Using the average as a growth assumption and applying the projected population increases, student headcount can be projected to 2025. Figure 5-1 includes three scenarios for participation rate, including the ten-year trend of 45 per 1,000 and two slightly higher rates reflecting the recapture of additional students in the service area. Growth, looked at from this perspective, is driven by the increase in demand from a larger population. The range of 2025 projected headcounts resulting from this projection is between 22,000 and 27,500.
Figure 5-1: Headcount Projections based on Participation Rates (2025) -5,000 10,000 15,000 20,000 25,000 30,000 09 -1 0 10 -1 1 11 -1 2 12 -1 3 13 -1 4 14 -1 5 15 -1 6 16 -1 7 17 -1 8 18 -1 9 19 -2 0 20 -2 1 21 -2 2 22 -2 3 23 -2 4 24 -2 5
DEMAND:ENROLLMENT AND STUDENT CONTACT HOUR TRENDS
Over the past ten years, student headcount growth at SCCD has increased at an average rate of 0.76 percent
annually, faster than the annual average service area population average of 0.43 percent. Over the same ten years, the number of weekly student contact hours (WSCH) and the enrollment measured in Full Time Equivalent Students (FTES) have each increased by an average of about 2 percent per year. However, the combination of fee increases and reductions in the number of sections (described below) has reversed much of this growth over the past two years, returning WSCH to 2005 levels. Assuming a similar pattern of ups and downs into the future, tied to economic cycles, the 2 percent annual growth represents a conservative growth factor for overall enrollment. The resulting projection of growth to 2025 is presented in Figure 5-2 (FTES) and 5-3 (WSCH). This projection starts from data for the most recent fall term (Fall 2011).
Figure 5-2: Enrollment (FTES) History and Growth Projection (2000-2025)
Solan Community College Fall Term WSCH 2000-2011 and Projection
0 20,000 40,000 60,000 80,000 100,000 120,000 140,000 160,000 180,000 200 0 2001 2002 200 3 2004 2005 200 6 2007 2008 2009 2010 2011 2012 2013 201 4 2015 2016 201 7 2018 2019 202 0 2021 2022 2023 2024 2025
Solano Community College Fall Term FTES 2000-2011 and Projection
0 1,000 2,000 3,000 4,000 5,000 6,000 Fall 200 0 Fall 2 001 Fall 2 002 Fall 200 3 Fall 2 004 Fall 2 005 Fall 200 6 Fall 200 7 Fall 2 008 Fall 200 9 Fall 201 0 Fall 2 011 Fall 201 2 Fall 201 3 Fall 2 014 Fall 201 5 Fall 201 6 Fall 2 017 Fall 201 8 Fall 201 9 Fall 2 020 Fall 202 1 Fall 202 2 Fall 2 023 Fall 202 4 Fall 202 5 Historical Projected
Figure 5-3: Weekly Student Contact Hours History and Growth Projections (2000-2025)
sing demand for SCCD classes overall. However, the actual rowth of SCCD is also constrained by other factors.
p.
Figure 5-4: Number of Sections by SCCD School (2008/9 - 2010/11)
Steady two percent growth would result in a 2025 fall term total of 152,486 weekly student contact hours and 5,318 full time equivalent students. Based on the current relationship between FTES, WSCH and student
headcount, the number of FTES and WSCH is within the range of the headcount projected by a slightly increased participation rate (50-55) and population growth. Considering these two demand factors, a 2 percent average growth appears to be a reasonable estimate of the increa
g
SUPPLY:APPORTIONMENT FUNDING/ENROLLMENT CAP
The primary constraint on growth at SCCD is the apportionment provided by the State of California, whereby the resources allocated based on a set number of full time equivalent students (FTES), also known as the enrollment ca The apportionment is set by a formula that accounts for growth and the total funding level set in the State budget. Deep cuts in the 2009-10 and 2010-11 State budgets included reductions to base apportionment funding totaling over 8 percent. Statewide, this has resulted in cutting thousands of course sections. At SCCD the decline in the number of sections has been nearly 24 percent over the past three years. Figure 5-3 shows the reduction over the past three years by school. While all SCCD schools faced reduced sections, Career Technical Education/Business and counseling services experienced the largest percent reduction.
0 200 400 600 800 1000 1200 2008/2009 2009/2010 2010/2011
ES. dget.
portionment for the full academic year 2012/13 of 8,162 FTES works out to 122,430 weekly student contact hours funded. Figure 5-5 illustrates the history of full-year FTES and the
Figure 5-5 Full Year FTES History and Anticipated Funding
The funding situation continues to erode as the State struggles with the ongoing fiscal crisis. In advance of the 2011/12 academic year, the apportionment formula resulted in allocation of funding for 9,207.44 total FTES, however after the State’s revenue targets were not achieved, the revision reduced funding by an additional 572 FT Looking ahead, the current planning assumption is to expect another reduction of 473 FTES in the 2012/13 bu While these apportionment numbers do not directly dictate how many students SCCD can enroll, each student beyond the enrollment cap spreads the resources thinner across the entire college. The relationship between the FTES number and WSCH can be generalized based on a standardized student week. With a 525 contact-hour academic year of 35 weeks, the anticipated ap
anticipated funding levels through 2012/13.
7475 7143 6881 8251 9279 9898 9361 8635 8162 0 2000 4000 6000 8000 10000 12000 A 2004-05 2005-06 2006-07 2007-08 2008-09 2009-10 2010-11 2011-12 2012-13 pportionment Funding
m development, it is important to understand growth from a college-wide perspective, as well as by mission area and school. This section explores anticipated growth trends for SCCD’s
school.
5-7 provide historical and projected Fall Full Time Equivalent Students
Mission Area and School-Specific Growth Trends
To inform the EMP and future progra mission areas and growth by
MISSION AREA GROWTH
Each of SCCD mission areas is impacted by different growth factors and informs overall school and program direction. Table 5-1 below summarizes some of the key factors that are anticipated to drive increases in demand. The focus on the first three of the four mission areas established by the Chancellor’s office will directly impact growth for each school. Tables 5-2 through
ormation is provided to assist SCCD faculty and staff with future program and facilities planning.
MISSION AREA
(FTES) for the District as a whole, and for each school. This inf
Table 5-1: Factors Influencing Growth by Mission Area
GROWTH RATIONALE Academic/Transfer
a .
Increased population growth, tied with students’ transfer goals will ensure this area will grow.
Connections and partnerships with UC Davis, UC Berkeley as well as CSU campuses, including Sonom State, will stimulate and maintain this growth
Basic Skills The state’s focus on basic skills as well as the overall need to better prepare incoming high school students for college level work and success in a more competitive workplace, especially in Math and English w make this one of the strongest growth areas.
ill Career Technical Education Growth in key economic clusters in Solano County, including health, biotechnology and transportation,
to name a few, will spur growth in Career Technical programs. Aging baby-boomers will also create opportunities for replacing an aging workforce in trades. SCCD needs to provide flexible and varied program delivery to meet this demand.
Continuing Education
Education. However the priority of the community college system is to focus on the other three mission areas. Growth will rely on opportunities to combine this mission area with advancing the other three.
nity. The increased and sustained population growth of adults over 50 will increase demand of Continuing
Creating new resources will be critical to continuing efforts that support this role in the commu
T gs. The
h nted by 10 years of Fall FTES and WSCH as reported by SCCD Research and Planning.
able 5-2: Hi d P En (F C ou H)
unity College
annu schoo 2.6 Pro sed on Gr
able 5-2 below presents a summary of the projected growth scenario for the total of SCCD offerin istorical trend is represe
T storic an rojected rollment TES) and ontact H rs (WSC Solano Comm
Historical al average l growth: % jection ba 2% SCCD owth
Fall 2000 Fall 2005 Fall 2010 Fall 2011 Fall 2015 Fall 2020 Fall 2025
FTES 3,129 3,376 4,350 4,030 4,363 4,817 5,318
WSCH 101,568 117,987 127,639 114,475 123,912 136,809 151,048
METHODOLOGY AND ASSUMPTIONS
The overall growth will continue to be constrained by financial realities. However, historical trends have shown th as the economy recovers, and resources become available at the State level, growth in demand will lead to expansion of SCCD programs. The two percent growth projection is based on the past ten year’s growth which has absorbed both ups and downs in the financial picture and is
at
a reasonable place to begin discussing likely future growth. At two percent annual growth, the return to 2010 student enrollment and contact hour levels will take about five years
ontact hours begin to increase again, SCCD will face choices about adding from current enrollment levels. As the c
instating the programs that have been cut. Even as resources are restored, the demand
s
15 , the owing quickly, and during 2009-2011 while enrollment has been declining. In each case the area between the highest and lowest trend lines represents the range of likely enrollment for the school. The
owth projected for the District represents the jection for each school is a discussion of factors that will impact these numbers.
Figure 5-6: Historic and Projected Fall FTES 2000-2025 School of Career Technical Education and Business
GROWTH PROJECTIONS BY SCHOOL
Changes in the focus of California’s community college system will mean that the reductions in SCCD capacity will not simply be reversed by re
for community college courses and services will far outweigh the supply, requiring focus on the essential elements needed to support student achievement and serve the needs of the local economy. Stabilization and a return to a growing level of funding will present opportunities to expand in new areas and new ways of offering programs that better serve student needs.
Breaking down the college level data allows for an analysis of the impact of the reductions of recent years. The individual school data presented below breaks away from the long-term growth scenario to examine the difference in impact over the past four years to the programs that make up the Career Technical Education and Business, Liberal Arts, Human Performance and Development Science schools, and counseling services. Data limitations connected to the reorganization of the college divisions into schools, effective Fall 2011, and the transition to the BANNER data system limit the reliable WSCH data organized by school. A more complete set of FTES data, as reported to the Chancellor’s office has been used to identify the historic growth of each of the four schools, as well as counseling. For projection purposes, the overall average growth assumption of 2% is projected out through the year planning horizon. Recognizing that the schools have and will continue to grow in their own unique ways projection graphs also include trend lines that represent the rate of growth of the school during 2000-2009, when SCCD as a whole was gr
difference between this path of decline and the recovery and gr opportunity to reshape SCCD offerings. Following the pro
0 500 1,000 1,500 2,000 2,500
Fall 2000 Fall 2005 Fall 2010 Fall 2015 Fall 2020 Fall 2025
CTE and Business FTES History CTE Business Average Growth 00-09 SCCD 2% Growth Projection CTE Business 09-11 Decline
5-3: Historic rojecte rollment (FTES) and Contact Hours (WSCH)
of Career Te cal Edu n an ness
Historical annual average school growth: -1.2% Projection based on 2% SCCD Growth
Table and P d En
School chni catio d Busi
Fall 2000 Fall 2005 Fall 2010 Fall 2011 Fall 2015 Fall 2020 Fall 2025
FTES 888 691 886 774 838 925 1,021
WSCH N/A N/A 26,876 21,257 23,009 25,404 28,048
Factors that will have the most impact on reversing this decline in the School of Career Technical Education and
Expanding on occupational education and the small business center to support entrepreneurship; and as high-tech manufacturing, sustainable building technology, modern/hybrid automotive repair, green energy and biotechnology.
Figure 5-7: Historic and Projected Fall FTES 2000-2025 School of Human Development and Performance
Business include:
Focusing on locally needed skills such as trades and medical professionals that are tied to the economic recovery and retirements;
The ongoing need for basic workplace skills courses including the use of standard software;
Active development of emerging industries such
0 500 1,000 1,500 2,000 2,500
Fall 2000 Fall 2005 Fall 2010 Fall 2015 Fall 2020 Fall 2025
Human Development and Performance FTES History Human Development and Performance Growth 00-09 SCCD 2% Growth Projection
Human Development rforman
5-4: Historic rojecte rollment (FTES) and Contact Hours (WSCH)
of Human P mance eve nt
Historical annual average school growth: 4.1% Projection based on 2% SCCD Growth
and Pe ce 09-11 Decline
Table and P d En
School erfor and D lopme
Fall 2000 Fall 2005 Fall 2010 Fall 2011 Fall 2015 Fall 2020 Fall 2025
FTES 343 425 540 496 537 593 654
eeds in the community as the economy recovers; nutrition program; and
Reductions in athletics and physical education that are not expected to return to prior levels.
Figure 5-8: Historic and Projected Fall FTES 2000-2025 School of Liberal Arts
Factors that will influence trends in the School of Human Development and Performance include:
Resurgence of demand for early childhood education n
Expansion of the 0 Fall 2000 Fa 500 1,000 1,500 2,000 2,500
ll 2005 Fall 2010 Fall 2015 Fall 2020 Fall 2025
Liberal Arts FTES History Liberal Arts Growth 00-09 SCCD 2% Growth Projection Libera 1 D
-5: Historic roject rollment (FTES) and Contact Hours (WSCH) School of Liberal Arts
on 2% SCCD Growth
l Arts 09-1 ecline
Table 5 and P ed En
Historical annual average school growth: 2.4% Projection based
Fall 2000 Fall 2005 Fall 2010 Fall 2011 Fall 2015 Fall 2020 Fall 2025
FTES 945 1,072 1,261 1,196 1,295 1,429 1,578
WSCH N/A N/A 37,218 33,913 36,709 40,530 44,748
rsal of the current declines based on:
post-transfer;
Increasing demand and efforts to strengthen basic skills education and integrate basic skills into and alongside other programs; and
Slower growth in art, music and theater as these programs are modified to support core mission areas such as basic ski