EUROPEAN EXTREMELY LARGE
TELESCOPE DESIGN STUDY
ELT MASS-DIMM Calibration
Doc Nº. ELT-PLA-IAC-12200-0009
Issue 1.2 – DRAFT
24
thMarch 2008
Prepared by Héctor Vázquez Ramió, Antonia M. Varela, José Miguel Delgado, Marcos Reyes, Pablo Bonet
Approved by WP Management: UNI, ESO, IAC Released by IAC
CHANGE RECORD
Issue Date Section / Paragraph
affected Reason / Initiation / Remarks
1.0 - DRAFT
03-10-07 All First issue, Draft for review
1.1 - DRAFT
5-12-07 Figures Draft for review. MASS filter applied.
1.2 - DRAFT
24-03-08 Figures Draft for review: DIMMs filters applied
Contents
Abbreviations ... 4
1 Scope of Document ... 5
2 Applicable and reference documents... 5
2.1 Applicable documents ... 5
2.2 Reference documents... 5
3 Observations summary ... 6
4 Calibration results... 8
Abbreviations
DS Design Study
DIMM Differential Image Motion Monitor
EC European Commission
ELT Extremely Large Telescope ESO European Southern Observatory FP6 Framework Programme 6
IAC Instituto de Astrofísica de Canarias ING Isaac Newton Group
JKT Jacobus Kapteyn Telescope
MASS Multi-Aperture Scintillation Sensor ORM Observatorio Roque de los Muchachos TBC To Be Confirmed
TBD To Be Defined
UNI University of Nice
1
Scope of Document
In the framework of the European Extremely Large Telescope (ELT) Design Study (DS), the partners participating in the Work Package (WP) 12200, “Site Characterisation: Instrumentation, Measurement and Modelling” have the responsibility of designing, building and operating standard site testing equipment, and performing long term measurement campaigns.
The aim of the present document is to report the results of the four nights cross-calibration performed at the ORM (La Palma, Spain) in order to calibrate the MASS-DIMM system with a stable existing DIMM (hereafter IAC-DIMM) AD01.
2
Applicable and reference documents
2.1 Applicable documents
The following documents of the exact issue are applicable to the present proposal. In the event of conflict between the documents referenced herein and the content of the present document, the content of the present document shall be taken as superseding requirement.
Ref. Document title Document number Issue
AD01 Measuring Astronomical Seeing: The DA/IAC DIMM 1995, PASP 107,265 AD02 AD03 AD04 AD05 AD06 AD07
2.2 Reference documents
Ref. DocumentRD01 Sarazin, M., Roddier, F. ““ (1990) A&A 227, 294
RD02 Vernin, J. & Muñoz-Tuñón, C. “Measuring Astronomical Seeing : The DA/IAC DIMM“ (1995), PASP 107, 265-272
3
Observations summary
The observations were performed during the nights from 10th to 13th September at the ORM, La Palma. Both MASS and DIMM devices were operating simultaneously, as well as the IAC-DIMM. The MASS-DIMM system consists of:
9 Celestron C11 (Ø11’). 9 ASTELCO mount. 9 PixelFly PCO CCD. 9 MASS-DIMM device.
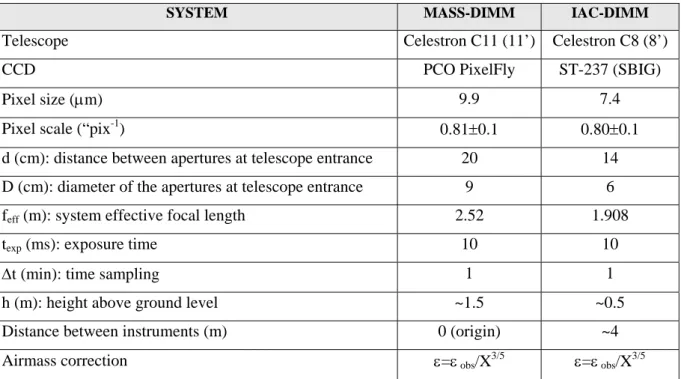
The main features of both DIMM systems are shown in the following table:
Table 1.Main characteristics of the two systems: MASS-DIMM and IAC-DIMM.
SYSTEM MASS-DIMM IAC-DIMM
Telescope Celestron C11 (11’) Celestron C8 (8’) CCD PCO PixelFly ST-237 (SBIG)
Pixel size (μm) 9.9 7.4
Pixel scale (“pix-1) 0.81±0.1 0.80±0.1 d (cm): distance between apertures at telescope entrance 20 14 D (cm): diameter of the apertures at telescope entrance 9 6 feff (m): system effective focal length 2.52 1.908
texp (ms): exposure time 10 10
Δt (min): time sampling 1 1
h (m): height above ground level ~1.5 ~0.5 Distance between instruments (m) 0 (origin) ~4 Airmass correction ε=ε obs/X
3/5 ε
=ε obs/X 3/5
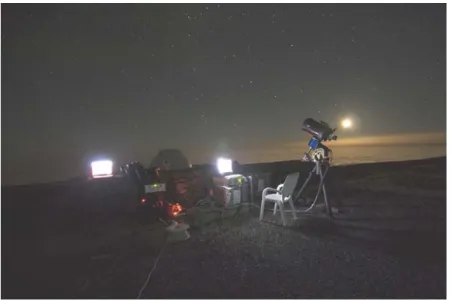
The two telescopes were located near the JKT building close to each other, within a distance of approximately 4 meters and, given the differences in their tripods, there exists also a difference between MASS-DIMM and IAC-DIMM heights. Fig. 1 and Fig. 2
illustrate the systems location and layout. Note that the location shown in Fig. 2 is not where the calibration took place (unfortunately pictures were not taken during the calibration), but the picture shows a very similar relative positions of both instruments. As can be seeing in Table 1, the pixel scales of both instruments (which were measured empirically through the observation of a double star with known angular separation) are almost the same, so similar performances were expected of both systems. Differences in the measurements might arise from the fact that IAC-DIMM was assembled employing a temporary tripod, by far less robust than MASS-DIMM’s and so, more sensitive to wind gusts.
It has to be also taken into account that the sensitivity of DIMM part of the MASS-DIMM and IAC-DIMM is not the same in such a way that it was not always possible to observe the same star either due saturation (MASS-DIMM) or for too low number of counts (IAC-DIMM). The observation was made trying to select targets with suitable brightness and as near to the zenith as possible.
Figure 1.Satellite picture of the calibration location inside the ORM. The places where MASS-DIMM and IAC-DIMM were located (close to the JKT building) are indicated by
the arrows and the labels.
Figure 2.Picture showing the situation of the two systems: IAC-DIMM and MASS-DIMM. The place that can be seeing is not the one where the observations were carried out, but
the relative distances between the systems is very similar. Note the differences in height due to tripods.
4
Calibration results
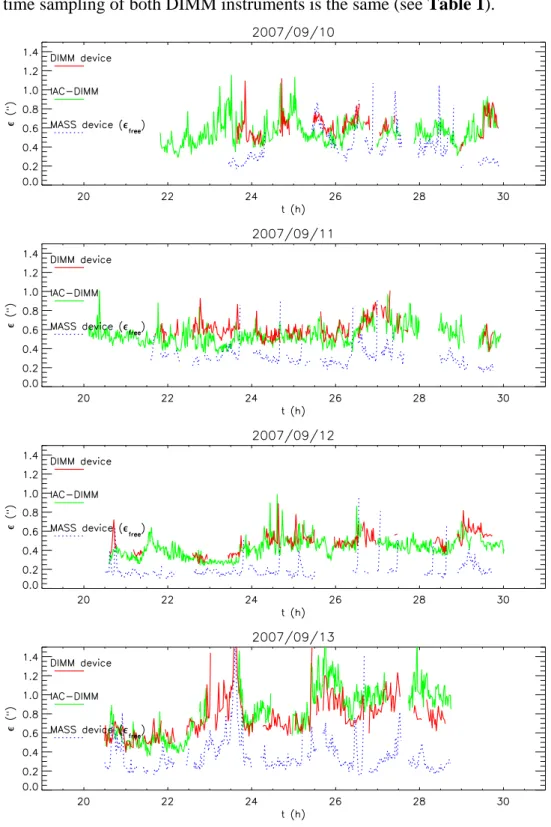
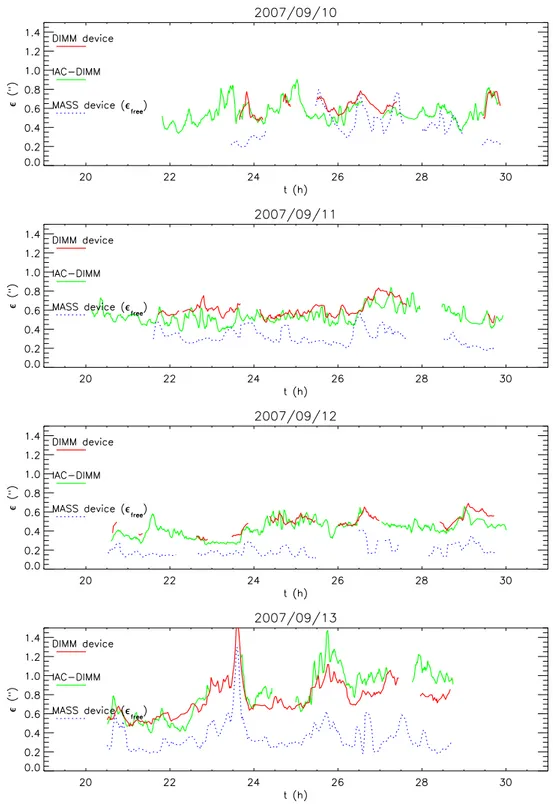
After the acquisition of data, they were analyzed and compared. Seeing (from DIMMs devices) and free seeing (from MASS device part) time series are plotted in Fig. 3. Data shown in Fig. 4 have been smoothed by a moving mean of 5 data, so every 5 min; note that the time sampling of both DIMM instruments is the same (see Table 1).
Figure 3.Seeing values obtained by DIMMs devices and the free seeing provided by MASS device.
Figure 4.Seeing values obtained by DIMMs devices and the free seeing provided by MASS device. All three data sets were average every 5 min.
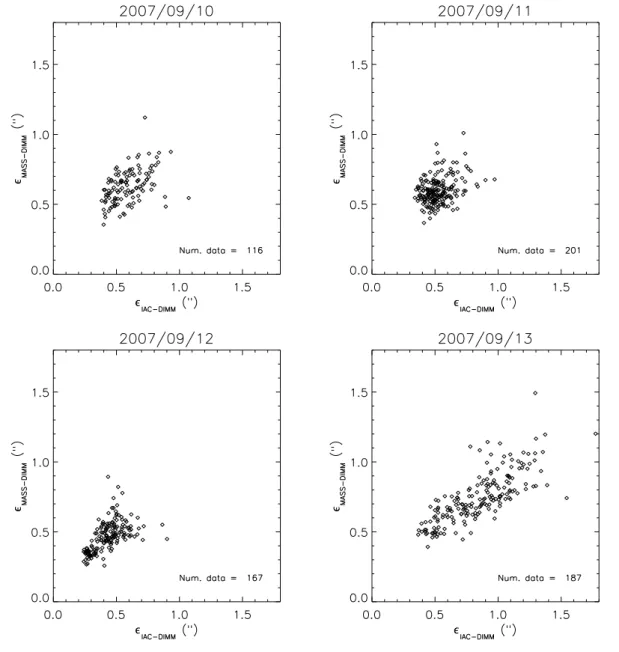
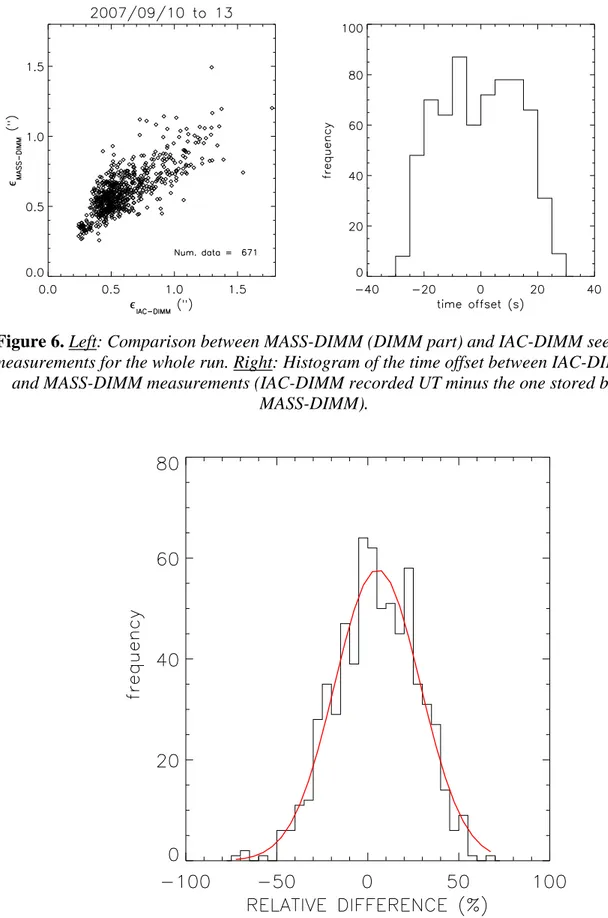
IAC-DIMM measurements and those taken by DIMM device of MASS-DIMM have been compared in the plots shown in Fig. 5 for every night of the calibration campaign. Given that data were not acquired at exactly the same time, a range of Δt = ±30s has been defined in order to decide whether a pair of measurements can be considered simultaneous or not. If so, they are included in the plots. Fig. 6 shows the resulting plot of the entire run, as well as a histogram of the time offsets between both instruments recorded UT corresponding to the plotted data.
Fig. 3 and Fig. 4 show data after performing the filtering:
o MASS filtering in order to reject data when the object is not well pointed (applying the filter provided by Marc Sarazin that removes the vignetted data and corrects for MASS overshooting).
o Only IAC-DIMM and DIMM device (MASS-DIMM) data with a ratio fwhml/fwhmt between 0.8 and 1.2 are included in the plot.
The relative differences between data coming from IAC-DIMM and DIMM device (MASS-DIMM) were computed as follows:
(
)
(%) 2 / 100 DIMM IAC device DIMM DIMM IAC device DIMM − − − − + − = ε ε ε ε δεA few statistical values of the relative differences between both devices:
o δε median = +4.4%
o δε mean = +4.5%
o δε standard deviation = 22.4%
o 95% of data considered as simultaneous; i.e. with Δt<30s, have relative differences less than 45%
The histogram of the observed relative differences is shown in Fig. 7. Additionally, assuming a normal distribution of δε, a Gaussian fit:
⎟⎟ ⎠ ⎞ ⎜⎜ ⎝ ⎛ − = 2 1 0exp ) ( A A A f δε δε
has been performed to data yielding the values of mean and standard deviation shown above.
Figure 5. Comparison between MASS-DIMM (DIMM part) and IAC-DIMM seeing
Figure 6. Left: Comparison between MASS-DIMM (DIMM part) and IAC-DIMM seeing
measurements for the whole run. Right: Histogram of the time offset between IAC-DIMM and MASS-DIMM measurements (IAC-DIMM recorded UT minus the one stored by
MASS-DIMM).
Figure 7. Histogram of the relative differences δε between the seeing values measured by
IAC-DIMM and DIMM part of the MASS-DIMM (in percentage). A Gaussian fit is also shown in red.
The main results can be summed up as follows:
1. There exists a very good agreement between MASS-DIMM and IAC-DIMM measurements. The time evolution of seeing values retrieved by both exhibit highly correlated variations, showing the same main features.
2. The free seeing provided by MASS device of MASS-DIMM is lower than that observed by DIMM part, as expected.
3. Seeing values coming from DIMM devices were compared. The histogram of their relative differences fits well with a normal distribution with mean value 4.5% and standard deviation 22.4%. For a seeing value of 1.5”, this means that the mean difference between instrument measurements is expected to be 0.07” ± 0.34”, being DIMM part of the MASS-DIMM device expected measurement higher than that of IAC-DIMM.
4. The few discrepancies observed sometimes between both instruments during the run could be attributed to the different instrument tripods robustness (being IAC-DIMM’s more sensitive to wind gusts than MASS-IAC-DIMM’s) and particular wind speed and direction regimes that can have some effect on measurements. In that regard, whether conditions are available in the ING’s web site:
http://catserver.ing.iac.es/weather/archive/index.php
5
Conclusions
The overall conclusion of the calibration run is that the DIMM part of the MASS-DIMM was successfully calibrated employing IAC-DIMM.