White Papers for: “Toward
Zero
Deaths:
A
National
Strategy
on
Highway
Safety
—White
Paper
No.
8—
Data
Systems
and
Analysis
Tools
Prepared by:
Barbara Hilger DeLucia
Data Nexus, Inc.
Geni Bahar, P.E.
NAVIGATS Inc.
Under Subcontract to:
Vanasse Hangen Brustlin, Inc.
Prepared for:
Federal Highway Administration
Office of Safety
Under:
Contract DTFH61‐05‐D‐00024
Task Order T‐10‐001
ii
(To be prepared by FHWA)
NOTICE
This document is disseminated under the sponsorship of the U.S. Department of
Transportation in the interest of information exchange. The United States Government assumes no liability for its contents or use thereof.
The contents of this report reflect the views of the author, who is responsible for the accuracy of the data presented herein. The contents do not necessarily reflect the official policy of the Department of Transportation.
iii
safety plans, there is not a singular strategy that unites all of these common efforts. FHWA began the dialogue towards creating a national strategic highway safety plan at a workshop in Savannah, Georgia, on September 2‐3, 2009. The majority of participants expressed that there should be a highway safety vision to which the nation aspire, even if at that point in the process it was not clear how or when it could be realized. The Savannah group
concluded that the elimination of highway deaths is the appropriate goal, as even one death is unacceptable. With this input from over 70 workshop participants and further
discussions with the Steering Committee following the workshop, the name of this effort became “Toward Zero Deaths: A National Strategy on Highway Safety.” The National Strategy on Highway Safety is to be data‐driven and incorporate education, enforcement, engineering, and emergency medical services. It can be used as a guide and framework by safety stakeholder organizations to enhance current national, state, and local safety planning and implementation efforts.
One of the initial efforts in the process for developing a National Strategy on Highway Safety is the preparation of white papers that highlight the key issue areas that may be addressed as part of the process for developing a National Strategy on Highway Safety. Vanasse Hangen Brustlin was awarded a task order under the Office of Safety contract (DTFH61‐05‐D‐00024) to prepare nine white papers on the following topics:
1. Future View of Transportation: Implications for Safety 2. Safety Culture
3. Safer Drivers 4. Safer Vehicles
5. Safer Vulnerable Users 6. Safer Infrastructure
7. Emergency Medical Services 8. Data Systems and Analysis Tools 9. Lessons Learned from Other Countries
Good data and good tools to assess the data are the foundation for safety decision makers. The more important determinants of success for data systems are collecting timely, accurate, and complete data efficiently, coupled with the ease of integrating (or linkages) and accessing the data for reporting and analysis. Co‐authors Barbara Hilger Delucia and Geni Bahar examine the importance and future of data systems and analysis tools and the role of each in working towards zero deaths.
Hugh W. McGee, Ph.D., P.E. Principal Investigator
iv
2020 VISION OF DATA SYSTEMS AND ANALYSIS ... 1
INTRODUCTION ... 2 STAKEHOLDERS ... 2 DATA SYSTEMS ... 3 ANALYTIC TOOLS ... 11 Information Sources ... 12 Analytical Tools ... 19
STRATEGIES AND INITIATIVES ... 27
Data Systems Strategies and Initiatives ... 27
Data Analysis Strategies and Initiatives ... 29
1
2020 VISION OF DATA SYSTEMS AND ANALYSIS
Imagine the day when a crash occurs, the location is known by its geographic
position immediately, the driver, passengers, and other road users are issued an
incident number that will allow us to follow up on the impact of the crash using
data from other systems, facilitating adjudication, medical care, training,
licensing, vehicle use, and other key safety aspects of transportation.
Imagine the day when crash data are transmitted from the vehicle, accurately
located by GPS to link with roadway and traffic conditions. The event data
recorder from the vehicle transfers information about the moments before the
crash to a data warehouse or knowledge base of analysts, thereby providing
linkage to further data sources for safety analysis.
Imagine the day when traffic movements are continuously assessed at real time
and these data are analyzed for instant response and prevention of collisions.
Imagine the day when data systems and analysis tools are available to evaluate
the strategies and initiatives discussed in the white papers for the other key
areas, as well as, for assessing progress in the implementation of the national
strategy for highway safety Toward Zero Deaths and significant decreases in
seriously injured persons.
These analyses and the frequent dissemination of their results to experts and
decision makers are fundamental to gain continuous support for the
advancements and innovations in safety, and develop confidence in strategies
for new implementations. These include infrastructure treatments, driver-based
vehicle tools, changes in emergency medical services, etc.
2
INTRODUCTION
Moving effectively Toward Zero Deaths: A National Strategy in Highway Safety requires that serious thought be given to the data systems and analysis tools that will be required to measure the efficacy and progress toward achieving that strategy. New data sources, yet unidentified or available, maybe needed to facilitate more effective safety data collection, quality, and
completeness. All the while, fewer resources will be available to the multitude of jurisdictions that continue to replicate data collection and management of systems available from other jurisdictions or agencies. Past President of AASHTO and Director of the Missouri Department of Transportation (DOT), Peter Rahn, described the “challenges that state DOTs face in doing more with less” and he recommends using a “practical design” during tight budget times.1 Making data-driven decisions to move toward strategic goals and key emphasis areas requires integrating information from numerous data systems from, at a minimum, the 4Es (engineering, education, enforcement, and emergency medical services). Activities and decisions for each of the 4Es occur in all jurisdictions and often for other primary strategic functions; e.g., titling vehicles, licensing drivers, performing medical procedures. In recent years, regional fusion centers are using much of the same data to perform activities for homeland security. Agency leaders are beginning to understand the fundamental need for allocating attention and resources to data collection and management, data processing, and to developing cooperation among related agencies. Better communication of intra- and interagency data needs and business requirements, along with modern systems development, management processes, and applicable technologies will pave the way for providing data and analysis for decisions made to accomplish the Toward Zero Deaths strategy.
STAKEHOLDERS
Current sources of safety-related data and an example of the breadth of stakeholders are outlined in material used to develop FHWA’s Strategic Highway Safety Planning.2 Each locality, region, and state may have these stakeholders in common, as well as unique stakeholders that are a specific concern for that jurisdiction.
Department of Motor Vehicles Fire and Rescue Community Governor’s Highway Safety Office Highway Safety Advocates
Insurance Industry Judicial Community
3 Motor Carrier Agencies
Municipal Planning Organizations Public Health Agencies
State Department of Transportation State and Local Transportation Agencies Railroad Community
The issue of improving data systems to support the TZD strategy becomes very complex because these stakeholders collect and use their data systems for regulatory purposes, as well as provide data from their systems to other stakeholders for their safety analyses. A great deal of progress has been made toward removing institutional barriers and in understanding the relevant problems in obtaining adequate safety-related data for analysis. Safety-LU legislation has required certain state improvements in communication in order to qualify for Section 408 Safety Data Grants.3 For example, most states now have a traffic records coordinating committee, or its equivalent, to provide a forum for communications about data projects among stakeholders. The legislation further requires peer assessments of traffic records and strategic plans for improving traffic records.
DATA SYSTEMS
Figure 1 is an overview of the types of data typically
used to support strategic planning and analysis for highway safety improvements4. Throughout the years of analyzing safety data, sources of data have expanded and will likely do so in the future. Within these components and among various jurisdictions, these systems come in numerous configurations and are maintained through many different methods. While it is useful to identify progress toward reduced fatalities by analyzing data from the Fatality
Analysis Reporting System (FARS)5, it is even more important to be able to analyze non-fatal data to identify crashes that previously might have resulted in fatalities, but instead resulted in lower levels of injury or no injuries at all. In terms of measuring
success for the TZD strategy, no single set of databases will be ideal to identify progress in all jurisdictions and all agencies. The more important determinant of success will be effectively
4
collecting timely, accurate, and complete data, coupled with the facility of linking these data for reporting and analysis.
Each of the following is an example of currently available data resources for safety analysis. Each data resource is presented with its website address and a short description.
FARS (Fatality Analysis Reporting System) (on-going)
Links: http://www-fars.nhtsa.dot.gov, ftp://ftp.nhtsa.dot.gov/FARS/data
Description: Created by NHTSA to provide an accurate and complete depository of data
about crashes involving fatalities. This data repository is a measure for evaluating safety standards and programs. Includes data from all United States, including District of
Columbia and Puerto Rico. This database only includes crashes that happened in publicly accessible roads that resulted in a fatality within 30 days of collision time. Total fatalities information exceeds 1 million incidents.
Capabilities:
Data in Hypertext Transfer Protocol (HTTP) site for 1994-2008. Data in File Transfer Protocol (FTP) site for 1975-2008.
Data cubes (trends in time) for all variables are available. Custom queries for single years.
Over 100 variables related to vehicles, people, speed, conditions, States, etc. Export query results as flat text file, MS Excel file and graphs.
FARS Query System and FARS Encyclopedia Can download publications and reports.
Can get all data through FTP protocol. Can perform special requests for reports.
Can map all queries to GIS maps per state at the county level. Can view crash locations with Google Earth browser plug-in. Training and help is available.
NASS GES (National Automotive Sampling System - General Estimates System) (on-going)
Link: http://www.nhtsa.gov/people/ncsa/nass_ges.html, ftp://ftp.nhtsa.dot.gov/GES/
Description: Created by the NHTSA to provide an accurate and complete depository of
information. Data in this database come from a representative sample nationwide. The country is divided in about 1,200 sampling units and grouped in different categories by geographic location and type (urban, suburban, and rural). This database includes crashes
5
for which a police accident report has been completed, at least one vehicle was involved and there was property damage, injury or fatality. The sample pool is about 50,000 police accident reports per year and only data from these police reports are included. NHTSA produces an annual report (Traffic Safety Facts) which combines these data with data from FARS (Item #1).
Capabilities:
FTP site data 1988-2008.
NHTSA provides pre-built reports in the annual publications.
FTP site provides flat text files as well as SAS database files per year.
NASS CDS (National Automotive Sampling System--Crashworthiness Data System)
(on-going)
Link: http://www.nhtsa.gov/people/ncsa/nass_cds.html, ftp://ftp.nhtsa.dot.gov/NASS/
Description: Created by the NHTSA in 1979 as part of an effort to reduce motor vehicle
crashes. This system is operated by the National Center for Statistics and Analysis (NCSA) part of the NHTSA operating under the U.S. Department of Transportation. NASS consists of about 5,000 crashes per year from everywhere in the spectrum of severity. Twenty-four field research teams investigate the crashes and study evidence such as skid marks, guardrails, glass, air bags, in an effort to understand the nature and consequences of the crashes. The teams are involved in a thorough investigation
including photographs, interviews, and medical records. All private information is treated according to the law.
Capabilities:
FTP site data 1979-2008.
FTP site provides flat text files as well as SAS database files per year.
HSIS (Highway Safety Information System) (on-going)
Link: http://www.hsisinfo.org/
Description: HSIS is database that contains crash, roadway inventory, and traffic volume
data for California, Minnesota, Illinois, North Carolina, Maine, Ohio, Michigan, Utah and Washington. The years of data available and data types vary according to State; usually include crash, road and traffic information. The HSIS is operated by the University of North Carolina Highway Safety Research Center (HSRC) and LENDIS Corporation, under contract with Federal Highway Administration (FHWA).
6
Capabilities:
Multiple reports and publications.
Pedestrian and bicycle GIS safety analysis tools (refer to tool #24). GIS safety analysis tools.
Pedestrian and bicycle crash analysis tool. Guidebooks available for each State. Data are available upon electronic request.
LTCCS (Large Truck Crash Causation Study) (single timeframe)
Link: http://ai.fmcsa.dot.gov/ltccs/default.asp?page=about
Description: LTCCS was a one-time study completed in 2006 which investigated crashes
involving large trucks between 2001 and 2003. The aim of the study was to identify the critical events and associated factors that contribute to serious large truck crashes. Therefore, leading the way into implementing effective countermeasures in order to reduce the occurrence and severity of these crashes. Sampling from 17 States was the collection method and qualifying crashes involved at least one large truck and resulted to at least one fatality or injury. A total of 1,000 elements per crash were recorded for 967 crashes.
Capabilities:
Data files available in MS Excel, SAS database and flat text file. (http://ai.fmcsa.dot.gov/ltccs/default.asp?page=data)
Report available.
Summary tables available.
CODES (Crash Outcome Data Evaluation System) (on-going)
Link: http://icsw.nhtsa.gov/people/ncsa/codes/
Description: CODES is an effort to develop hospital-level crash cost data. A report is
documents information about medical cost and funding agencies; it is meant to create a link between motor vehicle crashes, injuries, and medical costs toward improved highway safety and injury control decision making. To measure benefits in terms of reducing death, disability, and medical costs, NHTSA determined that State-wide data were needed that included all persons involved in police-reported crashes, regardless of injury. In this manner, comparisons between those using and not using safety belts or motorcycle helmets could be made by identifying and contrasting the characteristics of
7
the injured and uninjured persons within each of the restraint use groups. This report was delivered to Congress in 1996.
Capabilities:
Data are not available in a unified place, only in a report.
State level data are available on some Web sites with pre-determined reporting capability, while other participating States do not share the data or information openly.
NHTSA Vehicle Crash Test Database (on-going)
Link: http://www-nrd.nhtsa.dot.gov/database/veh/veh.htm
Description: The NHTSA Vehicle Crash Test Database contains engineering data measured
during various types of research, the New Car Assessment Program (NCAP), and compliance crash tests. Information in this database refers to the performance and response of vehicles and other structures they impact. New cars and tests are included as they are available after they have been reviewed for quality. The database is comprised of 6 tables that capture all relevant information about the car and the test.
Capabilities:
Query by: test, vehicle and barrier parameters. Browse all available tests
Photos of results of tests
View sorted catalogues of vehicles, tests and events. Export the database to flat text file
DDACTS (Data-driven Approaches to Crime and Traffic Safety) (on-going)
Link: http://stko.maryland.gov/DDACTS/tabid/127/Default.aspx
Description: DDACTS is a geo-mapping tool that integrates location-based crime, crash and
traffic data. GIS mapping of localized problems can graphically represent where issues are occurring. Often crime and crashes occur in the same location; the tool identifies these correlations visually as hot-spots. Further, the crime, crash and traffic data is coded for type of incident, time of day and week, and location. Additional data may include citizen complaints, dangerous driving behaviors, information about suspended or revoked licenses, and wanted persons. NHTSA, Department of Justice, Bureau of Justice
8
technical assistance teams work with local law enforcement agencies on DDACTS, serve as intermediaries to identify local partnerships, and obtain technical assistance from local affiliates and State agencies.
Capabilities: Reports
GIS integrated maps that overlay crime, crash, and traffic data
Distinguish causation factors, delineate time elements, and considers environmental influences on crime and crashes.
Potential Expansions / Modifications: Integrate other data sources such as emergency
department information.
Plan4Safety – New Jersey DOT (on-going)
Link: http://cait.rutgers.edu/tsrc/plan4safety
Description: Plan4Safety is a multilayered decision support tool created for the New Jersey
Department of Transportation (NJDOT). Through the tool, state-wide crash data can be analyzed in geospatial and tabular forms. The analysis also includes roadway
characteristic data, calculates statistical analyses, incorporates network screening layers and models, and includes visual analytical tools (GIS). The software also contains
essential tools for examining incident patterns and properties. The database has crash data from January 1, 2003 to current release. The Plan4Safety team is working with NJDOT and NJ OIT to develop a crash data warehouse that will merge many sources of data (including crash data) to answer questions we have been unable to ask in the past. When this system goes online, Plan4Safety will be sitting on top of a warehouse that will update nightly. This means that all crashes that have been put into the system up to the day before will be available. The current time lapse is approximately 3 weeks to input crash data. With the electronic data transfer initiative, the goal is to shorten that lapse to 3 days.
Capabilities:
Geospatial and tabular forms crash data analysis Statistical analyses
9
NITS (Not-In-Traffic Surveillance System) (on-going)
Link: ftp://ftp.nhtsa.dot.gov/NiTS/
Description: The Not-in-Traffic Surveillance (NiTS) system developed for the National
Centre for Statistics and Analysis (NCSA) is a virtual data collection system designed to provide counts and details regarding fatalities and injuries that occur in non-traffic crashes and in non-crash incidents. It is comprised of four major components: three databases and one collection of investigations. The first database contains information on fatal and injury non-traffic crashes extracted from police reports. The second database is based upon death certificate information for non-crash fatalities. The third database is comprised of non-crash injuries information from a nationally representative sample of emergency department records. The fourth element is a collection of detailed
investigations of particular types of incidents conducted by NHTSA’s Special Crash Investigations (SCI) program. Since the statistical sample of non-traffic crash fatalities from police jurisdictions is not complete, an adjustment factor was developed; it accounts for the difference between the expected number of fatalities based on death certificates and the number of fatalities in the police sample. For non-traffic injuries, information from three States in the State Data System is used to adjust for the expected number of non-traffic crash injuries and the numbered received.
Capabilities:
Microsoft Excel files for aggregate information about the age of the victims, the injury mechanisms, and the locations of the incidents (non-crash fatalities and injuries).
SAS analysis file.
Case searching system (http://www-nass.nhtsa.dot.gov/BIN/logon.exe/airmislogon).
NEMSIS (National Emergency Medical Services Information System) (on-going)
Link: http://www.nemsis.org/
Description: This system is a step towards the direction of a nationwide Emergency Medical
Services (EMS) database. NEMSIS is helping States collect and standardize data and eventually submit these data to the national EMS database. NEMSIS is using the eXtensible Markup Language (XML) and XML Schema Definition (XSD) standards to move data from and to multiple systems. The system is comprised of different datasets such as EMS and Demographics and numerous professional organizations are involved.
10
Capabilities:
Database scripts are available for Microsoft and Oracle products. User manual and help are available.
Data submission center to be used to include data in NEMSIS. Articles, publications, presentations, data dictionaries.
Querying and dynamic reports are available. Can request dataset electronically.
NMVCCS (National Motor Vehicle Crash Causation Survey) (single timeframe) Link:
http://www.nhtsa.dot.gov/portal/nhtsa_static_file_downloader.jsp?file=/staticfiles/DOT/ NHTSA/NCSA/Content/NMVCCS/811052.pdf
Description: NHTSA conducted this survey under orders from the Congress in order to
investigate 6,949 crashes that occurred between 2005 and 2007. The results of this survey were to be used in developing vehicle-related crash avoidance technologies. Crashes that qualified for this survey involved at least one light passenger vehicle that was towed due to damage. At least 600 data elements were collected for each crash including
information about the drivers, vehicles, roads, environment, photos, narratives, diagrams, and other data recorders’.
Capabilities:
Frequency distributions and percentages (weighted and un-weighted). Online search capability for a case.
Can download an archive file with per case information: photos, schematics, etc.
NOPUS (National Occupant Protection Use Survey) (single timeframe)
Link: http://www-nrd.nhtsa.dot.gov/Pubs/811254.PDF
Description: NOPUS was a one-time study completed in 2009 which investigated the use of
helmets by motorcyclists in USA. The data used were probability-based observation data at sampled roadways. Observers were either stationary or moving with traffic, during day-light hours. Data were collected for 3 weeks in June for 2008 and 2009.
Capabilities:
11
NSUBS (National Survey of the Use of Booster Seats) (single timeframe)
Link: http://www-nrd.nhtsa.dot.gov/Pubs/811121.pdf
Description: NSUBS was a one-time survey completed in 2008 which investigated the use
of child booster seats in passenger vehicles. Data were collected by sending trained data collectors to a probability sample of gas stations, day care centers, recreation centers, and restaurants in five national fast food chains across the United States. This was necessary in order to observe restraint use from a close range in a slow-moving or stopped vehicle. After the observation interviews were conducted in order to inform the passengers and capture additional data (heights, ages, ethnicity, etc). A total of 6,200 vehicles were observed and 7,632 children were covered in the interviews.
Capabilities:
Predefined charts and table available only in PDF format.
ANALYTIC TOOLS
State and local highway agencies are faced with the challenge to prove that the countermeasures they select and implement are the “right” ones, and that, once implemented, they have had the desired impact on safety. The days of simplistic analyses comparing before- and after-
implementation periods and claiming success whenever the number of crashes dropped between these two slices in time is rapidly drawing to a close. The release of the Highway Safety
Manual6 is a signpost on the road to a more scientific approach. It gives practitioners the guidance they need to do a better job of using the available data to make highway safety decisions. To aid in this transition, FHWA, AASHTO, TRB, university-based researchers, and DOTs are all working to develop, release and maintain a series of tools and electronic resources. This section of the white paper describes the existing tools and resources and provides a view of the near future in which these aids are in common use throughout the US.
The primary information resources, including the HSM itself, provide guidance on how to conduct valid data analyses in support of Problem Identification, Countermeasure Selection, and Program/Project Evaluation. The associated analytic tools aid practitioners in analyzing their own data or, where necessary, applying nationally-representative data to a local- or state-specific problem or implementation.
When the tools and resources are used correctly, the practitioner is guaranteed of two things:
1) That the analytic results are valid and “state-of-the-practice” with respect to emerging standards in highway safety, and,
12
2) That over time the decisions made using those analytic results will be of generally higher quality, more easily verified, and more defensible.
It is expected that as more DOTs adopt the methods described in the Highway Safety Manual the need for analytic expertise (including high level statistical data analysis) and for expansion of the available tools will become a growing issue. It is with that eventual expansion in mind that the following descriptions of tools and resources are provided.
This section provides examples of state-of the-practice resources and analytical tools. Each resource or tool is presented with its Web link address, a short description and capabilities, and brief suggestions for future modifications/expansions to meet current or likely future needs. The items are grouped by their functionality; i.e., resource or analytical tool. These are defined as:
Resources – provide static information or guidance that users may consult when
designing an analysis or gathering national data for potential application to a state or local problem.
Analytic tools – provide database, analysis and reporting functions for use by practitioners in completing Problem Identification, Countermeasure Selection and Program/Project Evaluation.
In addition, each resource is recognized as on-going meaning that data or information are entered periodically or single timeframe meaning that data were entered for a single time period only. Each tool is recognized as completed or under-development (as of June 2010).
InformationSources
HSM knowledge base (single timeframe)
Link: http://www.cmfclearinghouse.org/collateral/HSM_knowledge_document.pdf
Description: This knowledge base is an extensive literature review that was created for the
development of chapters for the AASHTO Highway Safety Manual (Tool #19). The version found on the clearinghouse was updated in 2008. The information in the report is structured by themes: Roadway Segments, Intersections, Interchanges, Special Facilities and Geometric Situations, and Road Networks. The safety effects of implementing specific treatments are presented as Accident Modification Factors (AMF, also known as Crash Modification Factors, CMF) varying by severity, traffic volume, urban/rural, etc. Each AMF/CMF is accompanied by a measure of accuracy in terms of its standard error.
Capabilities:
The largest literature review ever completed and available for all professionals seeking to find the knowledge base about a particular treatment
13
Potential Expansions / Modifications: Create an on-going mechanism to keep the
knowledge base updated with new research and evaluation of treatments; it could also be changed to a hyperlinked document for ease of access.
CMF Clearinghouse (on-going)
Link: http://www.cmfclearinghouse.org/
Description: This website was established in order to provide a regularly updated, online
repository of CMFs. The CMF Clearinghouse summarizes published information on each CMF, including how it was developed (e.g., study design, sample size, and source of data) and what are its statistical properties (e.g., standard error). Where available, a link is provided to the publication from which the CMF was extracted. The CMFs that passed the inclusion rule and are found in the AASHTO HSM are noted as such here. The CMFs are graded with a star quality rating depending on the study quality or methodology used to estimate the CMF.
Capabilities:
CMF search engine.
Potential Expansions / Modifications: Develop a SPF Clearinghouse to similarly support
the users of the HSM with national and locally calibrated models.
Pedestrian and Bicycle Clearinghouse (on-going)
Link: http://www.pedbikeinfo.org/
Description: The pedestrian and bicycle clearinghouse is PBIC is funded by the U.S.
Department of Transportation Federal Highway Administration and maintained by the University of North Carolina Highway Safety Research Center, in cooperation with the Association of Pedestrian and Bicycle Professionals. It is an umbrella project that includes: walkinginfo.org, a website dedicated to pedestrian safety that also hosts PEDSAFE (tool #26); bicyclinginfo.org a similar site for bicycle safety that also hosts BIKESAFE (tool #27); and pedbikeimages.org a website hosting a depository of images related to these areas.
Capabilities:
The first two sites offer a broad and in-depth source of information in the areas of pedestrian and bicycle safety: Guides, assistance, plans, education, law information, library, training information, speaker search, news, email lists, etc.
14
The image depository offers free to use images as long as the source is mentioned and individuals can contribute their own related images.
Potential Expansions / Modifications: NA (or continue to update the clearinghouse, if this
is not the current situation)
AASHTO (American Association of State Highway and Transportation Officials) 500 Series Reports (single timeframe)
Link: http://safety.transportation.org/guides.aspx
Description: The 500 series is a group or reports in which relevant information is assembled
into single concise volumes, each pertaining to emphasis areas, specific types of crashes, or contributing factors. All volumes include possible countermeasures for dealing with
particular areas. There are plans for future volumes and currently the volumes available are: Volume 01: A Guide for Addressing Aggressive-Driving Collisions
Volume 02: A Guide for Addressing Collisions Involving Unlicensed Drivers and Drivers with Suspended or Revoked Licenses
Volume 03: A Guide for Addressing Collisions with Trees in Hazardous Locations Volume 04: A Guide for Addressing Head-On Collisions
Volume 05: A Guide for Addressing Unsignalized Intersection Collisions Volume 06: A Guide for Addressing Run-Off-Road Collisions
Volume 07: A Guide for Reducing Collisions on Horizontal Curves Volume 08: A Guide for Reducing Collisions Involving Utility Poles Volume 09: A Guide for Reducing Collisions Involving Older Drivers Volume 10: A Guide for Reducing Collisions Involving Pedestrians Volume 11: A Guide for Increasing Seat Belt Use
Volume 12: A Guide for Reducing Collisions at Signalized Intersections Volume 13: A Guide for Reducing Collisions Involving Heavy Trucks Volume 14: Reducing Crashes Involving Drowsy and Distracted Drivers Volume 15: A Guide for Enhancing Rural Emergency Medical Services Volume 16: A Guide for Reducing Crashes Involving Alcohol
15
Volume 18: A Guide for Reducing Head-On Crashes on Freeways
Volume 19: A Guide for Collecting and Analyzing Safety Highway Safety Data Volume 20: A Guide for Reducing Head-on Crashes on Freeways
Volume 21: Safety Data and Analysis in Developing Emphasis Area Plans
Volume 22: Guidance for Implementation of the AASHTO Strategic Highway Safety Plan
Volume 23: A Guide for Reducing Speeding-Related Crashes
Two companion documents complement the series; they are:
NCHRP Report 501 – Integrated Safety Management Process (2003) – provides a detailed outline of an integrated safety management system, required to effectively develop and implement a strategic highway safety program; it also provides detailed descriptions of tools such as methodologies for identification of crash concerns for and developing combinations of strategies for supporting jurisdictional goals (such as TZD); methodologies for estimating the effectiveness of promising or innovative strategies that have insufficient information; and methodologies for evaluating performance measures to determine the level of implementation and success in meeting of the goals of a SHSP.
Updated Transportation Planner’s Safety Desk Reference (February 2010) includes strategies derived from the NCHRP Report 500 Series volumes. All 22 emphasis areas are covered, as well as sections on collecting and analyzing highway safety data and developing emphasis area plans. This document discusses the planner’s role in transportation safety and the incorporation of safety into the transportation planning process.
Capabilities:
Volumes are available in PDF format and free for online download; alternatively copies are available at NCHRP.
Potential Expansions / Modifications: Create hyperlinked documents online with relevant
16
USRAP (United States Road Assessment Program) (on-going)
Link: http://www.usrap.us/home/
Description: This program was initiated as a pilot program by the American Automobile
Association Foundation for Traffic Safety (AAAFTS). The primary objectives are: to reduce fatalities by identifying major safety shortcomings; promote assessment of risk as a major part of strategic decisions on route improvements; and forge partnerships among all participants in road safety. Risk maps have been produced for the four initial pilot States. States have joined in subsequent phases, currently on Phase 3.
Capabilities:
Predefined risk assessment maps for participating States.
Potential Expansions / Modifications: Create a user interface allowing the creation of
subsets of the complete maps, in other words, users to create their own maps or extract from the existing maps. Develop a system of interaction between historical crash and annual statistics; revision of risk rankings with modifications to road networks etc.
CAMP (Crash Avoidance Metrics Partnership) (single timeframe) Link:
http://www.nhtsa.gov/Research/Crash+Avoidance/Office+of+Crash+Avoidance+Research+ Technical+Publications+2000-2010
Description: An initial partnership was formed between Ford and General Motors in 1995 in
order to accelerate the implementation of crash avoidance measures in passenger vehicles. In later years, more companies joined the effort, such as BMW, Nissan, Volkswagen and more. This larger partnership created the CAMP Light Vehicle Enabling Research Program, a 3-year program which produced several reports in this area as well as annual progress reports. The partners collaborated in various projects including: Forward Crash Warning
Requirements, Driver Workload Metrics, Enhanced Digital Maps for Safety, and Vehicle Safety Communications.
Capabilities:
Data only available through reports.
Potential Expansions / Modifications: Encourage this and similar partnerships to work with
the public agencies to integrate vehicle and road sensor/ readers for future traffic and road management (crash avoidance and traffic conditions; driver performance and vehicle response; location of vehicle and speed limiters, etc).
17
Data Systems: A Road Safety Manual for Decision-Makers and Practitioners (single timeframe)
Link: http://www.who.int/roadsafety/projects/manuals/data/en/
Description: This manual was drafted by the World Health Organization with collaboration
with other partners. It provides guidelines on data collection for road safety management. What data elements are required for effective planning and monitoring? It helps identify relevant stakeholders, existing data sources and systems as well as strategies for improving data quality. It provides guidance to users on how to disseminate data and maximize the likelihood of its use and how to use the data in order to improve road safety, monitor results and assess the impact of interventions. Several case studies have been drawn from around the world.
Capabilities:
Well presented guidelines in identifying the topics listed in the description above.
Potential Expansions / Modifications: Include in the HSM Knowledge base.
HSM (Highway Safety Manual) First Edition (on-going)
Link: http://www.highwaysafetymanual.org
Description: This manual was published on June 30, 2010 by the AASHTO. It will assist
highway agencies as they consider improvements to existing roadways or as they are planning, designing, or constructing new roadways. The HSM will present information on roadway safety fundamentals, the safety management process, models for estimating the expected safety performance of a specific facility, and crash modification factors for estimating the expected effectiveness of individual infrastructure-based countermeasures. The publication of the Manual is the result of a decade of research and development efforts of AASHTO, the Federal Highway Administration (FHWA), and the Transportation Research Board (TRB).
Capabilities:
Fundamentals of highway safety
Methods for developing and evaluating a roadway safety program Predictive methods to estimate crash frequency and severity Catalogue of crash modification factors for a variety of situations
Potential Expansions / Modifications: Develop a Web-based document that allows easy
18
Human Factors Guidelines for Road Systems - National Cooperative Highway Research Program (NCHRP) - Report 600A (under development – single timeframe)
Link: http://onlinepubs.trb.org/onlinepubs/nchrp/nchrp_rpt_600A.pdf
Description: This report published in 2008 is complimentary to the HSM. It contains
guidelines that provide human factors principles and findings for consideration by highway designers and traffic engineers. The guidelines allow the non-expert in human factors to more effectively consider the roadway user’s capabilities and limitations in the design and
operation of highway facilities.
Capabilities:
Data, charts, tables in report. Case studies
Potential Expansions / Modifications: It will be expanded as the next research projects
develop additional materials.
PEDSAFE (single timeframe)
Link: http://www.walkinginfo.org/pedsafe/
Description: The Pedestrian Safety Guide and Countermeasure Selection System is intended
to provide practitioners with the latest information available for improving the safety and mobility of those who walk. The online tools provide the user with a list of possible engineering, education, or enforcement treatments to improve pedestrian safety and/or mobility based on user input about a specific location.
Capabilities:
Selection Tool – find, through questionnaire the appropriate countermeasures on the basis of desired objectives and specific location information. Can output to excel. Interactive Matrices – view the countermeasures associated with crash types and
performance objectives.
Countermeasures – read descriptions of the 49 engineering, education, and enforcement treatments.
Case Studies – review real-world examples of implemented treatments.
19
BIKESAFE (single timeframe)
Link: http://www.bicyclinginfo.org/bikesafe/
Description: As per PEDSAFE, only for bicycle related countermeasures.
Capabilities: Same as PEDSAFE
Potential Expansions / Modifications: Refer to PEDSAFE
AnalyticalTools
SafetyAnalyst (completed)
Link: http://www.safetyanalyst.org/
Description: SafetyAnalyst provides a set of software tools to be used by State and local
highway agencies for highway safety management. SafetyAnalyst can be used by highway agencies to improve their programming of site-specific highway safety improvements. SafetyAnalyst incorporates state-of-the-art safety management approaches into computerized analytical tools for guiding the decision-making process to identify safety improvement needs and develop a systemwide program of site-specific improvement projects.
SafetyAnalyst has a strong basis in cost-effectiveness analysis; thus, SafetyAnalyst has an important role in ensuring that highway agencies get the greatest possible safety benefit from each dollar spent in the name of safety.
Capabilities:
Licensed tools
The Network Screening Tool identifies sites with potential for safety improvements. The Diagnosis Tool is used to diagnose the nature of safety problems at specific sites. The Countermeasure Selection Tool assists users in the selection of countermeasures
to reduce accident frequency and severity at specific sites.
The Economic Appraisal Tool performs an economic appraisal of a specific countermeasure or several alternative countermeasures for a specific site. The Priority Ranking Tool provides a priority ranking of sites and proposed
improvement projects based on the benefit and cost estimates determined by the economic appraisal tool.
The Countermeasure Evaluation Tool provides the capability to conduct before/after evaluations of implemented safety improvements.
Potential Expansions / Modifications: Additional road types and facilities to be added to all
20
IHSDM (Interactive Highway Safety Design Model) (on-going)
Link: http://www.tfhrc.gov/safety/ihsdm/ihsdm.htm
Description: IHSDM is a suite of software analysis tools for evaluating safety and
operational effects of geometric design decisions on highways. IHSDM is a decision-support tool. It checks existing or proposed highway designs against relevant design policy values and provides estimates of a design’s expected safety and operational performance. IHSDM results support decision making in the highway design process. Intended users include highway project managers, designers, and traffic and safety reviewers in State and local highway agencies and engineering consulting firms. IHSDM currently includes six evaluation modules (Crash Prediction, Design Consistency, Intersection Review, Policy Review, Traffic Analysis, and Driver/Vehicle).
Capabilities:
Designed in collaboration with the HSM
Fully compatible with prediction models found in the HSM
Potential Expansions / Modifications: Continue expanding with the new SPFs and CMFs
under development for interchange and freeways, etc.
PLANSAFE (under-development)
Link: http://trb.org/publications/nchrp/nchrp_rpt_546.pdf, Appendix C and D
Description: PLANSAFE is a tool developed but not yet released, that intends to forecast
safety effects at the level of the traffic analysis zone (TAZ) or higher. PLANSAFE is expected to be useful for evaluating transportation and safety-related policies and area-wide solutions. It will forecast the safety impacts of socio-demographic changes and alternative future growth and transportation investment scenarios. This proactive safety tool will enable planners to consider the safety impacts of transportation and infrastructure investments, alongside congestion and air quality impacts.
Capabilities:
GIS, census, roadway information and countermeasure input giving forecast results as map and tables.
Product will be available to the public, no pricing information is available.
21
FHWA GIS Safety Analysis Tools v4.0 (completed)
Link: http://www.hsisinfo.org/hsis.cfm?num=9&page=1
Description: Part of HSIS (Tool #4). This suite of pedestrian and bicycle safety tools is a set
of GIS based analytical techniques have been applied to a series of pedestrian and bicycle safety issues. They can only be used in conjunction with the ESRI ArcGIS suite, MS Access and Crystal Reports. Requires data from other source.
Capabilities:
Can calculate high pedestrian crash zones. Can draw safe routes for walking to school. Can draw safe bicycle routes.
Potential Expansions / Modifications: Redevelopment for easier access as it is very
restricting because it requires several other licensed software; and data.
PBCAT (Pedestrian and Bicycle Crash Analysis Tool) (completed)
Link: http://www.walkinginfo.org/facts/pbcat/index.cfm?/pc/pbcat.htm
Description: PBCAT is a crash manual-entry software product intended to assist state and
local pedestrian/bicycle coordinators, planners and engineers with improving walking and bicycling safety through the development and analysis of a database containing details associated with crashes between motor vehicles and pedestrians or bicyclists.
Capabilities:
Free Windows application.
Can design forms that resemble police reports that are used locally. Can enter location information.
Can generate crash reports. Can enter countermeasures.
Links to other countermeasure systems: PEDSAFE (#26) and BIKESAFE (#27). Can export data to MS Excel and SAS formats.
Potential Expansions / Modifications: Interconnection of applications is a step in the right
direction. This stand alone application needs to be transformed to a web based application that all police reports (assuming that they will also become electronic everywhere) involving pedestrians or bicyclists be automatically included for analysis.
22
Pedestrian and Bicycle GIS Safety Tools (completed)
Link: http://www.tfhrc.gov/safety/pedbike/pubs/05085/chapt3.htm
Description: Geographic information system (GIS) software turns statistical data (e.g.,
crashes) and geographic data (e.g., roads and crash locations) into meaningful information for spatial analysis and mapping. GIS is an invaluable tool being applied to many pedestrian and bicycle safety issues. It assists in mapping crashes to identify hot spots, planning the safest route to walk or bike based on roadway and traffic elements (sidewalk, curb lane width, crosswalk locations, traffic volume, etc.), and illustrating the relationships between land use, traffic patterns, and bicycle and pedestrian safety. This tool is valuable in helping visualize the data accumulated in crash and roadway databases.
Capabilities:
Mapping in GIS pedestrian and bicycle data Mapping relationships between data
Potential Expansions / Modifications: No comment
ISAT (Interchange Safety Analysis Tool) (on-going)
Link: http://safety.fhwa.dot.gov/tools/data_tools/iisat.cfm
Description: ISAT provides design and safety engineers with an automated tool for
assessing the safety effects of basic geometric design at typical existing interchange and adjacent roadway network. ISAT can also be used to predict the safety performance of design alternatives for new interchanges and prior to reconstruction of existing interchanges. The primary outputs from an analysis include: the number of predicted crashes for the entire interchange area, the number of predicted crashes by interchange element type, the number of predicted crashes by year, and the number of predicted crashes by collision type.
Capabilities:
Types of Analysis applications:
Application 1—Estimating the Safety Performance of an Existing Interchange Application 2—Predicting the Safety Performance of Design Alternatives for a New
Interchange
Application 3—Predicting the Safety Performance of Design Alternatives for an Existing Interchange
Application of ISAT to Specific Interchange Configurations Full Diamond Interchange
23 Full Cloverleaf Interchange
Directional Interchange
Extended Roadway Networks Near Interchanges
Potential Expansions / Modifications: develop a more robust tool; expand with better SPFs
and create more reliable CMFs (NCHRP 17-48 is developing the SPFs and CMFs – and these will be used in this tool and the HSM)
SSAM (Surrogate Safety Assessment Model) (completed)
Link: http://www.fhwa.dot.gov/publications/research/safety/08049/index.cfm
Description: To assess a traffic facility with SSAM, the facility is first modeled in VISSIM,
AIMSUN, Paramics, and TEXAS simulation models and then simulated with desired traffic conditions (typically simulating several replications with different random number seeds). Each simulation run results in a corresponding trajectory file, referred to as a TRJ file corresponding to the .trj filename extension. Then, SSAM is used as a post-processor to analyze the batch of TRJ files. SSAM analyzes vehicle-to-vehicle interactions to identify conflict events; it catalogs all events found. For each such event, SSAM also calculates several surrogate safety measures, including the following:
Minimum time-to-collision (TTC).
Minimum post-encroachment (PET).
Initial deceleration rate (DR).
Maximum deceleration rate (MaxD).
Maximum speed (MaxS).
Maximum speed differential (DeltaS).
Classification as lane-change, rear-end, or path-crossing event type.
Vehicle velocity change had the event proceeded to a crash (DeltaV).
Capabilities:
A table of all conflicts identified in the batch of analyzed TRJ files, including file, time, location, vehicles identifications, and several measures of conflict severity. A summary of conflict counts by type and file, with average values of surrogate
24
A filtering mechanism that allows the isolation of subsets of conflicts by ranges of surrogate safety measures, conflict type, network link, or a rectangular region of the network.
A facility for statistical comparisons of the conflict frequencies and values of surrogate safety measures for two alternative cases or designs using the Student t distribution for hypothesis testing.
A display of the location of conflicts on the network map, with icons of different shapes and colors assignable to different conflict types or severities.
Potential Expansions / Modifications: Real life testing
FEA (Finite Element Analysis) (completed)
Link: http://www.tfhrc.gov/safety/crash/index.htm
Description: Finite element analysis (FEA) is an efficient and cost-effective tool to assist in
the design of safer highway guardrails, bridge supports, signposts, and other roadside structures. It can be used to predict the outcome of a crash test. FEA of roadside safety features involves analyzing the computer-generated impact of two bodies (a model of a specific motor vehicle colliding into a model of a specific roadside safety structure).
Computer models of many motor vehicles that are currently in the national fleet are ready for use with this tool. These include models of specific vehicles that meet the NCHRP Report 350 vehicle criteria: a Geo Metro sedan, a Chevrolet C-2500 pickup truck, and an 18,000-lb. single-unit Ford truck. A model of a tractor-trailer is currently under development.
Capabilities:
Predict outcome of crash test.
Potential Expansions / Modifications: Add different models (both motor vehicle and
roadside safety structure)
VDA (Vehicle Dynamics Analysis) (completed)
Link: http://safety.fhwa.dot.gov/tools/data_tools/fhwasa09002/
Description: VDA, a digital simulation, analyses the effects of uneven terrain on the
trajectory of a vehicle driving over it. For a particular median profile and barrier location, VDA can indicate whether a particular vehicle at a given speed and impact angle is likely to go over the barrier, to under-ride the barrier, or properly engage the barrier. This application of vehicle dynamics analysis is strictly an interface analysis – it considers only whether the
25
vehicle and the barrier are well aligned at the instant of impact. For angles greater than 25 degrees the vehicle is more likely to hit the ground hard; this is not modeled in VDA.
Capabilities:
Digital simulation
Potential Expansions / Modifications: Expand to other barriers such as shrub or vegetation
barriers; and consider other considerations such as vehicle loading, weather, suspensions etc.
Key Initiative - SHRP 2 (on-going)
Source: SHRP2 2008 Annual Report and Strategic Highway Research Program (SHRP) 2 Revised Safety Research Plan: Making a Significant Improvement in Highway Safety, April 2010 (provided by Kenneth Campbell)
Description:
The 2nd Strategic Highway Research Program, known as SHRP2, was identified in the TRB Special Report 260, published in 2001. SHRP2 focuses on applied research in four areas: safety, renewal, reliability, and capacity.
The central goal of the SHRP 2 Safety Research Plan is to address the role of driver performance and behavior in traffic safety. This includes developing an understanding of how the driver interacts with and adapts to the vehicle, traffic environment, roadway characteristics, traffic control devices and the environment. It also includes assessing the changes in collision risk associated with each of these factors and interactions. This information will support the development of new and improved countermeasures with greater effectiveness, with particular focus to lane departure and intersection collisions. Two central issues for the planned analysis are the statistical relationship of surrogate measures of collisions (conflicts, critical incidents near-collisions, or roadside encroachment) with actual collisions, and the formulation of exposure-based risk measures using these surrogate measures.
The development of the analytical methods for the data to be collected has started in 2007 for
completion in 2010. Data collection will follow for a number of years before the analysis takes place.
Capabilities:
Extraordinary effort supported by significant funds to develop a knowledge base with data to be collected by means of modern technology. The table shown here provides the timelines for SHRP 2 projects and allocated respective funds.
26
SHRP 2 Safety Projects (Source: SHRP2 2008 Annual Report) Project
Number Project Title Budget Start
S01 Development of Analysis Methods using Recent Data; 4 contracts: A) University of Minnesota Center for Transportation Studies B) Pennsylvania Transportation Institute C) University of Michigan Transportation Research Institute (UMTRI) with Virginia Tech Transportation Institute (VTTI) E) Iowa State University CTRE with the University of Iowa
$1,500,000 March 2007
S02 Integration of Analysis Methods and Development of Analysis Plan; University of Iowa with Iowa State University CTRE, University of Minnesota, and Montana State University
$500,000 April 2008
S03 Roadway Measurement System Evaluation; Applied Research Associates (ARA) with Cambridge Systematics and KCI
$500,000 January 2008 S04 A) Roadway Information Database Developer and Mobile Data
Collection (Project S04B) Technical Coordination and Quality Assurance B)Mobile Data Collection
$1,000,000 - $3,500,000
April 2010 S04B RFP Aug. 2010 S05 Design of the In-Vehicle Driving Behavior and Crash Risk
Study; Virginia Tech Transportation Institute (VTTI) with The University of Michigan Transportation Research Institute (UMTRI) and Battelle
$3,000,000 June 2007
S06 Technical Coordination and Independent Quality Assurance for Field Study; Virginia Tech Transportation Institute, VTTI
$6,200,000 June 2009 S07 In-Vehicle Driving Behavior Field Study (six site selected) $16,500,000 May 2010 S08 Analysis of Driving Behavior Field Study Data and
Countermeasure Implications (multiple awards)
$5,000,000 RFP late 2010 S09 Site-Based Video System Design and Development; University
of Michigan Transportation Research Institute (UMTRI) with Virginia Tech Transportation Institute (VTTI), Soar Technology and University of California, Berkeley (PATH)
$1,000,000 March 2007
S10 Design and Conduct the Site-Based Field Study -- -- S11 Analysis of Site-Based Field Study Data and Countermeasure
Implications
-- --
S12A Data Acquisition System (DAS): Equipment and Vendor Services
$10,000,000 Oct. 2009
TOTAL $48,700,000
27
STRATEGIES AND INITIATIVES
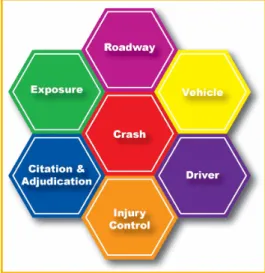
Safety improvement is a multi-disciplinary pursuit involving at least the 4Es and expanding to numerous sources of data. Each data source has its unique quality threats and each state manages data in unique ways. States now manage their critical data sources under at least one, but often several related Strategic Plans. These documents (most notably the Traffic Record Strategic Plan) include reviews of the current status of crash, roadway, driver, vehicle, citation/adjudication, and injury surveillance (medical) data in the state. The plans include strategies for improving the timeliness, accuracy, completeness, consistency, integration, and accessibility of each of these data sources. In addition, state highway safety plans often include sections on data and analysis that map out additional strategies specific to the needs of engineers, planners, and others with direct involvement in highway safety initiatives.
As strategies are developed, there is a need to identify data elements to be collected so that the state can measure progress both at the individual project level and at a more macro level to ensure that programs are meeting their safety goals. States need timely data as implementation takes place and throughout a project’s lifecycle in order to identify variances from plan,
shortfalls in projected safety improvements, and to enable the state to modify programs promptly to achieve the desired results from the various strategies implemented.
With improvements in coordination among engineers and their counterparts in enforcement, courts, driver licensing, vehicle registration, and health care, there has been an expansion of the data sources available. This expansion will continue in the future. As a result, there will be a corresponding increase in the types of analyses that can be supported by the available data. New data systems and analysis tools will be required to support the strategies and initiatives discussed in the highway safety white papers as well as for assessing progress in the implementation of the national strategy for highway safety Toward Zero Deaths. These analyses and the frequent dissemination of their results to decision-makers are fundamental to obtaining continuous support for the necessary advancements and innovations in safety data collection and analysis. They also serve to develop confidence in strategies for new implementations – as decision-makers see that the strategies are working, as demonstrated by solid data and valid analyses, they will become more reliant on those new resources and tools.
DataSystemsStrategiesandInitiatives
Three strategies specific to data systems development and management were identified. The remaining strategies and initiatives that combine both data systems and analysis are included under the Data Analysis Strategies and Initiatives section.
28
Location Strategies
The role of geography and location coding will continue to play a significant role in
identifying where incidents are occurring. Geographic Information Systems (GIS) provide the infrastructure methodology to link various types of data for spatial analysis to support accurate and effective decision-making. Working together, all jurisdictions will benefit by establishing an enterprise approach to GIS, at a minimum throughout a state. Individual agencies with existing GIS programs can participate in this enterprise approach by data sharing through Web-based services. If all network data are identified, located, and updated throughout the state using one base GIS service, there will no longer be confusion about where traffic incidents are occurring and what elements of the environment may have contributed to a crash. This strategy will enhances agencies’ communication, reduce redundant data maintenance and management, and provide the potential for linking in other types of data for safety analysis that have not been yet identified in today’s safety data systems and analysis tools. A pilot test of this enterprise-wide strategy for location data sharing is described in Tennessee’s Information Systems Plan for 2008.7
Linkage Strategies
Through the E-9-1-1 enhanced computer-aided dispatch (CAD) system, a record is formed of exact location of an incident, what resources were deployed to that location (enforcement, emergency medical services, tow operators removing vehicles, routing of injured or killed participants, et al.). Furthermore, basic crash, citation, arrest, and other traffic data are initiated for the incident and all of these data are linked by the CAD and its records
management system (RMS). E-911 has taken the dispatch centers from the 1970s mode of communicating by voice, to permitting the electronic transmission of data to and from the dispatch center.
Next Generation 9-1-1 (NG9-1-1)8 is an initiative proposed by the Intelligent Transportation Systems (ITS) Joint Program Office to leverage the progress made by the Wireless E9-1-1 Initiative of the National Emergency Number Association and the US DOT Office of the Secretary.9 The NG9-1-1 initiative will leverage the progress from the Secretary of
Transportation’s Wireless E9-1-1 Initiative, which has enhanced location capability for 9-1-1 calls placed from wireless phones. NG9-1-1 will go that additional step to use any
communications device. The NHTSA study of Electronic Crash Data Collection Tools also recommends a strategy of obtaining initial data from the dispatch center RMS to initiate crash data collection.10
Customer Service Improvements
In order to maintain access to data for safety analysis that is of sufficient quality and timeliness, rarely is it recognized that a well-trained, effective information systems
29
workforce is required. For example, as many crash data systems were moved to
microcomputer-based systems, the desire to access driver and vehicle records during data entry to cross-reference these data was forgotten. Too often governmental offices of
Information Technology (IT) are used as training grounds for new personnel, who then move on to other offices or private industry. It is critical that those IT persons with subject matter knowledge be retained, or changes and updates to systems will not include all of the business rules required for effective safety analysis. Strategies for retaining critical IT personnel to manage safety-related systems include supporting on-going and relevant technical training, providing access to web-based training courses, including on-line technical courses.
DataAnalysisStrategiesandInitiatives
Examples of information sources and analytic tools lead to a number of general conclusions: Include all injury crashes in national databases
use of technology to automate and minimize redundancy and errors development of a data warehouse and provide online access
development of state, regional and local SPFs for network screening and develop linkages between different local databases; expand the tools for all jurisdictions (not only states) and place them on a SPF clearinghouse
Increase accessibility by posting all online
Create an on-going mechanism to keep the knowledge base updated with new research and evaluation of treatments and online access
Expand analytical tools to other road types and facilities; and road users
These conclusions are in line with the implementation strategies proposed at the completion of the international scan.11 This report summarizes the international scan of Australia, Germany, and the Netherlands. Five strategies and several sub-strategies were developed. It concluded that:
“If decision-makers are provided safety analysis tools that output better safety
decisions or make the decision-making process easier, these tools will be used. If these tools require improved safety data, then these same
30
With that in mind, Strategy 4 – Improve Safety Data by Increasing the Use of Critical Safety Analysis Tools (which themselves require good data) was developed. It has two key sub-strategies:
(a) Market existing safety analysis tools and those under current development (b) Develop the next generation of safety analysis tools
These sub-strategies are critical in support of the Toward Zero Deaths goal. Similar to the effort of marketing and implementing the HSM, it is paramount that professionals and practitioners become familiar with and trained to use the tools, and that their agencies’ systems are able to adapt to the tools’ requirements. The second sub-strategy supports the concept of a data warehouse and integrated knowledge base in the nation; i.e., integrating the knowledge of NHTSA, FHWA, FMCSA, State and local safety analysts and safety researchers to develop the next generation of critical safety-data analysis tools.
Strategy 1: Implement state-of-the-art tools (Timeframe 1-5 years)
Significant resources have been devoted to the development of tools such as HSM,
SafetyAnalyst, IHSDM. PLAN4SAFE, etc. Their implementation in the agencies has been slow. Toward Zero Deaths goal requires day-to-day actions and they need to be universally used at all highway agencies. Institutionalization of explicit safety quantification is a must. The sub-strategies to support this strategy as:
Strategy 1.1 Establish Resources, Training, and Outreach
Among the grants available, SAFETEA-LU State Highway Safety Grant Programs: Section 408 State Traffic Safety Information System Improvement Grants. This program encourages states to adopt and implement effective programs to improve the timeliness, accuracy, completeness, uniformity, integration, and accessibility of state data needed to identify priorities for national, state, and local highway and traffic safety programs; to evaluate the effectiveness of efforts to make such improvements; to link the state’s data systems, including traffic records, with other data systems within the state; and to improve the
compatibility of the state’s data system with national data systems and data systems of other states to enhance the ability to observe and analyze national trends in crash occurrences, rates, outcomes, and circumstances12.
Additional resource and technical support efforts are required to get to the data analysis levels envisioned. A momentum created by a Lead State initiative would be very supportive, and demonstrate the feasibility and benefits of such implementations. Suggestions provided are:
31
Adapt analytical tools for each agency (e.g., calibration of SPFs, data management) Provide venues for multi-disciplinary, and multi-departmental peer exchange Establish lead agencies` programs
Establish a media national outreach channel (reaching the general public) to report on the results of the tools and other strategies
Strategy 1.2 Present tools and their requirements; establish agencies’ needs to implement the tools; provide resources to implement the tools
While Strategy 1.2 is a critical one to create the momentum, it is absolutely critical to implement the state-of the-art analytical tools at every agency in the nation, Agencies are police departments in each jurisdiction, State DOTs, MPO, and local agencies. The procedure at each one of these would be to meet with representatives, and present the tools in a hands-on workshop style. It is therefore important to gather their feedback in terms of how the tools compare with current practices, what benefits could be attained in implementing the new tools. The feedback need to be attained from those who will use the tools. For example, based on the challenges of current implementation of SafetyAnalyst, the key needs are data interface, data completeness and linkages, and a good understanding / acceptability of the new analytical methods found in the SafetyAnalyst.
Strategy 2 – Expand on methods and application tools (Timeframe 1-10 years) Three sub-strategies will support the Toward Zero Deaths goal. They are:
Strategy 2.1 Development and inclusion of expected crash analysis within existing and future capacity and other operational analytical tools
The state-of-the-art methods found in the HSM provide the foundation to develop models to integrate safety explicitly in other non-safety tools, such as operational and capacity tools. In addition, the interrelationship of driver performance and behavior with roadway design and traffic conditions, that are some of the anticipated results of SHRP 2, will provide
information to develop and expand the models suitable for these non-safety tools. Strategy 2.2 Development and inclusion of crash costs (government and other real costs) within existing transportation and other cost analysis tools
Strategies toward the Toward Zero Deaths go