© Universiti Tun Hussein Onn Malaysia Publisher’s Office
JSCDM
Journal homepage: http://penerbit.uthm.edu.my/ojs/index.php/jscdm
Journal of Soft
Computing and
Data Mining
*Corresponding author: [email protected]
2020 UTHM Publisher. All rights reserved. penerbit.uthm.edu.my/ojs/index.php/jscdm
17
Adaptive Semi-Unsupervised Weighted Oversampling with
Sparsity Factor for Imbalanced Biomedical Data
Haseeb Ali
1*,
Nurul Ashikin Samat
1, Hafiz Maaz Ashgher
11Faculty of Computer Science and Information Technology,
Universiti Tun Hussein Onn Malaysia, Batu Pahat, 86400 Johor, MALAYSIA *Corresponding Author
DOI: https://doi.org/10.30880/jscdm.2020.01.01.003
Received 20th December 2020; Accepted 10th February 2020; Available online 1st March 2020
1.
Introduction
In machine learning paradigm, the unevenness in data, with respect to class labels, usually occurs hence most researched problem nowadays [1]. The relative importance is increased when the performance of classifiers is often impaired when dealing with the imbalanced nature of these datasets [2]. Imbalance data problem occurs when the numbers of samples present in the classes vary significantly. One class that can be named as majority class, having significantly large number of samples than the other class which presents quietly fewer samples can be named as minority class. In some cases, minority class is an essential class which should not be neglected by the classifiers. As the majority class contains a large number of samples and minority class contains negligible number of samples as compared to the majority class, the classifier becomes biased towards the majority class. Ignorance of the minority class results into the higher cost and health risks in the medical and other real-world applications [3][4].
Many real-world applications encounter imbalanced data problem, such as unreliable telecommunication customers or telecommunication management [5], ozone level forecasting [6], face recognition [7], text classification [8], and most importantly bioinformatics [9][10][11][12]. The trivial classifiers present good accuracy but often fail to predict minority class accurately that means the determined accuracy attained by the classifier is biased towards the majority class; while, the minority class samples in reality may be important to analyze. Misclassification of the minority class can result into a higher loss of any practical field, fraudulent cases, bank transactions, industrial data
Abstract: Today, the surge in data has also increased the complexity of class imbalance problem. Real-world
scenarios in industry, medical, and banks usually generate imbalanced data which poorly affect prediction of the minority class by machine learning algorithms – resulting in high cost and also life risk factors. Most importantly, in bio-medical field, medical diagnosis of the cancerous patients suffers from uneven samples with respect to classes. In this study an oversampling method is proposed to eliminate between the class and within-class imbalances problem. The method eliminates noise from the datasets and takes significant concepts of the minority class for oversampling. We used sparsity factor in this method, which significantly improved the learnability of the classification model. This is achieved by generating appropriate and more number of synthetic samples in minority class. For the performance evaluation of this method, series of experiments are performed on the four imbalanced microarray datasets. Their classification results declared the proposed method better than the baseline existing techniques
.
18
analysis or medical diagnosis [13][14][15]. Importance of minority class can be understood from this example; medical diagnosis of any certain cancer patient, misclassification of any non-cancer patient as unhealthy can be covered by doing more test and diagnosis, but misclassifying any cancer patient as healthy can compromise life. Addressing this issue, the research community has made plenty of contributions and developed significant approaches [16]. These approaches can be divided into three categories [17]: (a) data level approach which is a preprocessing stage for rebalancing the distribution of samples in the classes [18], (b) algorithmic approach in which new algorithms are proposed or the existing algorithms are modified according to the requirements for the nature of imbalanced datasets to be classified [19][20], and (c) third approach is cost sensitivity which lies between the data level and algorithmic approaches, its purpose is to minimize the total error cost by minimizing the misclassification error rate [21][16][22]. This study prefers the data level approach as the preprocessing methods are independent of the classifiers and nature of the data set, hence manipulate the data externally [23].
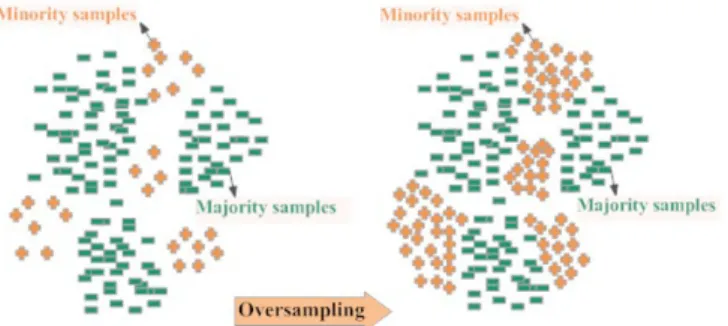
The most commonly used preprocessing approaches for balancing the data distributions among the classes are resampling techniques by either using oversampling method, undersampling or hybrid methods [24]. In oversampling, artificial data is generated for the minority class so as to enhance the number of samples. For addressing undersampling, the samples from majority classes are randomly eliminated so as to balance the number of samples in all classes [25]. However, this approach risks losing potential data which may be useful for learning process [26]. On the other hand, the oversampling may cause overfitting the data, or incorrect selection of samples may occur in the invalid region resulting in overlapping of synthetic samples with majority class samples, hence deteriorating the classifier performance [27]. Despite the drawbacks, oversampling methods are mostly preferred upon the undersampling methods as they do not pose any risk of losing useful data [28]. Moreover, the limitations of the oversampling methods are dealt by using the informed methods. The informed methods consider the optimal area of the input space for generating the synthetic samples, like safe areas [29] to avoid overlapping of minority samples with the majority samples, sparse areas [30], which avoids generating noise among the data or generated new samples near the decision boundary [31]. The latest efficient approach for the imbalance data problem used clustering based oversampling, in which the whole input space is partitioned into clusters or the classes are partitioned as different clusters and sub-clusters. Then, oversampling techniques are applied for generating the synthetic samples [32].
This study proposes an oversampling technique by improving adaptive semi-unsupervised weighted oversampling (IA-SUWO-S) by using the sparsity factor for the class imbalance problem in DNA microarray data, in which the classifiers mostly misclassify the minority class. This oversampling technique first clusters the minority and majority classes then oversamples the minority class by generating synthetic samples. IA-SUWOS determines the hard-to-learn samples that are closer to the decision boundary and assigns them higher weights according to their Euclidean distance from the majority class. It takes into the account the small concepts of the minority class that are far from the majority class. The proposed technique clusters the minority samples by considering the majority class samples, avoids majority class clusters to come in between the minority sub-clusters for averting the overlapping of the generated samples. Secondly, it measures the density the of each minority sub-cluster and then assigns weights to those samples in the minority sub-clusters that are sparse apart and far from the majority samples, thus all the sub-clusters are oversampled accurately based on required extent. This technique increases the number of generated synthetic minority samples in each sub-cluster that presents reduced imbalances between the classes and with-in the classes. Additionally, this directly enhances the learnability of the classifier and produces good accuracy rate and lesser chance of misclassification of any minority class sample
.
This section presented the main introduction of whole study and rest of the paper is organized as: Section 2 presented overview of the background study. In section 3, the proposed method is described in detail while section 4, present its whole experimental setup. At last section 5 conclude the whole study.
2.
Background Study
As discussed earlier, the data level approach or preprocessing of the data can be categorized into two major resampling techniques, oversampling and undersampling. According to the interest of this research, oversampling techniques are focused and presented in brief, in this section. Random oversampling is the pioneer and the simplest technique for oversampling which generates new samples randomly by replicating the original minority samples [33]. However, this technique originates the overfitting problem by exact replication of the samples [25]. To address this, Nitesh Chawla proposed Synthetic Minority Oversampling Technique (SMOTE) in 2002, [25]. This technique generates the synthetic samples in the feature space by broadening the minority class regions. SMOTE generates synthetic minority samples by linear interpolation between the two minority samples present in a neighborhood. While, the SMOTE oversamples the minority samples with the same number of synthetic ones, those generated sample may fall into incorrect regions and overlapped with the majority class samples, hence causing over generalization [34]The SMOTE is the simplest technique hence widely used by the research community for the data imbalances problem [27]. Additionally, unlike the SMOTE which equally produces minority samples, various weighted minority oversampling techniques have been proposed, which assign different weights to minority samples for oversampling; meaning, the
19
higher weights assigned higher will be the rate of generating synthetic minority samples [35] [36]. The reason behind it, is to secure the minority class samples that are more prone to be misclassified, as well as, to improve the quantity of the synthetic samples [37].
As the SMOTE and other existing techniques usually suffer from the over-generalization problem due their limitations, some of the oversampling approaches use the clustering methods. Clustering based techniques at first separate the particular minority class into the naturally occurred sub-clusters, then generates the synthetic samples into those minority sub-clusters to avoid the risk of over generalization [38]. Noise is another negative factor found in the imbalanced data problem [31], latest techniques also employ an additional noise filtering step to remove the noise from the dataset or those generate synthetic samples that fall down in to the incorrect region and act as the noisy samples are removed from the dataset by using the filters [39][40].
Recent oversampling techniques, that follow the clustering methods and noisy filters, significantly reduce the imbalanced data problem and achieve efficient results. Majority weighted minority oversampling technique (MWMOTE) [37] uses clustering approach and partitions the majority and minority samples to generate synthetic samples according to the Euclidean distance of minority samples from the majority samples. It considers only those minority sub-clusters that are closer to the majority class. However, it neglects the small concepts or sub-clusters that are from the majority class, even they carry the potential information about the minority class. Evolutionary cluster-based synthetic oversampling ensemble (ECO-Ensemble) for imbalance learning [38] is also clustering-cluster-based ensemble framework that creates an ensemble by combining a clustering-based resampling method with the evolutionary algorithm. This method identifies the regions for oversampling by using the clusters to ensure deviation from over generalization between the samples. Another clustering based approach, bi-directional sampling based on k-means method is proposed in [41], which uses the hybrid solution of both resampling techniques, oversampling and undersampling, with k-means for the imbalances text classification problem. This method eliminates the between-class imbalance problem and within-class imbalance problem, along with avoiding the generation of noise in the data. An another combination of oversampling method SMOTE with k-means clustering is presented in [28], it is simple and effectively avoids noise generation within the data and overcomes the imbalanced data, between the classes and within-class problem. It clusters the data by using k-means algorithm and considers those areas of input space that are most critical for oversampling. It also determines the density of the samples and assigns more weights to the sparse minority samples in a particular sub-cluster. The value of k is important for the effectiveness of the algorithms, as it produces the number minority clusters accordingly. For the noisy imbalanced data classification problem, a radial-based oversampling (RBO) is also proposed in literature, which uses the radial based functions for data generation in the rightful regions of the minority class according to their imbalanced ratio. This method effectively removes noise from the data. The synthetic data is generated in the safe areas as the RBO calculates the joint potential in each area of the feature space, this also helps in avoiding the over generalization. This method also takes into the account the higher or lower dimensional spaces [40].
Fig. 1 - Oversampling of minority samples
Recently, the imbalanced data learning becomes thought provoking domain in bio-medical science as well. As the distributions of samples in minority class are mostly under-represented in the standard algorithms, or the decision rules of trivial classifiers are significantly weak for accurate prediction of minority class than the majority class samples. The importance of minority class cannot be neglected in bio-medical sciences at any cost. The example of cancerous patients problem, mentioned earlier, clearly suggests that misclassification of minority class might be result into a life risk. When the number of “Healthy” data samples are 10,923 and “Cancerous” data samples present only 260 in number, this is the highly imbalance mammography dataset [42], what will happen to the classifier? It will bias towards the majority class. And if it classifies a cancerous patient as a healthy one, obviously it will impact a great loss. KernalADASYN [36], an oversampling method proposed for the medical perspective, and experimented on the real-world medical datasets. This method uses the probability density estimation (PDE) for minority class and data generation scheme. It considers hard-to-learn minority samples more and assigns them higher weights that enhances the classifiers performance.
20
Most common and the first step in gene structure prediction is translational initiation site (TIS) recognition. However, TIS recognition from machine learning perspective is class imbalance problem. While various methods are applied to overcome the class imbalance problem, the resampling method proposed in [43] works effectively on these datasets. An undersampling method based on ant optimization ACOSampling is proposed for imbalanced DNA microarray data. This method removes the noisy genes initially from the data by using feature selection technique then it filters the majority class samples which have no potential information and makes the best training sample subset. At-last this method creates a balanced training set by combining the minority samples with the majority samples having higher frequencies. The beneficial knowledge obtained in the data mining process can be used in healthcare management for improving the quality of their services and reducing the number of medical errors. Combination of effective algorithms output the best results in terms of efficiency for the imbalanced data classification, while the ensemble of algorithms used with subsampling method works more effectively. Therefore, the proposed [44], subsampling method with ensemble of clustering algorithms work in fast and efficient way for imbalanced datasets, which takes into consideration the minority class and helps the classifiers to predict minority class accurately.
3.
Improved Adaptive Semi-Unsupervised Weighted Oversampling with Sparsity Factor
(IA-SUWO-S)
3.1
Semi-unsupervised clustering
Before the clustering process, IA-SUWOS distinguishes the noisy samples present in both classes and removes those noisy samples from the dataset. This is done by determining the selected samples and its four nearest neighbors. If this sample is not similar to its nearest neighbors, it suggests that this sample belongs to other class. While, considering it as a noise, it is removed from the data. After removing noise data, the second step is to cluster the input space separately into majority and minority clusters and further small concepts as sub-clusters. The proposed approach first clusters the majority class into m majority sub-clusters . Then it clusters the minority class according to the semi-unsupervised clustering approach to determine the presence of any majority sub-cluster between the two selected minority sub-clusters, say and , with aim to be merged. If any majority sub-cluster is not present between them, these two candidate minority cluster are allowed to be merged and result into a new sub-cluster . The reason behind this approach is to avoid overlapping of the generated synthetic samples with the majority class samples. If any majority cluster found to be present between them, these sub-cluster are not allowed to be merged and their distance is set to be infinity so they cannot be selected as the candidate to merge again. These steps are repeated until all minority samples allocated into finalized minority sub-clusters and the distance between the two closest sub-clusters is less than threshold T. This T can be found as the Euclidean distance from all minority (majority) samples h and all other minority (majority) samples, it can be expressed as Eq. (1):
(1)
where , is a user defined parameter and its best value depends upon the dataset.
3.2
Adaptive sub-cluster sizing
It is necessary to oversample all the minority sub-cluster even if they are far from the majority class, as they carry important information about minority class. In order to consider all the minority sub-clusters for oversampling, small concepts or the sub-cluster that are far from the majority class, this method measures the misclassification complexity of all the minority sub-clusters with the majority sub-clusters. This will result into the misclassification error of each minority sub-cluster and those sub-cluster that shows complexity for the classifier or gain more misclassification error rate are assigned a larger cluster size. For measuring the complexity of minority sub-cluster based on their misclassification error rate, linear discriminant analysis (LDA) is used as the classifier which runs k times. This classifier is the simple and requires no parameters to tune. For testing and training sets, all minority sub-clusters are split into same k sized partitions. All the majority samples from each majority sub-cluster and k-1 partition from each minority sub-clusters used for the training purpose, while rest of the 1 partition from each minority sub-cluster used for the testing purpose. In this way misclassification error is calculated in each fold using Eq. (2), mentioned later. This error rate is then used to measure average rate as from all folds. This method determines every minority sample which is misclassified as the majority sample. Considering this average error rate each minority sub-cluster is resized and these steps keep on repeating until all the sub-cluster get the final size . This average error rate is then standardized as Eq. (2):
21
(2)
Final sizes of any two minority sub-clusters say L1 and L2 should have same average error rates *L1, *L2, see Eq. (3):
(3)
3.3
Assigning weights for synthetic samples generation within each minority sub-cluster
Probability distribution of the sample for the data generation is calculated on behalf of weights assigned to the minority samples. These weights are assigned first according to Euclidean distance of minority samples from the majority samples, and secondly according to the sparsity factor measure in each minority sub-cluster. For assigning the weights according to Euclidean distance of the majority samples, for each minority sample say , find the majority sample among its nearest neighbors and measure the Euclidean distance from majority sample . This distance becomes normalized when it is divided by the total number of feature D to make it more robust, it is expressed as Eq. (4):
(4)
Closeness factor of samples can be defined as Γ which is expressed as Eq. (5):
(5)
where present the cutoff function which is used for sub-cluster to prevent it from becoming too large. It happens when and are too close to each other. This is defined as Eq. (6):
(6)
where is the biggest value which can reach. The threshold is automatically calculated for each minority sample, by finding the Euclidean distance between the closest minority sample and its closest majority sample . It is defined as Eq. (7):
(7)
where , is the number of samples in sub-cluster . Those particular minority samples that are closer to the majority samples acquire the higher weights by estimating the threshold . The reason behind assigning higher weights to these sample according to their Euclidean distance from the majority sample is that those samples which are closer to the decision boundary and majority samples have more chances to be misclassified, hence they are more important for the classification process. The value for is calculated as Eq. (8):
(8)
Secondly, for assigning weights according to the sparsity factor, this method measures the density of each minority sub-cluster, see Eq. (9). Density of the sub-cluster is obtained by measuring the Euclidean distance among all the minority samples present in the particular that particular sub-cluster. This density measure is inverted in order to get the sparsity factor, as the sparsity measure is indirectly proportional to the density using Eq. (10). Average sparsity factor
22
is measured from all the obtained sparsity measures for all minority sub-clusters as Eq. (11). Then this average sparsity factor is converted into the weights that are to be assigned to minority samples as Eq. (12).
(9)
(10)
(11)
(12) These both weights are used to derive the probability distributions of minority samples for the oversampling.
(13)
3.4
Oversampling of Minority Instances
Finally, for the oversampling of the weighted minority samples, select the candidate minority samples a, from one sub-cluster according to the probability distribution , then select another sample b from its nearest neighbors belong to the same sub-cluster and generate a new sample between them c (Eq. 14), which is added in the sub-cluster
O. These steps are repeated until the sub-cluster size reached its extent .
(14)
4.
Experimental Setup
For performing experiments related to this study, all the classification algorithms were implemented using MATLAB 2013b, on a computing machine with CPU power 3.80 GHz and 3.79GHz, 8.00 GB RAM, and Windows 10 as 64-bit operating system. The datasets and performance matrix are discussed in the following subsections.
4.1
Datasets
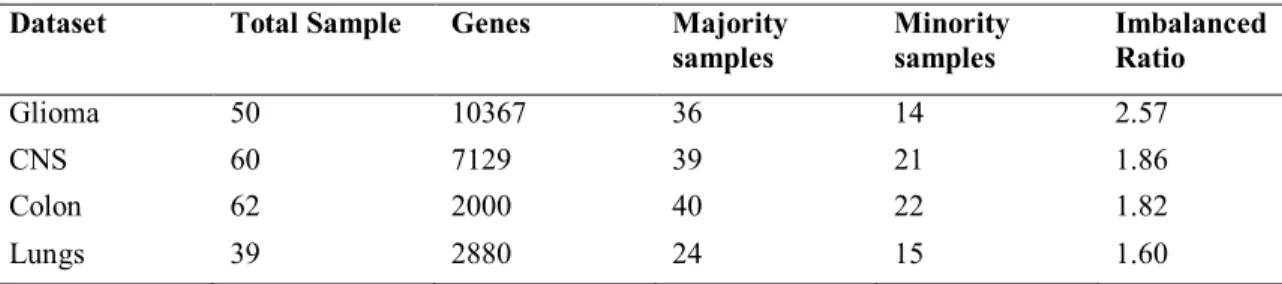
For the performance evaluation of IA-SUWO, a complete experimental setup has been established, and it is experimented on four microarray benchmark imbalanced datasets. These datasets include, Glioma dataset, CNS (Central Neural System), Colon dataset and Lung cancer dataset. These are the bio-medical datasets and three data sets named, Colon, CNS and Lungs are binary class datasets and the Glioma dataset include subtypes: non-cancer glioblastomas (NG), cancer glioblastomas (CG), non-cancer oligodendrogliomas (NO), cancer oligo-dendrogliomas (CO). The CG is used as the minority class which contain 14 samples and rest of three are combined as majority class that contain 36 samples in it. The Colon, CNS and Lung cancer datasets sizes are 62, 60 and 39 respectively. The number of genes present in these four dataset range from 2000 to 10367. Their imbalance ratio and summarized datasets detail are given in Table 1.
Table 1 - Datasets used for the experiments
Dataset Total Sample Genes Majority
samples Minority samples Imbalanced Ratio
Glioma 50 10367 36 14 2.57
CNS 60 7129 39 21 1.86
Colon 62 2000 40 22 1.82
Lungs 39 2880 24 15 1.60
23
In imbalance datasets classification results recognition are biased towards majority class. All commonly used metrics are not suitable when the distribution of samples in classes is not equal. In order to deal with imbalanced data evaluation some specific metrics are used, such as: F-measure and G-mean declare as the functions of confusion matrix and AUC (area under the receiver operation characteristic curve) is used to evaluate performance of classifier or learner.
(15)
(16)
(17)
(18) where TPR is defined as same as “Recall” and TNR is defined as:
(19)
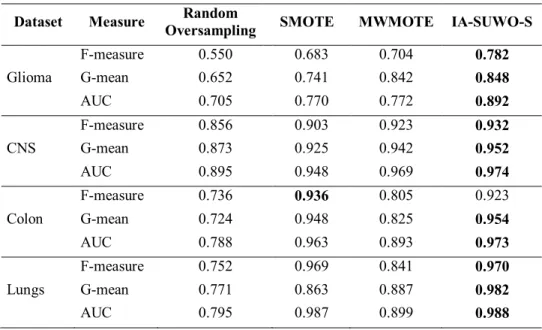
Table 2 - Experimental Results Four datasets using SVM
Dataset Measure Oversampling SMOTE Random MWMOTE IA-SUWO-S
Glioma F-measure G-mean AUC 0.550 0.652 0.705 0.683 0.741 0.770 0.704 0.842 0.772 0.782 0.848 0.892 CNS F-measure G-mean AUC 0.856 0.873 0.895 0.903 0.925 0.948 0.923 0.942 0.969 0.932 0.952 0.974 Colon F-measure G-mean AUC 0.736 0.724 0.788 0.936 0.948 0.963 0.805 0.825 0.893 0.923 0.954 0.973 Lungs F-measure G-mean AUC 0.752 0.771 0.795 0.969 0.863 0.987 0.841 0.887 0.899 0.970 0.982 0.988
4.3
Experimental Results
The proposed
IA-SUWOS technique was evaluated on four bio-medical datasets, and compared with other classification methods. The competitive methods include SMOTE, SVM, and KNN. Table 2 presents the results for comparison purpose. During training process, all the datasets were divided into training and testing sets with 70:30 percent ratio. 70% samples were randomly used for the training purpose, while the rest 30% for testing the classifier. According to the statistics presented in Table 2 and Table 3, it can be suggested the proposed approach remained most suitable, as compared to Random Oversampling, SVM, and KNN as classifiers applied on the same datasets. The proposed IA-SUWO-S achieved best evaluation matrix, hence generated most accurate classification results in our experiments, even when the data is highly imbalanced.Table 3 - Experimental Results Four datasets using KNN
24
Glioma F-measure G-mean AUC 0.650 0.622 0.605 0.783 0.841 0.820 0.814 0.849 0.802 0.882 0.840 0.822 CNS F-measure G-mean AUC 0.756 0.823 0.780 0.947 0.929 0.959 0.929 0.947 0.971 0.932 0.952 0.974 Colon F-measure G-mean AUC 0.706 0.756 0.778 0.925 0.922 0.926 0.905 0.895 0.890 0.923 0.954 0.973 Lungs F-measure G-mean AUC 0.652 0.678 0.720 0.961 0.835 0.887 0.901 0.887 0.909 0.970 0.982 0.9085.
Conclusion
Preprocessing of data by using the sampling methods are proven to be more effective to cope with imbalanced data problem. In sampling methods oversampling approach is more adopted by the researcher as the undersampling methods have risk of losing any potential information that can used in machine learning. As the imbalanced data impact negatively in machine learning algorithms in which the mostly the classifiers biased towards the majority class and predict minority class poorly or they failed to predict minority class accurately. Misclassification of minority class result into higher cost and most importantly in medical diagnosis this might be result into a life risk. The proposed oversampling technique in this study used to overcome the class imbalance problem in the DNA microarray data. Extensive experiments are performed and their results demonstrate that the proposed method work efficiently to overcome imbalanced data problem in microarray data.
Acknowledgement
The authors would like to thank Universiti Tun Hussein Onn Malaysia (UTHM) for supporting this research under Postgraduate Incentive Research Grant, Vote No. H334.
References
[1] A. Fernández, S. del Río, N. V. Chawla, and F. Herrera, “An insight into imbalanced Big Data classification: outcomes and challenges,” Complex Intell. Syst., vol. 3, no. 2, pp. 105–120, 2017.
[2] B. Krawczyk, “Learning from imbalanced data : open challenges and future directions,” Prog. Artif. Intell., vol. 5, no. 4, pp. 221–232, 2016.
[3] Q. Zou, S. Xie, Z. Lin, M. Wu, and Y. Ju, “Finding the Best Classification Threshold in Imbalanced Classification,” Big Data Res., vol. 5, pp. 2–8, 2016.
[4] B. Krawczyk, M. Woźniak, and G. Schaefer, “Cost-sensitive decision tree ensembles for effective imbalanced
classification,” Appl. Soft Comput. J., vol. 14, no. PART C, pp. 554–562, 2014.
[5] K. Ezawa, M. Singh, and S. Norton, “Learning Goal-Oriented Bayesian Networks for Telecommunications Risk Management,” 13th Int. Conf. Mach. Learn., pp. 139–147, 1996.
[6] C. hui Tsai, L. chiu Chang, and H. cherng Chiang, “Forecasting of ozone episode days by cost-sensitive neural network methods,” Sci. Total Environ., vol. 407, no. 6, pp. 2124–2135, 2009.
[7] N. Kwak, “Feature extraction for classification problems and its application to face recognition,” Pattern Recognit., vol. 41, no. 5, pp. 1701–1717, 2008.
[8] D. D. Lewis and J. Catlett, Heterogeneous Uncertainty Sampling for Supervised Learning. Morgan Kaufmann Publishers, Inc., 1994.
[9] L. Song, D. Li, X. Zeng, Y. Wu, L. Guo, and Q. Zou, “nDNA-prot: Identification of DNA-binding proteins based on unbalanced classification,” BMC Bioinformatics, vol. 15, no. 1, pp. 1–10, 2014.
[10] C. Lin et al., “Hierarchical Classification of Protein Folds Using a Novel Ensemble Classifier,” PLoS One, vol. 8, no. 2, pp. 1–11, 2013.
[11] H. Yu, J. Ni, and J. Zhao, “ACOSampling: An ant colony optimization-based undersampling method for classifying imbalanced DNA microarray data,” Neurocomputing, vol. 101, pp. 309–318, 2013.
[12] Q. Zou, J. Li, L. Song, X. Zeng, and G. Wang, “Similarity computation strategies in the microRNA-disease network: A survey,” Brief. Funct. Genomics, vol. 15, no. 1, pp. 55–64, 2016.
25
[13] W. Y. Lin, Y. H. Hu, and C. F. Tsai, “Machine learning in financial crisis prediction: A survey,” IEEE Trans. Syst. Man Cybern. Part C Appl. Rev., vol. 42, no. 4, pp. 421–436, 2012.
[14] A. Agrawal, H. L. Viktor, and E. Paquet, “SCUT: Multi-Class Imbalanced Data Classification using SMOTE and Cluster-based Undersampling,” 2015 7th Int. Jt. Conf. Knowl. Discov. Knowl. Eng. Knowl. Manag., vol. 01, pp. 226–234, 2015.
[15] A. Majid, S. Ali, M. Iqbal, and N. Kausar, “Prediction of human breast and colon cancers from imbalanced data using nearest neighbor and support vector machines,” Comput. Methods Programs Biomed., vol. 113, no. 3, pp. 792–808, 2014.
[16] C. Seiffert, T. M. Khoshgoftaar, J. Van Hulse, and A. Napolitano, “A comparative study of data sampling and cost sensitive learning,” Proc. - IEEE Int. Conf. Data Min. Work. ICDM Work. 2008, pp. 46–52, 2008.
[17] G. E. A. P. A. Batista, R. C. Prati, and M. C. Monard, “A Study of the Behavior of Several Methods for Balancing Machine Learning Training Data,” ACM SIGKDD Explor. Newsl. - Spec. issue Learn. from imbalanced datasets, vol. 6, no. 1, pp. 20–29, 2004.
[18] N. V Chawla, N. Japkowicz, and P. Drive, “Editorial : Special Issue on Learning from Imbalanced Data Sets,”
Sigkdd Explor., vol. 6, no. 1, pp. 2000–2004, 2004.
[19] J. R. Quinlan, “Improved estimated for the acccuracy of small disjuncts,” Mach. Learn, vol. 6, no. 1991, pp. 93–98, 1991.
[20] B. Zadrozny and C. Elkan, “Learning and making decisions when costs and probabilities are both unknown,”
Proc. seventh ACM SIGKDD Int. Conf. Knowl. Discov. data Min. - KDD ’01, pp. 204–213, 2001.
[21] Y. Sun, M. S. Kamel, A. K. C. Wong, and Y. Wang, “Cost-sensitive boosting for classification of imbalanced data,” Pattern Recognit., vol. 40, no. 12, pp. 3358–3378, 2007.
[22] S. H. Khan, M. Hayat, M. Bennamoun, F. A. Sohel, and R. Togneri, “Cost-sensitive learning of deep feature representations from imbalanced data,” IEEE Trans. Neural Networks Learn. Syst., vol. 29, no. 8, 2018. [23] W. C. Lin, C. F. Tsai, Y. H. Hu, and J. S. Jhang, “Clustering-based undersampling in class-imbalanced data,”
Inf. Sci. (Ny)., vol. 409–410, pp. 17–26, 2017.
[24] M. Galar, A. Fern, E. Barrenechea, and H. Bustince, “A Review on Ensembles for the Class Imbalance Problem: Bagging-, Boosting-, and Hybrid-Based Approaches,” IEEE Trans. Syst. MAN, Cybern. C Appl. Rev., vol. 42, no. 4, pp. 463–484, 2012.
[25] N. V. Chawla, K. W. Bowyer, L. O. Hall, and W. P. Kegelmeyer, “SMOTE: Synthetic minority over-sampling technique,” J. Artif. Intell. Res., vol. 16, pp. 321–357, 2002.
[26] N. V. Chawla, A. Lazarevic, L. O. Hall, and K. W. Bowyer, “SMOTEBoost: Improving Prediction of the Minority Class in Boosting,” Proceeding. Knowl. base Discov. Databases., pp. 107–119, 2003.
[27] A. Fernández, S. García, F. Herrera, and N. V. Chawla, “SMOTE for Learning from Imbalanced Data: Progress and Challenges, Marking the 15-year Anniversary,” J. Artif. Intell. Res., vol. 61, pp. 863–905, 2018.
[28] G. Douzas, F. Bacao, and F. Last, “Improving imbalanced learning through a heuristic oversampling method based on k-means and SMOTE,” Inf. Sci. (Ny)., vol. 465, pp. 1–20, 2018.
[29] C. Bunkhumpornpat, K. Sinapiromsaran, and C. Lursinsap, “Safe-Level-SMOTE : Safe-Level-Synthetic Minority Over-Sampling TEchnique for Handling the Class Imbalanced Problem,” Adv. Knowl. Discov. Data Mining, PAKDD 2009, pp. 475–482, 2009.
[30] C. Bunkhumpornpat, K. Sinapiromsaran, and C. Lursinsap, “DBSMOTE: Density-based synthetic minority over-sampling technique,” Appl. Intell., vol. 36, no. 3, pp. 664–684, 2012.
[31] H. Han, W. Wang, and B. Mao, “Borderline-SMOTE : A New Over-Sampling Method in,” Springer-Verlag Berlin Heidelb., pp. 878–879, 2005.
[32] G. Douzas and F. Bacao, “Self-Organizing Map Oversampling (SOMO) for imbalanced data set learning,”
Expert Syst. Appl., vol. 82, pp. 40–52, 2017.
[33] S. Ite and S. Ite, “Class imbalances versus small disjuncts,” Sigkdd Explor., vol. 6, no. 1, pp. 40–49, 2004. [34] H. He and E. A. Garcia, “Learning from imbalanced data,” IEEE Trans. Knowl. Data Eng., vol. 21, no. 9, pp.
1263–1284, 2009.
[35] H. He, Y. Bai, E. A. Garcia, and S. Li, “ADASYN: Adaptive synthetic sampling approach for imbalanced learning,” Proc. Int. Jt. Conf. Neural Networks, pp. 1322–1328, 2008.
[36] B. Tang and H. He, “KernelADASYN: Kernel based adaptive synthetic data generation for imbalanced learning,” 2015 IEEE Congr. Evol. Comput. CEC 2015 - Proc., pp. 664–671, 2015.
[37] S. Barua, M. Islam, X. Yao, and K. Murase, “MWMOTE — Majority Weighted Minority Oversampling Technique for Imbalanced Data Set Learning,” IEEE Trans. Knowl. Data Eng., vol. 26, no. 2, pp. 405–425, 2014.
[38] P. Lim, C. K. Goh, and K. C. Tan, “Evolutionary Cluster-Based Synthetic Oversampling Ensemble (ECO-Ensemble) for Imbalance Learning,” IEEE Trans. Cybern., vol. 47, no. 9, pp. 2850–2861, 2017.
[39] Q. Kang, X. S. Chen, S. S. Li, and M. C. Zhou, “A Noise-Filtered Under-Sampling Scheme for Imbalanced Classification,” IEEE Trans. Cybern., vol. 47, no. 12, pp. 4263–4274, 2017.
26
classification,” Neurocomputing, no. 2019, 2019.
[41] J. Song, X. Huang, S. Qin, and Q. Song, “A bi-directional sampling based on K-means method for imbalance text classification,” 2016 IEEE/ACIS 15th Int. Conf. Comput. Inf. Sci. ICIS 2016 - Proc., 2016.
[42] M. Elter, R. Schulz-Wendtland, and T. Wittenberg, “The prediction of breast cancer biopsy outcomes using two CAD approaches that both emphasize an intelligible decision process,” Med. Phys., vol. 34, no. 11, pp. 4164– 4172, 2007.
[43] N. García-Pedrajas, J. Pérez-Rodríguez, M. García-Pedrajas, D. Ortiz-Boyer, and C. Fyfe, “Class imbalance methods for translation initiation site recognition in DNA sequences,” Knowledge-Based Syst., vol. 25, no. 1, pp. 22–34, 2012.
[44] S. Nejatian, H. Parvin, and E. Faraji, “Using sub-sampling and ensemble clustering techniques to improve performance of imbalanced classification,” Neurocomputing, vol. 276, pp. 55–66, 2018.