understood to recognize that its copyright rests with its author and that no quotation from the thesis and no information derived from it may be published without the author’s prior consent.
countries
By
Mansour Saleh ALBARRAK.
A thesis submitted to the University of Plymouth in partial fulfilment of the requirements for the degree of:
DOCTOR OF PHILOSOPHY
IN FINANCE
School of Management
University of Plymouth
By
Mansour Saleh ALBARRAK Abstract
This thesis examines the determinants of capital structure in the MENA coun-tries. The main interest is to investigate both financial firms specially banks and non-financial firms. This study test the main theories of capital structure, namely: trade off theory and pecking order theory. The countries included in this thesis are Saudi Arabia, United Arab Emirates (Include both Abo-Dhabi and Dubai stock in-dexes), Bahrain, Qatar, Kuwait, Oman, Egypt, Morocco, Tunisia, Palestine and Jor-dan. The characteristics it covers as suggested by previous literature are tangibility, profitability, risk, debt tax shield, growth, dividends,size, cash flow and liquidity. It will also investigate the effect of the industry, credit rating and ownership structure on the capital structure
This study also investigates the determinants of capital structure in Islamic and conventional banks. This is one of the first attempts to empirically examine the de-terminants of capital structure in Islamic and conventional banks in general and in MENA countries in particular. This study fills the gap in this important area of re-search and can provide a base for future rere-search on capital structure in Islamic banks. This thesis use different models to test the capital structure and these are Panel data models (OLS, Fixed, and Random); Tobit and Dynamical model (Arellano-Bover Blundell-Bond), Structural Equation Modeling (SEM) and General-ized Regression Neural Networks (GRNN).
The results suggest that the three methods used in this study lead to similar re-sults with a few exceptions in some countries. This thesis finds that the relation between leverage and the determinants of capital structure is different when using the market or the book leverage. It also finds that the determinants of capital struc-ture between the MENA countries are different. For example, profitability attribute relation with leverage follow the trade-off theory in some countries and follow the picking order theory in other countries. Also, liquidity is significant in all the coun-tries in the sample and have a negative relation to leverage. In addition, tangibility is found to have a mixed results with some countries following the trade-off theory and other countries which follow the trade-off theory but overall it is a key determinant of capital structure.
Additionally, the findings show that although that the majority of firms in the MENA countries don’t pay dividends the relation between the long term debt and leverage is negative in all the countries in the sample. The growth opportunities have a negative relation in Bahrain, Egypt, Jordan, Kuwait, Morocco, Palestine, Qatar and Tunisia but positive in rest of the countries. The cash flow attribute have a
neg-tution. The results show that overall when there is an ultimate owner the leverage will have a negative relation. Suggesting that ultimate owners will force managers to keep a low debt in firms capital structure.
This PhD also attempt to investigate the capital structure in banks within the MENA countries. A special focus is on the differences between the Islamic banks and conventional banks capital structure. First, the findings show that the banks follow the same determinants of capital structure as non-financial firms and that regulations are not the main determinant of capital structure in banks. Then, This study show that there is a difference in capital structure of Islamic banks in com-parison with conventional banks. The findings for the dividends variable show that Islamic banks do not follow the pecking order theory but conventional banks don’t.
The results of the size variable show that when Islamic banks are large they use less debt in their capital structure. Growth variable show mixed results depending on the use of book or market leverage. Ownership structure show that when there is an ultimate owner leverage increase which is the reverse of the relation in the non-financial firms. The age variable is negative in relation to the book leverage and positive with the market leverage. Also, credit rating relation is different between the two banks, as it is positive with the conventional banks and negative with Islamic banks. Therefore, this study conclude that the main capital structure theories are applicable to MENA countries. Also indicate that Islamic banks have a different capital structure to conventional banks.
Dedication xiv
Acknowledgments xv
Author’s declaration xvi
List of Abbreviations 1
Glossary of Arabic Words 2
1 Introduction 5
1.1 Introduction . . . 5
1.2 The objectives of the study . . . 5
1.3 The contribution and significance of the study . . . 6
1.4 Thesis organization . . . 8
I
Background and Literature Review
10
2 Background 11 2.1 Introduction . . . 11 2.2 Economics Background . . . 11 2.3 Financial Background . . . 27 2.4 Institutional Background . . . 46 3 Literature Review 53 3.1 Introduction . . . 53 3.2 Cost of Capital . . . 53 3.3 Modigliani-Miller Theories . . . 55 3.4 Trade-off Theory . . . 573.5 Pecking Order Theory . . . 59
3.6 Agency Cost Theory . . . 60
3.7 Market timing theory . . . 61
3.8 Countries Classification . . . 61
3.9 Capital Structure around the World . . . 63
3.12 Summary . . . 117
II
Methodology
119
4 Methodology and Data Description 120 4.1 Introduction . . . 1204.2 Data Description . . . 120
4.3 Variables used in the thesis . . . 122
4.4 Panel Data Analysis . . . 124
4.5 Partial Least Square Structural Equation Modeling (SEM) . . . 129
4.6 Generalized Regression Neural Networks (GRNN) . . . 132
4.7 Descriptive Statistics . . . 135
4.8 The Correlation Matrix . . . 137
4.9 Factors Loading . . . 144
III
Results and Discussion
159
5 Capital Structure In Non-Financial firms 160 5.1 Introduction . . . 1605.2 Literature Review and Hypothesis Development . . . 161
5.3 The Model . . . 174
5.4 Main Results . . . 178
5.5 Discussion . . . 315
6 Capital Structure in Financial firms 319 6.1 Introduction . . . 319
6.2 Research Gap for Islamic Studies . . . 320
6.3 Literature Review and Hypothesis Development . . . 321
6.4 Main Results . . . 334 6.5 Discussion . . . 344
IV
Conclusion
346
7 Conclusion 347 7.1 Introduction . . . 347 7.2 Conclusions . . . 347 7.3 Contribution . . . 3497.5 Future research . . . 351
A 352
A.1 Descriptive Statistics . . . 352 A.2 SEM Results . . . 367 A.3 Background Tables . . . 373
2.1 External Balance as a percentage of (GDP) . . . 18
2.2 Annual Inflation for MENA countries . . . 25
2.3 Capital Market Size Measures . . . 29
2.4 Market Liquidity Measures . . . 31
2.5 Access to Finance Measures . . . 32
2.6 Depositors and Borrowers . . . 34
2.7 Access to Credit Measures . . . 36
2.8 Interest Rate spread and Banks non preforming loans . . . 38
2.9 Bank capital to assets and domestic credit to private sector . . . 40
2.10 Business Extent of Disclosure . . . 47
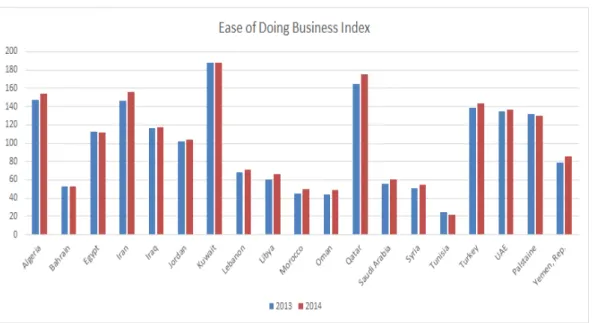
2.11 Ease of Doing Business . . . 49
3.1 Trade-off Theory . . . 59
4.1 Path Diagram of the Model . . . 131
2.1 Gross Domestic Product (GDP) in US$ billions . . . 13
2.2 Annual Growth Rates of Real GDP . . . 14
2.3 Annual Gross Domestic Product (GDP) per capita in US dollars . . . 15
2.4 Annual Gross National Savings (GNS) as a percentage of (GDP) . . 16
2.5 Unemployment as a percentage of total labor force) . . . 19
2.6 Total Population in Thousands . . . 22
2.7 Total Immigration in Thousands . . . 23
2.8 Investors Protection and Economic Freedom . . . 48
2.9 Topics Included in Ease of Doing Business Index . . . 48
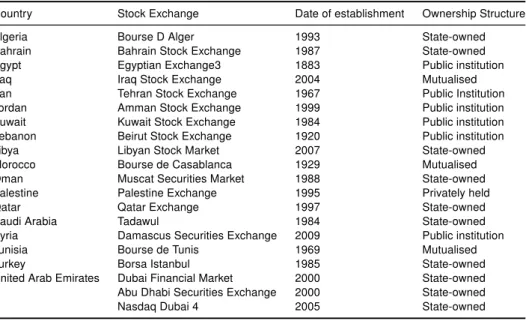
2.10 Stock Market Exchanges in MENA region . . . 50
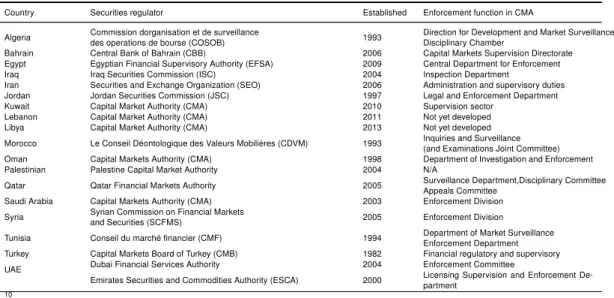
2.11 Regulators of Capital Markets in MENA region . . . 51
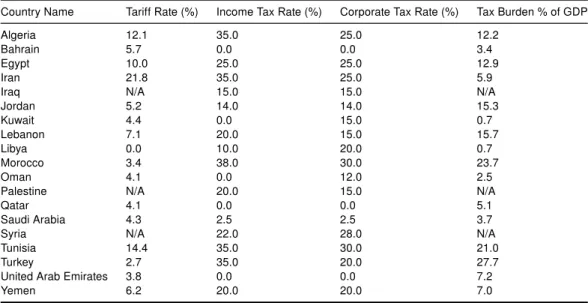
2.12 Tax and Tariff Rates in MENA countries . . . 52
3.1 Countries Classification . . . 62
3.2 Cross-Country Comparison Studies . . . 64
3.3 Studies in Developed Countries . . . 68
3.4 Studies in Developing Countries . . . 77
3.5 Studies MENA Countries . . . 78
3.6 OLS Studies . . . 85
3.7 Tobit Model Studies . . . 85
3.8 Panel Data Models Studies . . . 86
3.9 Dynamical Panel Model Studies . . . 88
3.10 SEM Based Studies . . . 89
3.11 Measures of Market Leverage in Previous Studies . . . 96
3.12 Measures of Book Leverage in Previous Studies A . . . 97
3.13 Measures of Book Leverage in Previous Studies B . . . 98
3.14 Measures of Profitability in Previous Studies . . . 100
3.15 Measures of Firms Size . . . 102
3.16 Measures of Growth Opportunities . . . 104
3.17 Measures of Assets Tangibility . . . 106
3.18 Measures of Liquidity . . . 107
3.19 Measures of Risk . . . 109
3.20 Measures of Tax . . . 111
3.23 Measures of Ownership Structure . . . 116
4.1 Banks Sample by country . . . 122
4.2 Variables Used in the Thesis . . . 123
4.3 Summary of SEM-PLS Model Fit Measures . . . 132
4.4 Bahrain Correlation for Panel Data . . . 138
4.5 Egypt Correlation for Panel Data . . . 138
4.6 Jordan Correlation for Panel Data . . . 139
4.7 Kuwait Correlation for Panel Data . . . 139
4.8 Morocco Correlation for Panel Data . . . 140
4.9 Oman Correlation for Panel Data . . . 140
4.10 Palestine Correlation for Panel Data . . . 141
4.11 Qatar Correlation for Panel Data . . . 141
4.12 Saudi Arabia Correlation for Panel Data . . . 142
4.13 Tunisia Correlation for Panel Data . . . 142
4.14 UAE Correlation for Panel Data . . . 143
4.15 MENA Correlation for Panel Data . . . 143
4.16 Banks SEM Factor Loding . . . 146
4.17 MENA SEM Loding . . . 147
4.18 Bahrain SEM Factor Loading . . . 148
4.19 Egypt SEM Factor Loading . . . 149
4.20 Jordan SEM Factor Loading . . . 150
4.21 Kuwait SEM Factor Loading . . . 151
4.22 Morocco SEM Factor Loading . . . 152
4.23 Oman SEM Factor Loading . . . 153
4.24 Palestine SEM Factor Loading . . . 154
4.25 Qatar SEM Factor Loading . . . 155
4.26 Saudi Arabia SEM Factor Loading . . . 156
4.27 Tunisia SEM Factor Loading . . . 157
4.28 UAE SEM Factor Loading . . . 158
5.1 Bahrain Short Term Debt Panel Data Results . . . 184
5.2 Bahrain Long Term Debt Panel Data Results . . . 185
5.3 Bahrain Total Debt Panel Data Results . . . 186
5.4 Bahrain Dynamical Panel Data Results . . . 187
5.5 Bahrain SEM-PLS Results . . . 188
5.6 Bahrain ANN Results . . . 189
5.9 Egypt Total Debt Panel Data Results . . . 198
5.10 Egypt Dynamical Panel Data Results . . . 199
5.11 Egypt SEM-PLS Results . . . 200
5.12 Egypt ANN Results . . . 201
5.13 Jordan Short Term Debt Panel Data Results . . . 208
5.14 Jordan Long Term Debt Panel Data Results . . . 209
5.15 Jordan Total Debt Panel Data Results . . . 210
5.16 Jordan Dynamical Panel Data Results . . . 211
5.17 Jordan SEM-PLS Results . . . 212
5.18 Jordan ANN Results . . . 213
5.19 Kuwait Short Term Debt Panel Data Results . . . 219
5.20 Kuwait Long Term Debt Panel Data Results . . . 220
5.21 Kuwait Total Debt Panel Data Results . . . 221
5.22 Kuwait Dynamical Panel Data Results . . . 222
5.23 Kuwait SEM-PLS Results . . . 223
5.24 Kuwait ANN Results . . . 224
5.25 Morocco Short Term Debt Panel Data Results . . . 230
5.26 Morocco Long Term Debt Panel Data Results . . . 231
5.27 Morocco Total Debt Panel Data Results . . . 232
5.28 Morocco Dynamical Panel Data Results . . . 233
5.29 Morocco SEM-PLS Results . . . 234
5.30 Morocco ANN Results . . . 235
5.31 Oman Short Term Debt Panel Data Results . . . 241
5.32 Oman Long Term Debt Panel Data Results . . . 242
5.33 Oman Total Debt Panel Data Results . . . 243
5.34 Oman Dynamical Panel Data Results . . . 244
5.35 Oman SEM-PLS Results . . . 245
5.36 Oman ANN Results . . . 246
5.37 Palestine Short Term Debt Panel Data Results . . . 252
5.38 Palestine Long Term Debt Panel Data Results . . . 253
5.39 Palestine Total Debt Panel Data Results . . . 254
5.40 Palestine Dynamical Panel Data Results . . . 255
5.41 Palestine SEM-PLS Results . . . 256
5.42 Palestine ANN Results . . . 257
5.43 Qatar Short Term Debt Panel Data Results . . . 263
5.44 Qatar Long Term Debt Panel Data Results . . . 264
5.47 Qatar SEM-PLS Results . . . 267
5.48 Qatar ANN Results . . . 268
5.49 Saudi Arabia Short Term Debt Panel Data Results . . . 275
5.50 Saudi Arabia Long Term Debt Panel Data Results . . . 276
5.51 Saudi Arabia Total Debt Panel Data Results . . . 277
5.52 Saudi Arabia Dynamical Panel Data Results . . . 278
5.53 Saudi Arabia SEM-PLS Results . . . 279
5.54 Saudi Arabia ANN Results . . . 280
5.55 Tunisia Short Term Debt Panel Data Results . . . 286
5.56 Tunisia Long Term Debt Panel Data Results . . . 287
5.57 Tunisia Total Debt Panel Data Results . . . 288
5.58 Tunisia Dynamical Panel Data Results . . . 289
5.59 Tunisia SEM-PLS Results . . . 290
5.60 Tunisia ANN Results . . . 291
5.61 United Arab Emirates Short Term Debt Panel Data Results . . . 297
5.62 United Arab Emirates Long Term Debt Panel Data Results . . . 298
5.63 United Arab Emirates Total Debt Panel Data Results . . . 299
5.64 United Arab Emirates Dynamical Panel Data Results . . . 300
5.65 United Arab Emirates SEM-PLS Results . . . 301
5.66 United Arab Emirates ANN Results . . . 302
5.67 MENA Short Term Debt Panel Data Results . . . 309
5.68 MENA Long Term Debt Panel Data Results . . . 310
5.69 MENA Total Debt Panel Data Results . . . 311
5.70 MENA Dynamical Panel Data Results . . . 312
5.71 MENA SEM-PLS Results . . . 313
5.72 MENA ANN Results . . . 314
6.1 MENA Islamic and Conventional Banks SEM-PLS Results . . . 340
6.2 MENA Banks Market Leverage Panel Data Results . . . 341
6.3 MENA Banks Book Leverage Panel Data Results . . . 342
6.4 MENA Banks ANN Results . . . 343
A.1 Descriptive Statistics (A) . . . 353
A.2 Descriptive Statistics (B) . . . 354
A.3 Bahrain Descriptive Statistics for Panel Data . . . 355
A.4 Egypt Descriptive Statistics for Panel Data . . . 356
A.5 Jordan Descriptive Statistics for Panel Data . . . 357
A.8 Oman Descriptive Statistics for Panel Data . . . 360
A.9 Palestine Descriptive Statistics for Panel Data . . . 361
A.10 Qatar Descriptive Statistics for Panel Data . . . 362
A.11 Saudi Arabia Descriptive Statistics for Panel Data . . . 363
A.12 Tunisia Descriptive Statistics for Panel Data . . . 364
A.13 UAE Descriptive Statistics for Panel Data . . . 365
A.14 MENA Descriptive Statistics for Panel Data . . . 366
A.15 Bahrain SEM Results . . . 367
A.16 EGYPT SEM Results . . . 368
A.17 Jordan SEM Results . . . 368
A.18 Kuwait SEM Results . . . 369
A.19 Morocco SEM Results . . . 369
A.20 Oman SEM Results . . . 370
A.21 Qatar SEM Results . . . 370
A.22 Saudi Arabia SEM Results . . . 371
A.23 Tunisia SEM Results . . . 371
A.24 UAE SEM Results . . . 372
A.25 Anual Inflation consumer prices . . . 373
To my Father Saleh, who I miss everyday,
M
y full gratitude and appreciation goes to my supervisor (Director ofStudies), Dr.Ahmed El-Masry , whose support, generosity , guid-ance, inspiration and expertise has been particularly instrumental to the successful completion of this thesis. His patience and under-standing of what i went through were vital in helping me continue the PhD journey. I am also grateful for the contribution of my second supervisor Dr.Khine Kyaw who helped me with my first academic conference. Special thanks to my third supervisor Dr. Mojisola Olugbode for the valuable support and for giving me the opportunity to teach during my studies. I would like to thank every one at the Plymouth Business School for their support during my studies, specially Miss.Cher Cressey for produc-ing all the letters and solvproduc-ing all the administrative issues I faced. A special thanks to the King Abdulah Scholarships Program (KASP) for supporting the first part of my PhD course financially. Also a special thanks to the Saudi Electronic University (SEU) for hiring me and for funding the last part of my PhD course. I am grate-ful to the attendees in the following conferences and seminars for their valuable comments and suggestions were chapters of this thesis were presented as papers:• 5th International Accounting & Finance Doctoral Symposium Glasgow.
• 7th Saudi Students Conference-UK Edinburgh.
• 4th Islamic Banking and Finance Conference (IBF 2014) Lancaster
This thesis would not be completed without the encouragement of my fatherEng.Saleh
Albarrak and my mother Naemah Albarrak. Specially my father who gave me the
strength and the courage to pursue this path. His guidance and wisdom contributed to the completion of this thesis.I would like also to thank my wife Dr.Sara Alokley and my daughter Hesa for their love and support during my studies. Specially my wife for all the help and patience through the rough road we have been in together. Finally special thanks to my uncles, Dr.Saad, Dr Abdulrahman and Mr.Ibraheem Albarrak for their continues support and help.I would like also to thank my brothers and sisters, Halah, Abdulaziz, Sara, Dana and Majed for their love.
At no time during the registration for the degree of Doctor of Philosophy has the author been registered for any other University award.
This study was fully financed by the Saudi Electronic University, whose support is greatly appreciated.The following activities, pertaining to the programme of related study, have been undertaken:
Attendance at research training courses in:
Structural Equation Modelling at University of Southampton Panel Data using Stata course at CASS.
Attendance and participation at staff seminars and PhD symposia during which research work was presented.Relevant scientific seminars and conferences were regularly attended at which work was often presented.
Publications :
Journal of Behavior Economics (JEBO)Paper submitted: Is the Capital Struc-ture of Islamic Banks different? A Comparative Study with Conventional Banks in MENA countries. Under Review
Posters and conference presentations :
2012:
5th International Accounting & Finance Doctoral SymposiumGlasgow. Paper presentation: Determinants of Capital Structure: Evidence from Bahrain. 2013:
7th Saudi Students Conference-UK Edinburgh. Paper presentation: Is the Capital Structure of Islamic Banks different? A Comparative Study with Conventional Banks in MENA countries.
2014:
4th Islamic Banking and Finance Conference (IBF 2014) Lancaster Paper presentation: Is the Capital Structure of Islamic Banks different? A Com-parative Study with Conventional Banks in MENA countries.
Word count for the main body of this thesis:79540
Signed:
ANN Artificial Neural Networks ATM Automated Teller Machine BIS Bank of International Settlement CB Conventional Banks
CMA Capital Market Authority CR Credit Rating
DPD Dynamical Panel Data Model FE Fixed Effects Model
GCC Gulf Cooperation Council countries GDP Gross domestic product
GNS Gross National Saving
GRNN Generalized Regression Neural Networks IB Islamic Banks
IMF International Monetary Fund MC Market Cap
OW Ownership Structure PBUH Peace Be Upon Him PLS Partial Least Square PLS Profit Loss Sharing POT Pecking Order Theory RE Random Effect Model SC Securities Commission SEM Structural Equation Modelling TBM Tobit Model
TOT Trade Off Theory UAE United Aram Emirates UN United Nations
UNDP United Nations Development Programme WACC Weighted Average Cost of Capital
Ijarah
is an exchange transaction in which a known benefit arising from a specified asset is made available in return for a payment, but where ownership of the asset itself is not transferred.
Ijma
is a term referring to the consensus or agreement of the Muslim community basi-cally on religious issues.
Ijtihad
is a term of Islamic law that describes the process of making a legal decision by independent interpretation of the legal sources, the Qur’an and the Sunnah.
Istisna
is a contract of exchange with deferred delivery, applied to specified made-to-order items.
Mudaraba
is a contract of partnership in which one side provides capital and other side pro-vides labor.
Musawama
is a term that describes a sale in which the seller is not obligated to disclose the price paid to create or obtain the good or service.
Musharka
is a joint enterprise or partnership structure with profit/loss sharing implications that is used in Islamic finance instead of interest-bearing loans.
pared and contrasted with those of the Qur’an, in order to apply a known injunction to a new circumstance and create a new injunction.
Quran
is the central religious book of Islam, which the revelation from God.
Riba
it refers to the charged interest which is forbidden under Sharia law because it is exploitive.
Salam
is a contract in which advance payment is made for goods to be delivered at a future date, following Islam and Islamic shariah.
Sharia Law
is the Islamic legal system derived from the religious precepts of Islam, particularly the Quran and the Hadith.
Sunnah
is the verbally transmitted record of the teachings, deeds and sayings, silent permis-sions or disapprovals of the Islamic prophet Muhammad, as well as various reports about Muhammad’s companions.
Urf
is a term referring to the custom, or ’knowledge’, of a given society. To be recog-nized in an Islamic society it must be compatible with the Sharia law.
Zakkat
payment made annually under Islamic law on certain kinds of property and used for charitable and religious purposes, one of the Five Pillars of Islam.
Introduction
1.1 Introduction
T
he original work of Modigliani and Miller (1958) sets the foundation for the new corporate finance theory. They argued that under sev-eral assumptions the capital structure have no effect on the value of the company. Half a century since their propositions and the de-bate is still on. The importance of the problem is what fuels more researchers to study what determines a company capital structure. The purpose of this thesis is to compare different approaches used in testing the determinants of capital struc-ture. The thesis data is from the Middle East and North Africa (MENA) region which includes countries with unique tax systems. This study also shed light on the dif-ference in determining the capital between these countries. The majority of studies in the chosen countries exclude the financial firms based on the fact that they are regulated. This study use both the financial and non financial firms following recent evidence which suggested that the capital structure of financial firms also follows classic determinants.1.2 The objectives of the study
The main objectives of the study are:
Trade-off-theory and the pecking order theory in the MENA countries for the non-financial firms. Using different methods namely the Panel Data Models , Tobit Model, Structural Equation Modeling (SEM) and Artificial Neural Networks (ANN).
• To Study the cross-country differences in capital structure between the MENA countries.
• To Compare the empirical approaches used to study capital structure which are the Panel Data Models , Tobit Model, Structural Equation Modeling (SEM) and Artificial Neural Networks (ANN).
• To investigate empirically the capital structure theories which are the Trade-off-theory, The pecking order theory in the MENA countries for the financial firms. Using different methods namely the Panel Data Models , Tobit Model, Structural Equation Modeling (SEM) and Artificial Neural Networks (ANN).
• To compare the capital structure of Islamic banks and Conventional banks in the MENA countries.
• To Investigate and empirically test the relationship between Capital structure and Credit Rating by following the model of Kisgen (2006), this study will also model the relation using SEM and ANN for for the banks sample only.
1.3 The contribution and significance of the study
The common practice in the literature is biased towards a single approach. A gap exists in the literature in terms of methodological comparisons. While several stud-ies did compare different models like OLS, Panel Data and SEM, this is the first study to our knowledge that uses the majority of the approaches in the same study.
This thesis could be used as a guide to the different approaches used to study the determinants of capital structure.
This study use the Panel data models which are the OLS, Fixed effect and Ran-dom effect. We also use the Dynamical model suggested by Arellano and Bond (1991) to test the speed of adjustment. Then, we use the Partial Least Square Structural Equation Modeling (PLS-SEM) to investigate the different attributes of capital structure.This approach does have several advantages over the panel data models. Finally, we use the GRNN models to check the robustness of our results as this tool provided the variable impact using the Artificial Neural Networks.
Moreover, despite the importance of MENA countries which include the Gulf Council Countries (GCC) as the largest oil producers in the world, to our knowl-edge this is the first study to apply the SEM and GRNN approaches in this region.
Furthermore, financial institutions are excluded in the literature due to the fact that they are under the government regulations and therefore they do not have a choice to make in regards to their capital structure. However, despite the existence of regulations which control the banks leverage behavior bankers still have some flexibility within a specific range were they could determine their capital structure. This thesis will include financial and non-financial companies which is a major con-tribution since no study has examined banks in the selected area. We also compare the Islamic and Conventional banks’ capital structure in the MENA countries. Ev-idence by Octavia and Brown (2010) and Gropp and Heider (2010) suggest that regulations are of second order and that banks do follow the classic determinants of capital structure.
Additionally, the classic capital structure determinants that affect the capital struc-ture choice are mostly similar across the studies in the literastruc-ture. Limited studies used Kisgen (2006) model of credit rating to test the relationship with capital
struc-ture in the MENA countries. He argues that credit rating has an impact on the choice of corporation financing.
1.4 Thesis organization
The thesis will be divided into seven chapters. Chapter one is the introduction chap-ter. Chapter two will provide an in depth background about the economic, financial and institutional environment in the MENA countries. This will include the eco-nomic measures such as the Gross Domestic Product (GDP), external balances, unemployment, population, immigration, currency and inflation. Then the financial background will include the capital markets, access to finance, accesses to credit, financial stability,efficiency and Islamic finance. Finally, an overview of the institu-tional characteristics such as accounting standards, quality of investor laws, ease of doing business, regulators, stock exchanges and tax systems. Chapter three will provide a literature review of the main theories of capital structure. First, it discuss the cost of capital and the cost of debt. Then it will provide a theoretical review of the main theories of capital structure such as Modigliani-Miller modes, trade-off theory, pecking order theory, agency cost theory and market timing theory. Then, it will pro-vide a review of the empirical epro-vidence from different parts of the world. First it start with the cross-country comparison studies. Then it provide a survey of the studies conducted in the developed, developing and MENA countries. This chapter also in-clude a discussion of the methods used in approaching the capital structure as well as the measures widely used in the previous studies. Chapter four will start with the data used in this study, and the variables chosen and pre-analysis statistics. Then a discussion of the different methodologies used which are the Panel Data analysis and the Partial Least Square Structural Equation modeling PLS-SEM and The Generalized Regression Neural Networks (GRNN). After that, The correlation matrices and factor loadings will be presented and discussed.
Chapter five include the findings for the determinants of capital structure in the non-financial firms in the MENA countries. This PhD test the classic determinants of capital structure for ten countries and do a cross section comparison to see the differences. This chapter also study the effect of the industry classification and ownership structure on capital structure. In this chapter three approaches are used as stated before which are Panel Data Models, SEM, ANN.
Chapter six investigate the determinants of capital structure in financial firms. The focus of this chapter is on the Banks in the MENA countries. This chapter also include a comparison between the Islamic and Conventional banks. In this chapter Panel Data Models, SEM, ANN are used. In this chapter a test of the credit rating and ownership structure for a pooled sample of banks from the MENA countries is presented.
Chapter seven gives a summary of the results, findings and a theoretical dis-cussion. It also provide the implications and limitations of this thesis. Finally, it concludes the thesis and recommend future research areas that researchers could follow.
Background
2.1 Introduction
T
his chapter will present an overview about the economic, financial and in-stitutional backgrounds of the MENA countries. Screening these coun-tries background is important for several reasons. First, it will identify the main characteristics of these countries. Then, it will explore the main economic indicators which will help us understand the behaviour of the leverage choice in the later chapters.Our main interest in this chapter is to highlight the differences between the MENA countries and the other regions as well as finding similarities and differences be-tween them. Generally, the MENA region constitutes countries with very high in-come mainly from exporting oil and countries with very low inin-come which are depen-dent on foreign aid. These issues make this area interesting and worth researching.
2.2 Economics Background
This section reviews the leading features of the MENA countries. These include the main economic indicators like gross domestic product (GDP), annual GDP growth rate, GDP per capita in US dollars, the annual gross national saving (GNS) as a percentage of (GDP), external trade, unemployment, population and immigration and currency and inflation.
2.2.1 Gross Domestic Product (GDP)
The MENA region represents a considerable portion of the world GDP. In 2013 the total nominal GDP reached 3296 billion US dollars which represents 5.1% of the world GDP. Several countries have a very high GDP such as Turkey and Saudi Arabia which between them share almost 47.5% of the region’s total GDP. Saudi Arabia GDP is 745 billion while Turkey GDP is around 820 billion in 2013. On the other hand, the majority of the countries in the region are small economies such as Bahrain, Jordan, Lebanon, Syria, Tunisia, Palestine and Yemen. These countries for example if combined will only result in 291 billion US dollars which represent only 35% of the size of the largest economy in MENA countries which is Turkey. Table 2.1 demonstrating the value of the GDP for the MENA countries in the last 9 years.
Table 2.2 shows that the majority of the countries experienced a stable growth rate in the last decade.Moreover, the real GDP growth rate in the MENA region was similar to the World and North America with a value of 2.25%; although it was significantly higher in 2012 reaching 5.75%. All economies in the world were hit by the financial crises of (2008-2009) and it did have a strong effect on MENA countries as they record their lowest growth rate. However, since then the majority of countries have bounced back to their pre-crises levels except the countries who are in the middle of political conflicts such as Egypt, Syria, Tunisia and Libya. The countries with the highest growth rate in 2013 are Bahrain, Oman and Saudi Arabia. This is due to the increase in the oil price during this year. However, we also notice that Libya did have a sharp fluctuation in the last 3 years. This is due to the political change and the distribution of the oil which led the country to a negative growth rate. Furthermore, Syria did not report any figures since the uprising started in 2011 and before that as well. Iran was hit hard in 2013 and suffered a negative annual growth
Table 2.1: Gross Domestic Product (GDP) in US$ billions Country Name 2005 2006 2007 2008 2009 2010 2011 2012 2013 Algeria 103B 117B 135B 171B 137B 161B 199B 204B 210B Bahrain 16B 19B 22B 26B 23B 26B 29B 30B 33B Egypt 90B 107B 130B 163B 189B 219B 236B 263B 272B Iran 192B 223B 286B 356B 363B 423B 528B 503B 369B Iraq 50B 65B 89B 132B 112B 143B 191B 216B 223B Jordan 13B 15B 17B 22B 24B 26B 29B 31B 34B Kuwait 81B 102B 115B 147B 106B 120B 161B 183B n/a Lebanon 21B 22B 25B 29B 35B 38B 40B 43B 44B Libya 44B 56B 72B 93B 62B 75B 35B 82B 75B Morocco 60B 66B 75B 89B 91B 91B 99B 96B 104B Oman 31B 37B 42B 61B 48B 59B 70B 78B 81B Qatar 45B 61B 80B 115B 98B 125B 170B 190B 202B Saudi Arabia 328B 377B 416B 520B 429B 527B 670B 734B 745B
Syria 29B 33B 40B n/a n/a n/a n/a n/a n/a
Tunisia 32B 34B 39B 45B 43B 44B 46B 45B 47B Turkey 483B 531B 647B 730B 615B 731B 775B 789B 820B UAE 181B 222B 258B 315B 255B 287B 349B 384B n/a Palestine 5B 5B 5B 6B 7B 8B 10B 10B n/a Yemen 17B 19B 26B 30B 28B 32B 29B 32B 36B Totals 1819B 2111B 2518B 3051B 2664B 3135B 3665B 3914B 3296B 1Source: IMF
for the first time in the last decade and this is due to the new sanctions imposed by the European Countries who decided to join the US in its oil ban.
Moreover, the GDP per capita average in the MENA countries is around $8,550. This is considered to be significant in comparison with other regions. The MENA countries are closer to the levels of Latin America and the Caribbean region as well as East Asia and Pacific where the average GDP per capita is $10,008 and $9,115 respectively. However, the region is still significantly far from the developed economies in the region of North America and Europe and Central Asia where the first is almost 6 times and the second is almost 3 times the average of the MENA countries. Countries in the MENA region vary in their averages significantly. As Table 2.3 show several countries have a substantial average while other countries
Table 2.2: Annual Growth Rates of Real GDP Country Name 2005 2006 2007 2008 2009 2010 2011 2012 2013 Algeria 5.90 1.70 3.40 2.00 1.60 3.60 2.80 3.30 2.70 Bahrain 6.77 6.47 8.29 6.24 2.55 4.34 2.10 3.40 5.49 Egypt 4.47 6.84 7.09 7.16 4.69 5.15 1.76 2.21 2.10 Iran 4.62 5.89 7.82 0.58 3.94 5.89 3.00 3.00 -5.80 Iraq 4.40 10.16 1.38 6.61 5.81 6.90 9.68 9.16 3.95 Jordan 8.14 8.12 8.18 7.23 5.48 2.34 2.56 2.65 2.83 Kuwait 10.08 7.52 5.99 2.48 -7.08 -2.37 6.30 6.19 n/a Lebanon 2.70 1.60 9.40 9.10 10.30 8.00 2.00 2.20 0.90 Libya 9.90 5.90 6.00 3.80 2.10 5.00 -62.08 104.48 -9.37 Morocco 2.98 7.76 2.71 5.59 4.76 3.64 4.99 2.69 4.41 Oman 3.99 5.50 6.80 12.80 1.10 5.60 4.49 4.99 5.07 Qatar 7.49 26.17 17.99 17.66 11.96 16.73 14.79 2.56 5.55 Saudi Arabia 7.26 5.58 5.99 8.43 1.83 7.43 8.57 5.81 3.80 Syria 6.20 5.00 5.70 n/a n/a n/a n/a n/a n/a Tunisia 3.82 5.65 6.22 4.74 3.61 3.61 -0.23 4.09 2.81 Turkey 8.40 6.89 4.67 0.66 -4.83 9.16 8.77 2.13 4.05 UAE 4.86 9.84 3.18 3.19 -4.80 1.67 3.88 4.37 n/a Palestine 8.84 -5.84 -2.91 -7.74 19.54 3.44 7.66 13.84 n/a Yemen 5.59 3.17 3.34 4.01 4.13 3.32 -15.09 2.47 4.16 2Source: IMF
have a superior average with values of $76,025 and $37,056 consequently. Also, countries like Bahrain, Oman, Saudi Arabia and United Arab Emirates do have considerably high averages. In a different manner, the likes of Egypt, Morocco, Palestine, Syria and Yemen are considered to have a low average of GDP per capita. The reasons behind the extraordinary averages in Kuwait and Qatar include the mix of high income from oil and the small population.
In addition, a distinct feature that is obvious in the MENA region is the significant difference in the gross national saving as a percentage of GDP. Although, the av-erage for the MENA region is considered high with 31.6% the avav-erage savings of the world is 25%. It is due mainly to oil exporting countries who are the reason be-hind the high average. As Table 2.4 illustrates countries like Algeria, Kuwait, Libya, Qatar and Saudi Arabia have around 50% of their GDP as savings. However,
coun-Table 2.3: Annual Gross Domestic Product (GDP) per capita in US dollars Country 2005 2006 2007 2008 2009 2010 2011 2012 2013 Average Algeria 3141 3514 3992 4990 3943 4567 5528 5694 5683 4561 Bahrain 18324 21156 24171 28416 18563 19420 22918 23477 23930 22264 Egypt 1283 1506 1771 2160 2453 2776 2930 3112 3146 2348 Iran 2925 3429 4312 4857 4927 5638 6599 7211 5568 5052 Iraq 1794 2266 3003 4328 3575 4278 5529 6305 6708 4198 Jordan 2300 2689 2990 3757 3987 4326 4618 4879 5207 3862 Kuwait 27015 31907 33733 42824 30410 33481 43723 45824 44585 37056 Lebanon 5713 5903 6639 7795 8983 9501 9856 10311 10793 8388 Libya 8204 9328 11239 14186 10071 11729 5513 12778 14761 10867 Morocco 1973 2152 2439 2851 2885 2850 3082 2999 3260 2721 Oman 11806 13784 15369 21808 16734 23351 23380 24765 24729 19525 Palestine 1456 1443 1576 1856 1963 2339 2665 2783 n/a 2010 Qatar 50121 58443 65007 79582 59676 74901 98031 99731 98737 76025 Saudi Arabia 14079 15625 16678 20157 16095 19113 23599 25085 25163 19510 Syria 1510 1705 2014 2554 2557 2803 n/a n/a n/a 2190 Tunisia 3218 3394 3807 4345 4169 4198 4335 4232 4533 4026 Turkey 7040 7626 9245 10272 8528 10017 10471 10609 11236 9449 UAE 43989 52486 57468 65992 51270 54411 63626 64840 64780 57651 Yemen 798 882 971 1171 1061 1272 1343 1377 1461 1149
3Source: IMF
tries such as Egypt, Jordan, Lebanon, Palestine, Tunisia, Turkey and Yemen have low savings which are below the world average. We can see that the oil exporter countries have a substantially high average of around 43.4%. But, countries in the non-exporting category have a low average of around 15.3%. The results of the non-exporting are considered below the world average by around 48.8%.
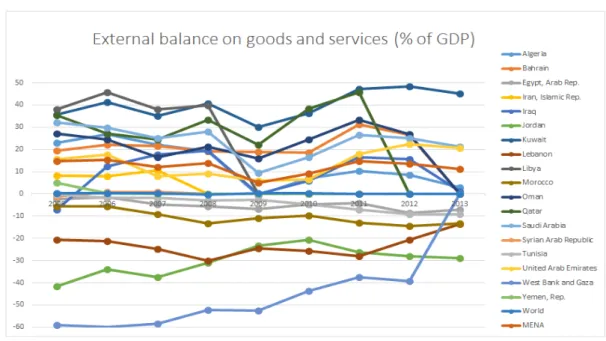
2.2.2 External Balance
The external balance on goods and services is also called the net exports. It is calculated as the difference between the value of the exports and imports. The countries who have a positive value are said to have a surplus and the countries that have a negative value are facing a deficit. The soaring prices of oil which started In 2006 through to the end of 2014 meant that oil exporters experienced a high level of surplus. For example, Saudi Arabia, Kuwait, Qatar did all benefit from the oil prices and the value of external balance in 2013 was around 21.2%, 45%
Table 2.4: Annual Gross National Savings (GNS) as a percentage of (GDP) Country 2005 2006 2007 2008 2009 2010 2011 2012 2013 Average Algeria 51.9 54.6 57.0 57.6 47.1 49.2 46.1 42.4 47.7 50.4 Bahrain 35.4 38.2 42.7 44.1 30.2 34.5 37.3 42.0 39.2 38.2 Egypt 21.2 20.4 22.9 22.9 16.8 17.5 14.5 13.6 13.5 18.2 Iran 39.0 39.2 46.4 44.4 42.5 47.7 43.9 35.0 37.6 41.7 Iraq 38.8 24.5 18.6 40.0 16.3 24.4 31.8 27.3 23.5 27.2 Jordan 16.1 18.7 13.2 16.4 19.5 16.0 12.6 7.4 17.3 15.2 Kuwait 56.8 64.7 57.2 58.5 43.0 52.2 59.6 62.2 59.2 57.0 Lebanon 8.2 16.8 21.0 20.9 24.4 23.6 14.1 8.6 7.9 16.2 Libya 64.8 73.0 73.2 77.7 54.1 59.1 29.2 52.4 46.5 58.9 Morocco 30.6 31.6 32.4 32.9 30.2 30.9 27.8 26.3 29.5 30.2 Oman 39.9 41.6 37.6 41.9 24.1 33.6 46.3 44.6 41.7 39.0 Palestine -2.0 2.0 26.0 30.0 7.0 9.0 0.0 6.0 n/a 9.8 Qatar 63.7 59.2 59.0 58.0 46.1 57.2 55.7 55.4 56.3 56.7 Saudi Arabia 47.6 48.5 48.9 52.8 36.6 43.4 50.7 51.0 48.2 47.5 Syria 19.2 24.3 21.2 18.9 18.5 20.9 n/a n/a n/a 20.5 Tunisia 20.8 21.6 21.5 22.1 21.9 21.6 17.6 18.2 18.1 20.4 Turkey 15.4 16.0 15.1 16.1 12.8 13.3 14.1 14.7 14.2 14.6 UAE 31.6 34.5 30.7 30.1 24.2 25.0 31.5 32.6 31.5 30.2 Yemen 22.3 17.5 10.2 10.8 3.3 7.9 1.4 9.3 6.0 9.9 Oil exporter 45.5 46.3 45.8 48.9 35.8 41.6 41.8 42.8 41.9 43.4 Non-Oil exporter 15.1 17.1 18.9 19.8 15.5 16.2 10.6 11.1 12.8 15.3 World 23.4 24.7 24.9 24.7 22.7 23.9 24.7 24.8 25.0 24.3 4Source:IMF
and 45.8% respectively. However, several countries were facing a negative level such as Palestine, Lebanon, Jordan and Morocco as Figure 2.1 shows.
Non-oil exporters in the MENA countries suffered critically from negative trade balances. Although it is not bad to have a deficit in trade balance in the short term, it is considered to be a problem when it is persistent. The Algeria trade balance decreased significantly since the levels of 2005. Although the exports did increase by 29.2% the large increase in imports by 63% led the country to hit a low in 2013 in terms of trade balance. Therefore, the external balance as a percentage of GDP represented only 2.8% in 2013. Also, Egypt continues to have a deficit in their trade balance. The deficit increased from 2005 to 2013 by 68% mainly with the increase in imports. Jordan and Lebanon also face the same problem as Egypt. A significant increase in imports without the exports matching these imports meant
both countries have suffered from a deficit since 2005. However, their levels did increase from 2005 to 2013 by 55% and 56.7% respectively. Moreover, Morocco, Syria and Tunisia did have a deficit in their balance of trade for the same reasons. The exports are increasing at a larger rate than the exports. The trade balance deficit was more than doubled in Morocco for the last 10 years. It did decrease by -1.8% for Syria although this number is not correct due to the political conflict in the country. It also increased by 19% for Tunisia. Turkey and Palestine also faced a negative level with their negative trade balance increasing by 2.5 times in Turkey and 18% in Palestine. Yemen did have a positive trade balance for the year 2011 but there is no data available for the 2012 and 2013.
The export revenues for most of the oil exporting countries depend on the price of oil. On the other hand, the imports are mostly to satisfy the domestic demand for goods. However, the majority of oil exporters in the MENA countries faced a long term problem of a less diversified economy. The oil producing countries in this study all faced a healthy positive trade balance. This is connected to the extreme revenues they received from the high price of oil. First, Bahrain, Saudi Arabia, Kuwait have had a solid increase in their trade balance in the last 9 years. The growth rate is around 87%, 41% and 66% from 2005 to 2013. The average increase per year is around 9.6%, 4.6% and 7.3% respectively. Likewise, Iraq and Iran and Libya also benefited from the increased oil prices. Iran did have an increase of 50%. Iraq increase was substantial due to the fact that it was in a war until 2005 where the trade balance was 165 and now reached 28550 with an increase of almost 99.4%. Libya also faced the same problem as Iraq where there was a sharp fluctuation in their trade balance. A deep drop started with the Arab uprising in 2011 where the trade balance dropped by 182% due to the disturbance in oil production. It increased again to normal levels in 2012 only to drop again in 2013. Also, Oman,
5Source: IMF
Figure 2.1: External Balance as a percentage of (GDP)
Qatar and United Arab Emirates are all members of the Gulf Cooperation Council (GCC) and oil exports have faced a deficit in the last decade. Their deficit increased from 2005 to 2013 by 79.1% for Oman, 71.4% for Qatar and 66.5% for UAE.
The MENA countries trade with a broad number of countries, with the exception of countries which face sanctions such as Iran, Iraq, Lebanon and Libya. In general the main regions exporting to the MENA countries are Asia with 35.6% and Europe with 28.9% and the MENA region with 17.8%. On the other hand, the major im-porters from the region are Asia with 13% and the MENA region with 17.8%. The MENA region countries contribute around 7% of the World total trade.
2.2.3 Unemployment
One of the major challenges facing countries in the MENA region is the high long-term unemployment rate. The unemployment varies between the different countries in the region. In the GCC countries with a small population such as Kuwait, Qatar and the UAE the unemployment is very low with values of 1.5%, 0.6% and 3.8%
Table 2.5: Unemployment as a percentage of total labor force) Country Name 2005 2006 2007 2008 2009 2010 2011 2012 2013 Algeria 15.3 12.3 13.8 11.3 10.2 10 9.9 9.8 n/a Bahrain 8.8 8.5 8.2 7.8 7.6 7.5 7.4 7.4 n/a Egypt 11.2 10.6 8.9 8.7 9.4 9 12 11.9 n/a Iran 12.1 11.6 10.6 10.5 12 13.5 13.3 13.1 n/a Iraq 18 17.5 16.9 15.3 15.3 15.2 15.2 15.1 n/a Jordan 14.9 14 13.1 12.7 12.9 12.5 12.9 12.2 n/a Kuwait 2 1.6 1.6 1.6 1.6 1.6 1.6 1.5 n/a Lebanon 8 8.1 9 9 8.9 8.9 8.9 8.9 n/a Libya 9.1 9 8.9 8.8 8.7 8.6 8.1 8.9 n/a Morocco 11 9.7 9.7 9.6 9.1 9.1 8.9 9 n/a Oman 8.5 8.5 8.5 8.5 8.4 8.3 8.2 8.1 n/a Qatar 1.2 0.9 0.5 0.4 0.3 0.4 0.6 0.6 n/a Saudi Arabia 5 6.3 5.7 5.1 5.4 5.5 4.4 5.6 n/a Syria 9.2 8.2 8.4 10.9 8.1 8.4 8.4 8.3 n/a Tunisia 12.9 12.5 12.4 12.4 13.3 13 12.9 12.8 n/a Turkey 10.6 10.2 10.3 11 14 11.9 9.8 9.2 n/a UAE 3.1 3.3 3.4 4 4 4 4 3.8 n/a Palestine 26 23.6 21.6 26 24.5 23.7 21 23 n/a Yemen 16.1 15.7 15.3 15 14.6 17.8 17.7 17.6 n/a 6Source: IMF
respectively. On the other hand, countries with a large population such as Saudi Arabia and Oman have a considerable high unemployment rate. The rate in Saudi Arabia is 5.6% and in Oman 8.1%. The special case is Bahrain which does have a small population but at the same time a high unemployment rate in comparison with similar sized countries in the region such as Qatar and UAE. The percentage is 7.4%.
Other countries in the MENA region do have a significantly high unemployment rate ranging between 8 and 23 percent. Countries in North Africa which are Alge-ria, Egypt, Libya, Morocco and Tunisia share a high number of unemployed citizens. Algeria did decrease the unemployment from 15.3% in 2005 to 9.8% in 2012. Fur-thermore, Morocco also did decrease the unemployment rate from 11% to 9% from 2005-2013. One of the main reasons behind that is the stable political status in the
two countries. On the other hand, Egypt did decrease the unemployment from 2005 to 2011 by 2.2% but the Arab rising in 2011 had an effect on the unemployment rate increasing to record levels of 12% in 2011 and 11.9% in 2012. The case in Egypt is the same as in Libya where levels increased after the revolution. Tunisia always has a high unemployment rate. The rate was over 12% from 2005 to 2012, reaching at peak in 2009 with a figure of 13.3%. The rest of the countries in the MENA region also have a high unemployment rate. These are Iran, Iraq, Jordan, Lebanon, Syria, Turkey, Palestine and Yemen.
It is better to discuss Iraq and Syria first simply because these are countries with unstable political issues. Iraq has recently been in a war and the situation is still uncertain. Moreover, the situation is even worse in Syria. The civil war is still ongoing and numbers of refugees increasing. The war has claimed 180,000 lives up to now, and the economic loss is estimated at $144 Billion (US) which is the equivalent of two and a half times the 2010 (GDP). Also, Iran suffered greatly from the 2008-2009 financial crisis. The unemployment rate in 2008 was 10.5% and increased to 12%, 13.5% and 13.3% from 2009-2011. This also has a relationship with the Iranian Nuclear program and the sanctions imposed on them. Turkey did have a noticeably high rate as well, as Table 2.5 shows the financial crisis had a strong effect on unemployment reaching 14% in 2009 from 11% the previous year. In addition, the unemployment rate did improve in the years 2011-2012 reaching better levels than before the crisis of 9.8% and 9.2% in that order. Jordan’s rate did decrease from 14.9% in 2005 to 12.2% in 2012. Lebanon on the other hand, had a stable unemployment rate ranging from 8-9% through the last decade.
According to OSullivan et al. (2011) the two countries with the largest level of unemployment are Palestine and Yemen. Their levels have been increasing sub-stantially in the last 15 years. Yemen has had a high rate through the last 9 years.
It has also increased in the last three years. The unemployment rate was around 17.6% for the year 2012. It is understandable for a country like Palestine to face such economic turmoil. Therefore, it is not shocking to find out that the unemploy-ment rates are the highest in the area. The rate was 23% in 2012. OSullivan et al. (2011) also points out that these figures are the official ones and that non official numbers would be higher than these levels. They stress that the unemployment lev-els are higher in a certain group of the population. As they point out the percentage is high in the youthful and especially fresh graduates.
2.2.4 Population and Immigration
The MENA countries have different levels of resources and population. The total population is around 468 million which represents 6.5% of the population of the world. The population varies from countries with high population such as Egypt, Iran and Turkey with 82 million, 77.4 million and 74.9 respectively to countries with low population such as Bahrain and Qatar who have 1.3 and 2.1 million inhabitants only. Several reasons contribute to the high growth experienced by the region. These are the improvement in health care and standard of living plus a high fertility rate.
As Table 2.6 shows all the countries in our sample have experienced a growth in the population over the last 7 years. For example as we can see from the table countries like Qatar, UAE, Oman, Bahrain and Kuwait have a very high rate of growth, where the increase in the population was 164%, 125%, 44%,51% and 46% respectively. On the other hand, the rest of the countries had an average of 15% over the period from 2005-2013. The countries with the lowest growth are Tunisia and Morocco where the growth was 8.5% and 9.5%.
It is also notable that the majority of the rich countries used to have a small population and the low income countries have a large population. This situation
Table 2.6: Total Population in Thousands Country Name 2005 2006 2007 2008 2009 2010 2011 2012 2013 Algeria 33961 34507 35097 35725 36383 37063 37763 38482 39208 Bahrain 880 951 1032 1116 1192 1252 1293 1318 1332 Egypt 71778 72991 74230 75492 76775 78076 79392 80722 82056 Iran 70152 70977 71809 72661 73543 74462 75424 76424 77447 Iraq 27377 28064 28741 29430 30163 30962 31760 32578 33417 Jordan 5411 5536 5661 5786 5915 6046 6181 6318 6459 Kuwait 2296 2417 2555 2702 2850 2992 3125 3250 3369 Lebanon 3987 4080 4140 4186 4247 4341 4383 4425 4467 Libya 5594 5686 5782 5877 5964 6041 6103 6155 6202 Morocco 30125 30395 30667 30955 31277 31642 32059 32521 33008 Oman 2522 2555 2570 2594 2663 2803 3025 3314 3632 Qatar 821 968 1152 1359 1564 1750 1911 2051 2169 Saudi Arabia 24690 25372 25916 26366 26796 27258 27762 28288 28829 Syria 18167 18805 19561 20346 21032 21533 21962 22399 22846 Tunisia 10029 10128 10225 10329 10440 10549 10674 10778 10887 Turkey 67743 68626 69497 70364 71241 72138 73059 73997 74933 UAE 4149 4876 5797 6799 7718 8442 8925 9206 9346 Palestine 3320 3406 3494 3597 3702 3811 3927 4047 4170 Yemen 20140 20662 21182 21704 22230 22763 23304 23852 24407 Totals 403144 411002 419109 427387 435695 443922 452032 460124 468184 7Source: IMF
led to high income countries which are the GCC countries and Libya spending on transforming their countries from deserts to modern countries. This transformation with no labour led them to import labour from their neighboring countries as well as other countries. This led to the foreign work force becoming dominant in these countries.
It is also notable that the majority of the rich countries used to have a small pop-ulation and the low income countries a large poppop-ulation. A recent report by the (UN) shows the figures of the in and out in the whole world. Table 2.7 demonstrates the numbers of immigrants in the different countries in the MENA region, as well as the number of expats living abroad either in MENA countries or other countries. We notice that the countries could be classified into two groups. The first group is countries where there is a large number of immigrants in some extreme cases
Table 2.7: Total Immigration in Thousands
Country In Out
Total MENA Others Mena Total MENA Others Mena Algeria 270.4 114.4 156.0 42% 1,716.2 35.7 1,680.5 2% Bahrain 729.4 129.3 600.1 18% 61.7 16.2 45.5 26% Egypt 297.4 191.4 106.1 64% 3,469.4 2,885.9 583.6 83% Iran 2,649.5 84.4 2,565.2 3% 1,058.6 35.5 1,023.1 3% Iraq 95.8 69.3 26.4 72% 2,318.7 1,434.1 884.6 62% Jordan 2,925.8 2,862.5 63.3 98% 639.2 494.0 145.2 77% Kuwait 2,028.1 344.6 1,683.4 17% 323.0 247.1 75.9 77% Lebanon 849.7 825.9 23.8 97% 683.1 119.7 563.4 18% Libya 756.0 508.7 247.2 67% 142.2 18.0 124.2 13% Morocco 50.8 25.3 25.4 50% 2,854.5 48.8 2,805.7 2% Oman 1,112.0 68.4 1,043.6 6% 24.0 12.5 11.5 52% Palestine 256.5 162.6 93.9 63% 3,640.2 3,503.4 136.8 96% Qatar 1,601.0 284.2 1,316.8 18% 19.9 13.9 6.1 70% Saudi Arabia 9,060.4 2,492.6 6,567.8 28% 262.9 98.0 164.9 37% Syrian 1,394.2 1,001.6 392.6 72% 681.0 373.9 307.1 55% Tunisia 36.5 14.2 22.3 39% 643.6 26.5 617.1 4% Turkey 1,864.9 59.1 1,805.8 3% 3,109.0 184.5 2,924.5 6% United Arab Emirates 7,827.0 1,315.4 6,511.6 17% 131.5 74.2 57.3 56%
Yemen 314.7 28.1 286.6 9% 923.2 810.3 112.9 88%
8Source: United Nation
higher than the citizens. On the other hand, a second group is countries with a large number of citizens and a large number of expats who live outside the country of ori-gin. Countries with a very large foreign population are Bahrain 69%, Kuwait 60.1%, Qatar 73% and UAE 83.75%. In these countries the foreigners are more than the natives. This is linked with the development of the oil industry. These foreigners are mainly from outside the MENA countries, the percentages are 18%, 17%, 18% and 17% respectively. Therefore, the majority of the foreigners are from non-MENA countries.
In addition, there are also countries with a medium foreign population such as Jor-dan 45%, Lebanon 19%, Libya 12%, Oman 30%, Saudi Arabia 31.4%. The reason we did not list Jordan and Lebanon with the first group is that the majority of the foreigners are refugees either from Palestine, Iraq and Syria. Then there is Libya,
Oman and Saudi Arabia. These three countries are all oil exporters and have a considerably high number of foreigners in their countries. Saudi Arabia has the largest population of foreign workers in the region with the number reaching 9 mil-lion at the end of 2013. This practise did lead to a big challenge in these countries where citizens could not find jobs and this will be discussed later in the section of unemployment.
Countries with a large population did have a reverse effect. While the oil exporting countries were importing work force these countries were exporting workers either to the oil countries or other countries. Table 2.7 under the section out we can see the figures for the countries in MENA region. Countries with a significantly high number of expatriates living abroad as a percentage of the total population are Jor-dan 9.9%, Kuwait 9.59%, Lebanon 15.29% and Morocco 8.65%. Also Palestine has around 87.30% of the population as refugees in neighbouring countries. Fur-thermore, the countries with the large number of expats as a number are Palestine, Egypt, Turkey, Morocco, Iraq, Algeria and Iran. In total there are 22.7 million expats from the MENA countries in which 10.4 million are in other MENA countries.
2.2.5 Currency and Inflation
The MENA countries’ currencies are classified into 3 exchange rate regimes. First, countries which peg their currency to the US dollar which is also called the fixed exchange rate system. These are the GCC countries with the exception of Kuwait. These countries are Bahrain, Oman, Qatar, Saudi Arabia and UAE. Using the fixed-exchange rate helped these countries to keep the level of inflation low and avoid currency fluctuations. It also gave confidence to investors. However, these benefits are at a cost as they have less flexibility to react to temporal shocks that they face. For example, these countries will have to follow the US interest rates strictly. The only tool they have to reduce inflation is to cut spending and to reduce credit to the
private sector. Ambitious plans for a currency monetary union were being promised in the last decades but never materialised.
The second regime is the managed float regime used by the remaining countries in the MENA region. In this system countries manage their exchange rates by selling and buying currencies. It could be either managed against a major currency such as the US dollar or the Euro or it can be floated with no major currency to correspond to. Countries that manage to float their currencies to the US dollar include Egypt, Iraq, Kuwait, Libya and Syria. Moreover, countries in North Africa such as Algeria, Morocco and Tunisia manage to float their currencies against the Euro. Yemen and Iran on the other hand are float managed freely without a major currency. The only country in the MENA region with free float exchange rate is Turkey.
Figure 2.2: Annual Inflation for MENA countries
9
Source: IMF
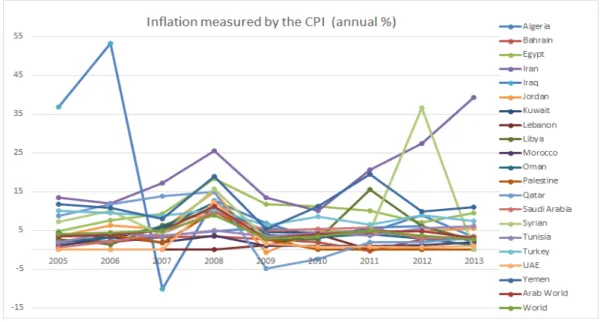
The inflation rate in the MENA countries averaged 6.96% between 2005 and 2013. This is higher than the world for the same period where the average is around
However, the whole world including the MENA region faced soaring inflation rates in the year 2008. This is due to the high fuel prices in 2008 reaching a record peak of 145 in July 2008. The oil prices eventually crashed with the start of the financial crises. In this year the world average inflation was 9.01% and the MENA countries average was above that with a rate of 11.87%. After that, the inflation rates did decrease to stable rates.
Figure 2.2 shows the inflation rates in the countries in the MENA region. It also shows the average inflation in the Arab world which includes the majority of the countries in the MENA region in addition to the World average inflation. The GCC countries in general had a reasonable inflation rate through the last decade with the exception of the year 2008 which we discussed earlier. The average inflation rate for Bahrain, Kuwait, Oman, Saudi Arabia and UAE is below the 5% mark. Qatar is the only country with an average higher than that which is equal to 5.45%. On the other hand Bahrain and UAE did have a low inflation rate of 2.41% and 2.89% respectively.
Additionally, countries in the North Africa region also have an average inflation rate closer to this experienced by the GCC countries and the World. Algeria, Mo-rocco and Tunisia all have an average inflation below the World average of 4.46%. The exception is Egypt who through the last 9 years faced a high inflation rate. How-ever, Morocco had a low inflation rate average at 1.79%.Jordan, Lebanon, Libya, Palestine had an acceptable averages ranging between 2.59% and 5.57%. Also, Turkey faced a high inflation and the average was 8.51% for the last decade.
Countries which faced political uncertainty or sanctions also faced a high inflation rates. These were Iran, Iraq Syria and Yemen. The averages were 19.89% for Iran, 12.92% for Iraq, 10.71% for Syria and 11.84% for Yemen. Iran had faced an extremely high inflation rate for the previous three years. The inflation was 39.27%
in 2013 which is the highest in the last 9 years. Iraq on the other hand had high inflation in the years 2005 to 2007 due to the war. The last reported figure of Inflation for Syria in 2012 was also the highest with a value of 36.70%.
2.3 Financial Background
This section provides an evaluation of the capital markets, the banking system and the Islamic finance. Our focus is to discover the special features of these areas and show how this research would fill the gap in the wider context taking into consider-ation that the region is vital in the advancement and improvement of the financial markets and the Islamic finance. Financial market development is vital to the over-all development of an economy. When the financial system operates effectively it does enhance the availability and transparency of the information. That brings down transaction costs, which would enhance asset allocation and would increase the growth. A Country’s main objective is to boost growth which is the main factor in decreasing poverty.
In this section we discuss the development of the capital markets in MENA coun-tries including stock markets and bond markets. We overview the different mea-sures of development such as size, liquidity. We then discuss the access to finance which is measured by the creditworthiness of borrowers and lowering financing ob-stacles that are facing consumers and businesses. Finally we discuss the financial stability and efficiency of the economies in the MENA countries.
2.3.1 Capital Market
The data in this section is obtained from World Bank data base extracted it from the S&P Emerging market data base. We obtain data to quantify different measures which would help in understanding the developments of the financial sector in the MENA countries. These measures are size and market liquidity. It is worth men-tioning that cross-country comparisons using these measures should be made with
caution as differences in accounting standards could limit their accuracy.
Bond Market
Fixed income market or bond market is one of the bases of the capital markets. However, it is underdeveloped in the MENA countries. Its importance comes from the fact that it does offer the risk free products which are used in the financial market as the measure for setting the prices of other products that have risk in the financial markets. In a recent report by the Bank of International Settlements it is reported that the MENA countries fixed income assets to GDP is equal to 4% only which is considered low in comparison with other regions. For example, the ratio in Asia is around 12%.The majority of the bonds issued in the region are government bonds which represent around 82% of all issues. The reason for that is that bank lending is the dominant source of capital in the region.
Stock Market
We overview the following measures for size which are market cap and number of listed local firms.Then, we explore the market liquidity measures which are the value of shares traded as a percentage of GDP and the value of shares traded as a percentage of market capitalization.
As Figure 2.3 shows, the size of the stock market in the MENA countries varies widely. It also shows the negative effect the 2008 financial crises on the market value of firms.The largest two markets are Saudi Arabia and Turkey with values of $373 billion and $308 billion US dollars respectively. Iran also has a medium sized market with a value of $140 billion and Qatar is $126 billion US dollars. Kuwait, UAE, Egypt and Morocco have a size of $97, $67,$58 and $52 billion dollars.
In addition, the sum of the values of the market capitalization of Jordan, Oman, Bahrain, Lebanon, Tunisia and Palestine is equal to $ 57.9 billion dollars which is less than the size of the capital market of Egypt. Several countries which are facing
(a) Market Capitalization of Listed companies
(b)Total Listed Domestic Companies
Figure 2.3: Capital Market Size Measures
political uncertainty such as Algeria,Iraq, Libya and Syria have no available data. On the other hand Yemen does not have a stock market.
In addition Figure 2.3 shows the number of listed firms in each economy which is also a measure of the size of the capital market. As the Figure demonstrates several countries have an increase in the number of listed firms while others have decreased. For example, Turkey has listed 103 companies since 2005 which equals 25%. On the other hand, Saudi Arabia doubled the number of listed firms in 2005 to
reach 158 firms. Kuwait and Jordan both added 46 and 42 firms to their exchange. However, it is worth noting that both Kuwait and Jordan had a higher number of firms in 2010 but decreased after that due to several companies exiting and mergers and acquisitions of firms. Palestine had a dramatic increase of 50% while Morocco and Qatar increased 30%. Moreover, Oman, Tunisia and UAE also had an increase of around 25% in the listed firms number.
Several countries had a massive decrease in the number of firms listed. For example, Egypt had a substantial decrease due to a restructure of the market. In addition, 40% of the firms that were listed in Iran in 2005 exited. In Bahrain 8.8% and Lebanon 9.5% of firms exited in 2013 in comparison to 2005. Like we mentioned before there is no data available for Algeria,Iraq, Libya and Syria and Yemen.
Market liquidity
The liquidity of the market is the capacity to simply buy and sell securities. Two measures of liquidity are the total value of the shares traded divided by GDP. The second measure is the turnover ratio. Both measures are important to determine the size of the market and the economy as well.
We first start with the turnover ratio. It is calculated by dividing the value of the shares traded by the market capitalization. Figure 2.4 shows the ratio for the coun-tries in the MENA region. We notice that the largest two markets are Saudi Arabia and Turkey. The turnover ratio for Saudi Arabia is 144% and Turkey is 136%. It is worth noting that the ratio for Saudi Arabia was even higher in 2005 at 231%. But the collapse of the market in 2006 did have an effect on the size of the market. After that, we notice that Egypt has a ratio of 37.8% , UAE’s ratio is 25.3% and Kuwait’s ratio is 23.2%. Then, Iran, Oman, Qatar and Tunisia all have a ratio between 17% and 12%. In cintrast, Jordan, Morocco, Lebanon are the economies with a low ratio. Interestingly Bahrain’s ratio is only 1.9%. There is no available data for the rest of
(a)Stock Traded Turnover ratio
(b) Stock Traded Total value
Figure 2.4: Market Liquidity Measures
the countries.
Secondly, the ratio of the stock traded value as a percentage of the GDP. This is a measure of the size of the economy. Again the results of this ratio do complement the turnover ratio. Figure 2.4 illustrates that Saudi Arabia and Turkey are the largest two economies in the MENA region. The third largest economy is Kuwait, and Jordan is the fourth with a ratio of 9%. Qatar and Egypt have a ratio of 7.7% and 8.1% respectively. It is also worth mentioning that the rest of the countries have
a ratio less than 5%. This shows that the countries in the MENA countries have diffrent sizes either using the turnover ratio or the traded stock value to the market capitalization. The economy with the highest growth is Tunisia with a 67% from 2005 to 2012 but Turkey and Iran had a 6% and 3% respectively. All the other countries in the MENA region did have a large decrease in their ratio. The countries with the significant decreases are Jordan and UAE and Palestine.
2.3.2 Access to Finance
(a)ATMs per 100,000 Adults
(b)Comercial Banks Branches per 100,000 adults
The stable financial system characteristics could be making efficient savings and quality investments. Smooth access to banking services lowers the transaction costs and increases reliability. Several measures are used to quantify the finan-cial access which are value of deposits and loans, and outreach indicators which include number of branches and number of cash machines. Another measure is the number of point of sale terminals but data for this indicator is not available and therefore we exclude it. Figure 2.5 shows the number of cash machines (Auto-mated Teller Machines ATMs) per 100,000 adults. It is a computerized device that provides the clients with access to all financial transactions in a public place. The advances of the technology in recent years have allowed customers of banks to do all kinds of transactions through these machines. This increased the importance of their accessibility. The numbers vary in the MENA countries where countries have a significant increase and other countries improve slightly.
Before we discuss the improvement over the last decade it is important to point out that there is a difference between the GCC countries group and the other coun-tries. Average of the number is 53.6, 52.6, 49.1 and 48.9 for Qatar, Kuwait, Saudi Arabia and UAE. Data for Bahrain and Oman is not available but we do expect them to be within this range. After that we notice that Turkey has a close rate to the GCC countries with an average of 45.6. Lebanon, Jordan and Iran all have a rate between 20 and 30. Morocco, Tunisia and Palestine have an average rate of 17.6, 16.6 and 12.5 in that order. Finally, Egypt, Algeria, Libya, Syria, Yemen and Iraq all have a low average below 8 ATMs per 100,000.
The country with the highest improvement is abnormally Iran. The number in-creased from 4.4 in 2005 to 46.1 in 2012 with an increase of 234%. Then, Algeria and Egypt which improved by 138% and 115%. Then Iraq and Syria which im-proved significantly by 114% and 115% respectively. It is worth mentioning that the
improvement in Iraq is due to the redevelopment of Iraq after the war and the case of Syria is due to the fact that they only started operating ATMs in 2002. Yemen also has a high increase of around 137%.
(a)Borrowers from commercial banks
(b Depositors with commercial banks)
Figure 2.6: Depositors and Borrowers from Commercial Banks
Financial inclusion is the supply of financial services for example banking ser-vices to low income and poor people. On the other hand, the opposite is called financial exclusion where the financial services are exclusive to the medium and high income society or the services are expensive and not affordable by the low