On: 06 February 2013, At: 08:38 Publisher: Routledge
Informa Ltd Registered in England and Wales Registered Number: 1072954 Registered office: Mortimer House, 37-41 Mortimer Street, London W1T 3JH, UK
European Accounting Review
Publication details, including instructions for authors and subscription information:http://www.tandfonline.com/loi/rear20
The Basu Measure as an
Indicator of Conditional
Conservatism: Evidence from UK
Earnings Components
Audrey Hsu a , John O'Hanlon b & Ken Peasnell b a
National Taiwan University, Taipei, Taiwan b
Department of Accounting and Finance, Lancaster University Management School, Lancaster University, Lancaster, UK
Version of record first published: 28 Feb 2011.
To cite this article: Audrey Hsu , John O'Hanlon & Ken Peasnell (2012): The Basu Measure as an Indicator of Conditional Conservatism: Evidence from UK Earnings Components, European Accounting Review, 21:1, 87-113
To link to this article: http://dx.doi.org/10.1080/09638180.2011.558296
PLEASE SCROLL DOWN FOR ARTICLE
Full terms and conditions of use: http://www.tandfonline.com/page/terms-and-conditions
This article may be used for research, teaching, and private study purposes. Any substantial or systematic reproduction, redistribution, reselling, loan, sub-licensing, systematic supply, or distribution in any form to anyone is expressly forbidden.
The publisher does not give any warranty express or implied or make any representation that the contents will be complete or accurate or up to date. The accuracy of any instructions, formulae, and drug doses should be independently verified with primary sources. The publisher shall not be liable for any loss, actions, claims, proceedings, demand, or costs or damages
with or arising out of the use of this material.
The Basu Measure as an Indicator of
Conditional Conservatism: Evidence
from UK Earnings Components
AUDREY HSU∗, JOHN O’HANLON∗∗ and KEN PEASNELL∗∗ ∗National Taiwan University, Taipei, Taiwan and∗ ∗Department of Accounting and Finance,
Lancaster University Management School, Lancaster University, Lancaster, UK
(Received: April 2010; accepted December 2010)
ABSTRACT Following the work of Basu in 1997, the excess of the sensitivity of accounting earnings to negative share return over its sensitivity to positive share return (the Basu coefficient) has been interpreted as an indicator of conditional accounting conservatism. Although this interpretation is supported by substantial evidence that the Basu coefficient is associated with likely demands for conservatism, concerns have arisen that it may reflect factors not directly related to conservatism, and that this may adversely affect its validity as an indicator of that phenomenon. We argue that evidence on the validity of the Basu coefficient as an indicator of conditional conservatism can be obtained by disaggregating earnings into components, classifying those components by whether or not they are likely to be affected by conditional conservatism, and examining whether the Basu coefficient arises primarily from components likely to be affected by conditional conservatism. We implement this procedure for UK firms reporting underFRS 3: Reporting Financial Performancefrom 1992 to 2004. Although a substantial proportion of the Basu coefficient emanates from cash flow from operating and investing activities (CFOI), which cannot directly reflect accounting conservatism, its incidence across other components of earnings is predominantly within those components likely to be affected by conditional conservatism. Also, although the bias documented by Patatoukas and Thomas in 2009 is present in all of our aggregate earnings measures, it is heavily concentrated in the CFOI component of earnings and largely absent from components classified as likely to be affected by conditional conservatism. With the important caveat that researchers should test the robustness of their results to the exclusion of the element of the Basu coefficient due to cash flows, our findings are consistent with the conditional conservatism interpretation of the coefficient. Vol. 21, No. 1, 87 – 113, 2012
Correspondence Address:John O’Hanlon, Department of Accounting and Finance, Lancaster University Management School, Lancaster University, Lancaster LA1 4YX, UK. Email: [email protected] Paper accepted by Salvador Carmona.
Vol. 21, No. 1, 87 – 113, 2012
0963-8180 Print/1468-4497 Online/12/010087– 28#2012 European Accounting Association
http://dx.doi.org/10.1080/09638180.2011.558296
Published by Routledge Journals, Taylor & Francis Ltd on behalf of the EAA.
1. Introduction
Basu (1997) defines accounting conservatism as a tendency on the part of accoun-tants ‘to require a higher degree of verification for recognizing good news than bad news in financial statements’ (p. 4), resulting in accounting earnings being more timely in its recognition of bad news than in its recognition of good news. This news-dependent conservatism that gives rise to asymmetric timeliness in earnings is sometimes termed ‘conditional conservatism’ (Beaver and Ryan, 2005). Basu (1997) proposes as an indicator of conditional conservatism the excess of the sen-sitivity of earnings to contemporaneous negative share return, indicative of bad news, over its sensitivity to contemporaneous positive share return, indicative of good news. Here, we term this excess ‘the Basu coefficient’. Many studies have reported that the Basu coefficient is associated with contracting-cost-related items and other items predicted to be associated with conditional conservatism, consistent with it being a reliable indicator of that phenomenon (Pope and
Walker, 1999; Ballet al., 2000, 2008a, 2008b; Givoly and Hayn, 2000; Sivakumar
and Waymire, 2003; Beekes et al., 2004; Krishnan, 2005; Pae et al., 2005;
Bushman and Piotroski, 2006; Lobo and Zhou, 2006; Ahmed and Duellman,
2007; Roychowdhury and Watts, 2007; Beatty et al., 2008; LaFond and
Roychowdhury, 2008; LaFond and Watts, 2008; Zhang, 2008). However, there are grounds to question the conditional conservatism interpretation of the Basu
coefficient. Dietrichet al.(2007) argue that partitioning share-return and earnings
data by the sign of share return can give a positive Basu coefficient even in the absence of accounting conservatism. Patatoukas and Thomas (2009) report that association between return volatility and the probability of a loss can cause a bias in the Basu coefficient large enough to induce an apparent sensitivity differ-ence for lagged earnings with respect to return, which cannot be due to conditional
conservatism. Givolyet al.(2007) suggest that the Basu coefficient is sensitive to
factors such as clustering of news, the nature of economic events and firms’ dis-closure policies. The positive sensitivity difference for operating cash flow with
respect to return, reported by Basu (1997), Ballet al.(2000) and Dietrichet al.
(2007), also suggests that the Basu coefficient may be due to factors other than con-servatism. There have been a number of responses to critiques of the conditional
conservatism interpretation of the coefficient. Ballet al.(2010) analyse
econo-metric properties of the coefficient in light of the properties of accounting and conclude that the coefficient is a valid indicator of conditional conservatism. They also observe that managers’ remedial response to bad news might cause asymmetry in the sensitivity of cash flow to bad news and good news; such asym-metry would not be directly due to accounting conservatism. Ryan (2006) observes that the study of conditional conservatism requires a measure of asymmetric timeliness of earnings and that, despite possible faults, the Basu coefficient is a dominant candidate for such a measure. He calls for researchers to synthesise the Basu measure of conditional conservatism with their knowledge of its limit-ations. In summary, there is extensive evidence consistent with the conditional
conservatism interpretation of the Basu coefficient, there is some cause for concern with regard to this interpretation, and there is reason for researchers of conserva-tism to persevere with the Basu coefficient, with due recognition of its limitations. In this study, we argue that evidence on the validity of the Basu coefficient as an indicator of conditional conservatism can be obtained by disaggregating earn-ings into its components, classifying those components by reference to account-ing regulation and practice into those that are likely to be affected by conditional conservatism and those that are not, and examining whether the Basu coefficient arises primarily from components likely to be affected by conditional conserva-tism. If the Basu coefficient arises primarily from earnings components likely to be affected by conditional conservatism, this would represent evidence in support of the conditional conservatism interpretation of the coefficient. If it arises from earnings components independently of whether they are likely to be affected by conditional conservatism or only (or mostly) from components unlikely to be affected, this would cast further doubt on the conditional conservatism
inter-pretation of the coefficient.1Although our procedure involves some subjectivity
in classification of earnings components by whether they are likely to be affected by conditional conservatism, our detailed reference to accounting regulation and practice significantly limits the degree of subjectivity involved.
We implement this procedure for a sample of UK firms from 1992 to 2004, which
is the interval during whichFRS 3: Reporting Financial Performance(ASB, 1992)
was in force. In our data, a large proportion of the Basu coefficient arises from cash flow from operating and investing activities (CFOI), which could reflect asymmetry in response of cash flow to bad news and good news but cannot directly reflect con-ditional conservatism. However, for components of earnings other than CFOI, the incidence of the sensitivity difference in our data is predominantly consistent with a conditional conservatism interpretation. Also, although the bias documented by Patatoukas and Thomas (2009) is present in all of our aggregate earnings measures, it is heavily concentrated in the CFOI component of earnings and largely absent from components classified as likely to be affected by conditional conservatism. With the important caveat that researchers should test the robustness of their results to the exclusion of the element of the Basu coefficient due to cash flows, our findings are consistent with the conditional conservatism interpretation of the coefficient.
The remainder of this study is organised as follows. Section 2 describes the earnings components considered, and states our beliefs with regard to whether or not individual earnings components are likely to be affected by conditional conservatism. Section 3 describes the sensitivity-difference measure used in the analysis. Section 4 describes the sample and data. Section 5 reports the results. Section 6 concludes.
2. Decomposition of the Basu Coefficient: Earnings Components
In this section, on the basis of a review of UK accounting regulation and practice for years from 1992 to 2004, we classify UK earnings components during that
interval into items that are likely or not likely to be affected by conditional
conservatism.2 The interval from 1992 to 2004, during which FRS 3 was in
force, provides a relatively stable income-reporting regime, with a relatively rich and transparent disclosure of income components that were well documented
by a major financial database.3
In Section 2.1 we provide an overview of UK earnings components reported
underFRS 3from 1992 to 2004, and give details of our decomposition of
earn-ings. In Section 2.2, we state our expectations with regard to which components are likely or not likely to be affected by conditional conservatism.
2.1. Earnings Components under FRS 3: Reporting Financial Performance FRS 3required firms to report operating profit, to include the separately disclosed results of continuing operations, acquisitions and discontinued operations (para-graph 14). The following three items, classified as ‘Special Items’ by Datastream, were reported separately in the income statement as exceptional items outside operating profit (paragraphs 19 and 20): (i) profits or losses on the sale or termin-ation of an opertermin-ation; (ii) costs of fundamental reorganistermin-ation or restructuring having a material effect on operations; (iii) profits or losses on disposal of fixed assets. Other exceptional items were reported under the headings to
which they related (paragraph 19), which could include ‘operating profit’.FRS
3defined ‘extraordinary items’ as relating to ‘highly abnormal events or
trans-actions that fall outside the ordinary activities of a reporting entity and which are not expected to recur’ (paragraph 48). Such items were expected to be of extreme rarity, and no examples were given in the standard. The standard intro-duced a requirement for a Reconciliation of Movements in Shareholders’ Funds, nested within which was a Statement of Recognized Gains and Losses (para-graphs 56 – 59). Taken together, these two statements reflected all movements in shareholders’ funds. These included accounting gains and losses not reported within net income, termed ‘dirty surplus flows’ in this study. The principal dirty surplus flows were as follows: prior-period adjustments; foreign-currency trans-lation differences; revaluation gains and losses; goodwill write-offs (net of
good-will written back on disposals), until the elimination byFRS 10: Goodwill and
Intangible Assets (ASB, 1997) for accounting periods ending on or after 23 December 1998 of the write-off to equity of goodwill; actuarial gains and
losses recognised in respect of pension schemes after FRS 17: Retirement
Benefits (ASB, 2000a), for which adoption became mandatory for accounting periods ending on or after 22 June 2003. Items reported as dirty surplus flows
under FRS 3also included various unusual items, including items described in
the financial statements as ‘other’ or similar.
Our decomposition of earnings is based on earnings components reported
under FRS 3 and some cash-flow components reported under FRS 1: Cash
Flow Statements(ASB, 1991), as reported by Datastream. Our classification of earnings components by reference to whether they are likely to be affected by
conditional conservatism is based on our review of accounting regulation and practice, and not on whether the components are likely to be subject to contract-ing-related demand for conditional conservatism. Therefore, we do not limit our analysis to earnings components likely to be the focus of such contracting-related demands. Our decomposition is with respect to clean surplus earnings, which comprises all recognised gains and losses. Periodic clean surplus earnings is defined as follows (firm subscripts are suppressed):
CSEt=Bt−Bt−1+Dt−Nt (1a)
whereCSEtis clean surplus earnings for periodt,BtandBt−1are the book value
of equity shareholders’ funds at the end of periodtand periodt−1, respectively,
DtandNtare distributions to shareholders and share issues, respectively, reported
as movements in shareholders’ funds in the financial statements in periodt.4Our
decomposition of earnings is described in (1b). For each item, the notation used in some tables is given in parentheses (firm and time subscripts are suppressed):
Cash flow from operating and investing activities (CFOI)(CFOI)
+Investing accruals (including depreciation)(IA)
+Change in accounts receivable(DAR)
+Change in inventory (DInv)
+ (−Change in accounts payable (DAP))
+Other operating accruals(OOA)
=Operating profit(OP)
+Special and other non-operating items (Special+ONO)
+Interest income less interest expense(Int)
=Pre-tax income(Pretax)
+ (−Taxation(Tax))
=Post-tax income(Posttax)
+Extraordinary items (Extra)
+ (−Minority interest and preference dividends(Minpref))
=Net income(Netinc)
+Dirty surplus flows: prior-period adjustment (PPA)
+Dirty surplus flows: foreign-currency translation adjustment(FCT)
+Dirty surplus flows: revaluation gains and losses(Rev)
+ (−Dirty surplus flows: goodwill written off to equity,
net of goodwill written back on disposals (GW))
+Dirty surplus flows: other dirty surplus flows(ODSF)
=Clean surplus earnings(CSE). (1b)
Because of the possibility that cash flow from operations might be affected by conservatism-related accounting choices with regard to the categorisation of expenditures as ‘operating’ or ‘investing’, our cash-flow measure is CFOI rather than cash flow from operations. We therefore include in our decomposition a measure of investing accruals that comprises both depreciation and the capitalisation of fixed assets and intangibles.
The return measure used in this study articulates with the distributions and share issues reported as movements in shareholders’ funds in the financial state-ments, and is defined as follows:
Rit=
Vit−Vi,t−1+Dit−Nit
Vi,t−1
(2)
whereRitis the share return for firmifor the accounting period ended at timet,Vit
(Vi,t−1) is the market value of equity shareholders’ funds of firmiat the end of
accounting period t (t−1), and Dit and Nit are distributions to shareholders
and share issues, respectively, as previously defined. In order to ensure consist-ency with the book value of equity shareholders’ funds, the market value of equity shareholders’ funds is stated net of the creditor for equity shareholders’ dividends in the corresponding balance sheet.
2.2. Expectations Regarding Conditional-Conservatism-Induced Asymmetric Timeliness in Earnings Components
Throughout the interval covered by this study, the prudence concept was
expli-citly recognised in UK GAAP. SSAP 2: Disclosure of Accounting Policies
(ASC, 1971) gave it the status of a ‘fundamental accounting concept’, and required that ‘provision is made for all known liabilities (expenses and losses) whether the amount of these is known with certainty or is a best estimate in the light of the information available’ (part 2, paragraph (d)). For accounting
periods ending on or after 22 June 2001, SSAP 2 was superseded by FRS 18:
Accounting Policies(ASB, 2000b). This reflected some evolution in the prudence concept, with a move to restrict the deliberate understatement of assets and gains and the deliberate overstatement of liabilities and losses. This evolution of the
prudence concept had already been reflected in the previously issuedStatement
of Principles for Financial Reporting (ASB, 1999b), of which an exposure
draft had initially been issued in 1995, in FRS 3, which restricted provisions
arising on termination of operations to cases where obligations had been incurred,
and inFRS 12: Provisions, Contingent Liabilities and Contingent Assets(ASB,
1998), which prohibited the recognition of provisions other than for a present obligation as a result of a past event. In summary, the concept of prudence was explicitly embedded within UK GAAP for the interval covered by this study, although the interval saw a process of evolution in the concept aimed at restricting the opportunities for earnings management.
We now identify those earnings components that we believe likely to be affected by the conditional conservatism that the Basu coefficient is convention-ally aimed to detect, and those that we believe are not likely to be affected. Our earnings decomposition in (1b) includes five earnings measures: operating profit, pre-tax income, post-tax income, net income and clean surplus earnings. These earnings measures themselves are not the focus of this study, and are not dealt with below, but the results of prior research suggest that positive Basu coeffi-cients will be observed for these five earnings measures. Also, since taxation is determined largely by pre-tax income, we do not consider this item, but expect to observe a Basu coefficient of opposite sign to that observed for pre-tax income. For a similar reason, in that part of the item is associated with an element of post-tax income, we do not consider minority interest and preference dividends.
We list below the earnings components that we classify as likely to be affected by conditional-conservatism-induced asymmetric timeliness, giving our reason-ing in each case.
. Investing accruals (including depreciation). FRS 15: Tangible Fixed Assets
(ASB, 1999a, paragraphs 34 – 41) provides some scope for managerial judge-ment with regard to the categorisation of outflows as expenses or as additions to fixed assets, particularly where items might be expensed as ‘repairs and maintenance’ or capitalised as ‘enhancements’. Also, there is scope for revi-sions in estimates of the useful economic life and residual value of fixed
assets to be reflected in depreciation charges.5
. Change in accounts receivable. Accounts receivable are subject to provisions that can reduce their book value to below initial carrying value, but they cannot be written up to above their initial carrying value.
. Change in inventory. SSAP 9: Stocks and Long-Term Contracts(ASC, 1975), which was in force throughout the interval examined, required that inventory should normally be stated at the lower of cost and net realisable value (para-graph 26). Profit could only be taken on long-term contracts where there was reasonable certainty about the outcome (paragraph 29). Under this regime, inventories are more likely to be written down in response to bad news than to be written up in response to good news.
. Other operating accruals. This component includes all operating accruals other than depreciation and changes in receivables, inventories and accounts payable. It mainly comprises items arising from litigation, impairments, dispo-sals and non-fundamental reorganisation, reported as exceptional items within operating profit. Timely recognition of losses in respect of such items, together with the limited scope for the recognition of corresponding gains, is one of the most likely sources of conditional conservatism.
. Special and other non-operating items. This component includes items relating to termination and reorganisation of operations and disposal of fixed assets,
required by FRS 3 to be reported as exceptional items outside operating
profit and reported as ‘Special Items’ by Datastream, plus other non-operating items including items of an exceptional nature and the share of results of associated companies and joint ventures. Although UK accounting standards aimed to restrict over-provisioning for exceptional losses, the prudence
con-siderations reflected inSSAP 2andFRS 18would still have induced a tendency
to recognise losses in a more timely fashion than gains in respect of such
items.6
. Revaluation gains and losses. For accounting periods ending on or after 23
March 2000, asset revaluations in the UK were governed by FRS 15, which
codified much of pre-existing practice with regard to revaluation. Throughout the interval covered by this study, revaluation gains and revaluation losses, to the extent that the losses were reversals of previously recognised revaluation gains, were recognised as dirty surplus flows in the Statement of Recognized Gains and Losses. In light of the prudence concept, there is scope for asym-metric timeliness in the recognition of gains and losses.
. Goodwill. During the first half of the interval covered by this study, until the
introduction in 1998 ofFRS 10, the vast majority of UK firms wrote off
pur-chased goodwill directly to equity. Subsequent toFRS 10, direct write-off to
equity was prohibited, and this component comprised only the write-back on disposal of goodwill previously written off to equity. Scope existed for man-agerial judgement with respect to the value to be attributed to the net assets of acquired subsidiaries, and therefore with respect to the component of the purchase price of subsidiaries to be written off as goodwill.
As some of the items listed above are more likely than others to be affected by conditional conservatism, it is helpful to provide some indication of the rank ordering of the items by their likelihood of being affected by conditional conser-vatism. Because they include exceptional items, the components termed ‘other operating accruals’ and ‘special and other non-operating items’ are the most likely items to be affected, and we rank them first equal. Because of the relative significance of the items and the subjectivity involved in valuing them, we rank third equal the change in accounts receivable and the change in inventory. We rank investing accruals fifth. We rank sixth equal the dirty-surplus-flow items: revaluation gains and losses and goodwill.
We now list the earnings components believed not likely to be affected by conditional conservatism.
. CFOI. Our measure of this item is equal to operating cash flow less net cash
outflows on fixed assets and intangible assets, reported in theFRS 1statement
of cash flows. This item is free of any conservatism effect arising from the categorisation of expenditures as ‘operating’ or ‘investing’.
. Change in accounts payable. Accounts payable are not written up (written down) in response to bad (good) news.
. Interest income less interest expense. Conditional conservatism could arise in
respect of this item if gearing and/or the interest income and cost reflected in
the income statement respond contemporaneously to news, and the responses to bad news and good news are asymmetric. There is some possibility of this. However, it takes some time for gearing levels to adapt to changing circum-stances, and there are constraints on the extent to which accounting income can reflect contemporaneous changes in yields.
. Extraordinary items. As defined in the UK prior toFRS 3and as defined in some other regimes, this item would be one of the most likely sources of conditional
conservatism. However,FRS 3introduced an extremely restrictive definition
of ‘extraordinary items’, limiting the category to highly abnormal events or
transactions of extreme rarity outside the ordinary activities of the firm.7
. Prior-period adjustment. FRS 3 defined prior-period adjustments very restric-tively such that they ‘are rare and limited to items arising from changes in accounting policies or from the correction of fundamental errors’ and, importantly, excluded adjustments to estimates made in prior periods (paragraph 60). Although prior-year adjustments relating to changes in accounting policies might provide a route by which conditional conservatism might affect this category, such items were predominantly mandated by changes in accounting standards. . Foreign-currency translation difference. This item arises through changes in
the reporting-currency value of currencies in which subsidiaries prepare their financial statements, and its effect is primarily with respect to the opening balance sheet of those subsidiaries.
. Other dirty surplus flows. This category includes sundry items of which we traced a sample to the financial statements. On the basis of our selective inspec-tion of items in this category, we do not believe that it likely to be affected by conditional conservatism.
3. The Sensitivity-Difference Measure Used in this Study
We measure sensitivity differences for our earnings measures and our earnings components using regression model (3), due to Basu (1997):
Xit=a1+a2DUMit+b1Rit+b2Rit×DUMit+1it (3)
where Xit is an earnings measure or an earnings component for firm i for the
accounting period ended at timet, scaled by beginning-of-period market value,
Rit is the share return for firmifor the accounting period ended at timetas
pre-viously defined, DUMit is a dummy variable that takes the value of one where
Ritis negative, and zero otherwise, theaandbterms are regression coefficients,
and1it is the error term. In (3), the focus of interest isb2. This is the excess of
the sensitivity of earnings or of an earnings component to negative contempora-neous share returns over its sensitivity to positive contemporacontempora-neous share
returns. WhereXitis an earnings measure,b2is the Basu coefficient. A significant
positive value for b2 for an earnings measure is conventionally interpreted as evidence of conditional-conservatism-induced asymmetric timeliness in that
earn-ings measure. WhereXitis an earnings component,b2is the sensitivity difference
for that component. Because the explanatory variables in model (3) are the same for all earnings measures and components thereof and because the components of each earnings measure add up to that earnings measure, the sum of the sensitivity differences for all components of an earnings measure is equal to the Basu coeffi-cient for that earnings measure. This adding-up feature facilitates analysis of the contribution of earnings components to the aggregate Basu coefficient. Regression model (3) is estimated using pooled cross-sectional and time-series data from 1992
to 2004. Following Petersen (2008) and Gowet al.(2009), test statistics are based
on standard errors that allow for clustering both by firm and by time.
4. Decomposition of the Basu Coefficient: Sample and Data
Our data are drawn from the universe of quoted UK industrial firms that reported
in accordance withFRS 3at any time from 1992 to 2004. Our sample construction
is summarised in Table 1 panel A. From Datastream, we collect data for 12,250 firm-years for which there is a complete set of the required balance-sheet,
income-statement and cash-flow-statement items.8We investigate by reference
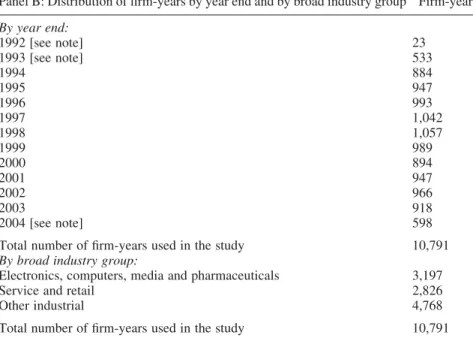
to published financial statements all firm-year cases in which the absolute value of shareholder-fund movements not clearly identified by Datastream exceeds 1% of the absolute value of beginning-of-period shareholders’ funds. All items investigated are assigned to an appropriate category of clean surplus earnings or categorised as an issue or distribution of equity capital. In 453 cases, data limit-ations prevent us from classifying movements that are greater than 1% of opening shareholders’ funds, and these cases are eliminated. Unidentified items of less than 1% of opening shareholders’ funds that are not individually investigated are treated as either prior-period adjustments or other dirty surplus flows, depend-ing on how they arise. Furthermore, in order to avoid the effect of hidden dirty surplus flows arising from merger accounting (pooling-of-interests accounting), the few firms within our sample that engaged in merger accounting are eliminated. This results in the loss of 138 firm-year cases. We delete as outliers 868 firm-year cases for which share return or any accounting data item as scaled by beginning-of-period market value falls within the most extreme 1% of the distribution. These procedures leave 10,791 firm-year cases. The distribution of data by years from 1992 to 2004 is given in Table 1 panel B. This panel also gives details of the distribution of our data-set by broad industry category.
Details of the Datastream data items used to construct the earnings components and other variables in our data-set are given in Table 2. For CFOI, investing accruals (including depreciation), change in accounts receivable, change in inventory and change in accounts payable, the data items are as reported in the Statement of Cash Flows. We define ‘other operating accruals’ as the element of the difference between operating profit and reported operating cash
flow not accounted for by above-mentioned categories of operating accruals. This largely comprises items reported as exceptional items within operating profit. We define ‘special and other non-operating items’ as the element of the difference between pre-tax income and operating profit not accounted for by interest
Table 1. Sample
Panel A: Data collection Firm-years Firm-years reporting earnings components underFRS 3: Reporting
Financial Performancefrom 1992 to 2004 for which the required data were available in Datastream.
12,250
Less: firm-years for which data limitations prevent classification of items making up more than 1% of the periodic change in the Datastream-reported book value of shareholders’ funds.
(453)
Less: firm-years eliminated due to the use of merger accounting (pooling of interests accounting).
(138) 11,659 Less: firm-years deleted as outliers (cases for which share return or any
accounting data item as scaled by beginning-of-period market value falls within the most extreme 1% of the distribution).
(868)
Total number of firm-years used in the study 10,791 Panel B: Distribution of firm-years by year end and by broad industry group Firm-years
By year end: 1992 [see note] 23 1993 [see note] 533 1994 884 1995 947 1996 993 1997 1,042 1998 1,057 1999 989 2000 894 2001 947 2002 966 2003 918 2004 [see note] 598
Total number of firm-years used in the study 10,791
By broad industry group:
Electronics, computers, media and pharmaceuticals 3,197
Service and retail 2,826
Other industrial 4,768
Total number of firm-years used in the study 10,791
Note:In order for a firm-year to be included in our data, the financial statements had to be prepared in accordance withFRS 3: Reporting Financial Performance. This standard became mandatory for UK listed firms for accounting periods ending on or after 22 June 1993, so the number of firm-year cases in our data is fewer for 1993 than for subsequent years. A few firms adopted the standard for their 1992 year end. The discontinuation by Datastream of the accounting data series used for this study resulted in the availability of fewer firm-years for 2004 than for previous years.
Table 2. Variables and data items
Variables Datastream data items Cash flow from operating and investing
activities (CFOI) (CFOI)
DS10152DS10262DS1029 Investing accruals (including
depreciation) (IA)
DS1026+DS10292DS976 Change in accounts receivable (DAR) DS448
Change in inventory (DInv) DS445
2Change in accounts payable (DAP) 2DS417
Other operating accruals (OOA) (DS9932DS1015)2(DS448 +DS4452DS4172DS976) Operating profit (OP) DS993
Special and other non-operating items (Special+ONO)
DS1542(DS993+DS2408) Interest income less interest expense (Int) DS2408
Pre-tax income (Pretax) DS154
2Taxation (Tax) 2DS203 Post-tax income (Posttax) DS623 Extraordinary items (Extra) DS193
2Minority interest and preference dividends (Minpref)
2(DS176+DS181) Net income (Netinc) DS1087
Dirty surplus flows (DSF):
¼prior-period adjustment (PPA) ¼DS1106 less prior-period DS1107 (as adjusted after investigation of significant
differences between opening shareholders’ funds and prior-period closing shareholders’ funds reported by Datastream)
+foreign-currency translation difference (FCT)
+DS1098 +revaluation gains and losses (Rev) +DS1099
2goodwill write-offs (GW) 2(DS11022DS1103) +other dirty surplus flows (ODSF) +(DS1100+DS1104)
(as adjusted after investigation of cases where movements in shareholders’ funds reported by Datastream did not add to the
Datastream-reported change in
shareholders’ funds or where Datastream classified items as ‘other changes in shareholders’ funds’)
Clean surplus earnings (CSE¼Netinc
+DSF)
DS1087+DSF
Market value of shareholders’ funds (V) DSHMV2DS382 Dividends net of capital issues (D-N) DS1872DS1101
(Continued)
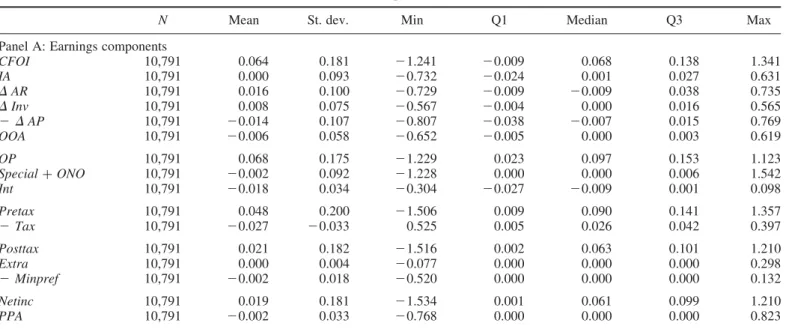
income less interest expense. This includes the items classified as ‘Special Items’ by Datastream (DS1083), other non-operating items of an exceptional nature and other non-operating items. Table 3 reports descriptive statistics for earnings components and share returns. With the exception of extraordinary items, for which there are only nine non-zero cases, all earnings components listed in Table 3 have more than one thousand non-zero cases.
Table 2.Continued
Variables Datastream data items Share return, before scaling
(Vt−Vt−1) + (Dt−Nt)
D(DSHMV2DS382)+(DS1872DS1101) (Note: Market value of shareholders’ funds is stated net of the dividend creditor (DS382))
Note:All movements in shareholders’ funds are categorised as either a component of clean surplus earnings or as a transaction with shareholders (distribution or issue of capital). Datastream data items are as follows, as described in the Datastream documentation:
† DS154 Pre-tax profit
† DS176 Minority interests
† DS181 Preference dividend for period
† DS187 Ordinary dividends
† DS193 Extraordinary items
† DS203 Total tax charge
† DS382 Dividends payable
† DS417 Change in creditors (as reported in Statement of Cash Flows)
† DS445 Change in stocks and work in progress (as reported in Statement of Cash Flows)
† DS448 Change in debtors (as reported in Statement of Cash Flows)
† DS623 Published after-tax profit
† DS976 Total depreciation and amortisation of fixed assets (as reported in Statement of Cash Flows)
† DS993 Operating profit
† DS1015 Cash inflow2operating activities (as reported in Statement of Cash Flows)
† DS1026 Net payments for fixed assets (as reported in Statement of Cash Flows)
† DS1029 Net payments for intangibles (as reported in Statement of Cash Flows)
† DS1087 Profit for financial year
† DS1098 Currency translation difference
† DS1099 Revaluation adjustments
† DS1100 Other recognised gains/losses for the year
† DS1101 Capital issues
† DS1102 Goodwill on acquisitions
† DS1103 Goodwill on disposals
† DS1104 Other changes in shareholders’ funds
† DS1106 Opening shareholders’ funds
† DS1107 Closing shareholders’ funds
† DS2408 Net interest charges (multiplied by21 to give interest income less interest expense)
† DSHMV Market value of shareholders’ equity.
We define ‘other operating accruals’ as the element of the difference between operating profit and reported operating cash flow not accounted for by other categories of operating accruals. This largely comprises items reported as exceptional items within operating profit. We define ‘special and other non-operating items’ as the element of the difference between pre-tax income and operating profit not accounted for by interest income less interest expense. This includes the items classified as ‘Special Items’ by Datastream (DS1083), other operating items of an exceptional nature and other non-operating items.
Table 3. Descriptive statistics
N Mean St. dev. Min Q1 Median Q3 Max
Panel A: Earnings components
CFOI 10,791 0.064 0.181 21.241 20.009 0.068 0.138 1.341 IA 10,791 0.000 0.093 20.732 20.024 0.001 0.027 0.631 DAR 10,791 0.016 0.100 20.729 20.009 20.009 0.038 0.735 DInv 10,791 0.008 0.075 20.567 20.004 0.000 0.016 0.565 2DAP 10,791 20.014 0.107 20.807 20.038 20.007 0.015 0.769 OOA 10,791 20.006 0.058 20.652 20.005 0.000 0.003 0.619 OP 10,791 0.068 0.175 21.229 0.023 0.097 0.153 1.123 Special+ONO 10,791 20.002 0.092 21.228 0.000 0.000 0.006 1.542 Int 10,791 20.018 0.034 20.304 20.027 20.009 0.001 0.098 Pretax 10,791 0.048 0.200 21.506 0.009 0.090 0.141 1.357 2Tax 10,791 20.027 20.033 0.525 0.005 0.026 0.042 0.397 Posttax 10,791 0.021 0.182 21.516 0.002 0.063 0.101 1.210 Extra 10,791 0.000 0.004 20.077 0.000 0.000 0.000 0.298 2Minpref 10,791 20.002 0.018 20.520 0.000 0.000 0.000 0.132 Netinc 10,791 0.019 0.181 21.534 0.001 0.061 0.099 1.210 PPA 10,791 20.002 0.033 20.768 0.000 0.000 0.000 0.823 A. Hsu et al.
2GW 10,791 20.011 0.126 21.933 0.000 0.000 0.000 1.674
ODSF 10,791 0.000 0.012 20.416 0.000 0.000 0.000 0.318
CSE 10,791 0.006 0.201 22.032 20.030 0.047 0.093 1.693
Panel B: Share returns
Return (R),0 4,854 230.6% 22.6% 289.8% 245.3% 226.1% 212.0% 0.0%
Return (R).0 5,937 49.7% 57.1% 0.0% 14.1% 32.3% 62.9% 451.2%
Return (R) all cases 10,791 13.6% 60.1% 289.8% 222.8% 4.9% 36.3% 451.2%
Notes: a
Data are for UK industrial firms from 1992 to 2004, as reported underFRS 3: Reporting Financial Performance.
b
All earnings components are scaled by beginning-of-period market value of equity shareholders’ funds.
c
CFOIis cash flow from operating and investing activities (CFOI),IA is investing accruals (comprising net payments for fixed assets and intangibles less depreciation),DARis change in accounts receivable,DInvis change in inventories,DAPis change in accounts payable (descriptive statistics are for change in accounts payable times21),OOAis other operating accruals,OPis operating profit,Special+ONOis special and other non-operating items,Intis interest income less interest expense,Pretaxis pre-tax income,Taxis taxation (descriptive statistics are for taxation times21),Posttaxis post-tax income,Extrais extraordinary items,Minprefis minority interest and preference dividends (descriptive statistics are for minority interest and preference dividends times21),
Netincis net income,PPAis prior-period adjustment,FCTis foreign-currency translation difference,Revis revaluation gains and losses,GWis goodwill
write-off less write-back (descriptive statistics are for goodwill write-write-off less write-back times21),ODSFis other dirty surplus flows,CSEis clean surplus earnings.
The Basu M easure as an Indicator of Conditional Conserv atism 101
5. Decomposition of the Basu Coefficient: Results 5.1. Main Results
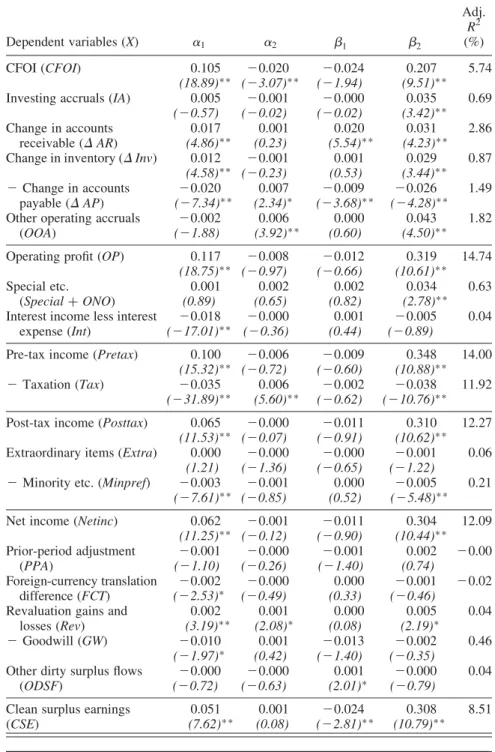
Table 4 reports results from the standard Basu (1997) regression model (3) for clean surplus earnings and its components. All components for which a positive value reduces earnings (change in accounts payable, taxation, minority interest
and preference dividends and goodwill write-offs) are multiplied by 21, so the
reported regression coefficients for all components add to the corresponding coefficients for relevant earnings measures. Table 5 summarises whether the results in Table 4 are consistent with the conditional conservatism interpretation of the Basu coefficient. In Table 5, the items classified as likely to be affected by conditional conservatism are listed in rank order by reference to our judgement as to their likelihood of being affected.
The results reported in Table 4 for aggregate earnings measures are consistent
with those of prior studies. The Basu coefficient (b2) from model (3) is positive
and significantly different from zero for all of the earnings measures (operating profit, pre-tax income, post-tax income, net income and clean surplus earnings),
with thet-statistics for theseb2coefficients all being in excess of 10. A similar
result, of opposite sign, is reported for taxation, which is highly negatively cor-related with pre-tax income, and for minority interest and preference dividends, which contains an element that is negatively correlated with post-tax income.
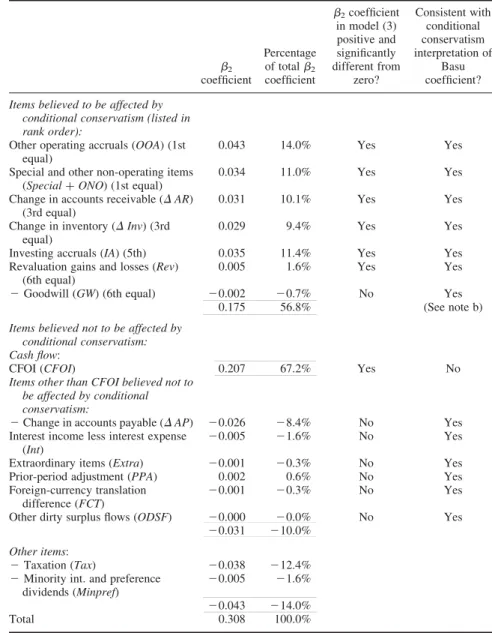
For the seven items believed to be affected by conditional-conservatism-induced asymmetric timeliness, the Basu coefficient is positive and significantly
different from zero in six cases: investing accruals (b2: 0.035,t-statistic: 3.42);
change in accounts receivable (b2: 0.031,t-statistic: 4.23); change in inventory
(b2: 0.029, t-statistic: 3.44); other operating accruals (b2: 0.043, t-statistic:
4.50); special and other non-operating items (b2: 0.034,t-statistic: 2.78);
revalua-tion gains and losses (b2: 0.005,t-statistic: 2.19). The only one of these seven
items for which the sensitivity difference is not positive and significantly
differ-ent from zero is goodwill (b2:20.002,t-statistic:20.35). However, there was a
major change in the treatment of this item from 1998, whenFRS 10prohibited the
previously predominant practice of writing off goodwill to equity; from 1998 this item comprised only write-backs on disposal of previously written off goodwill. We therefore estimate model (3) for goodwill separately for the intervals before
and after the change. We find that theb2coefficient for goodwill is positive and
significantly different from zero for 1992 – 97 but not for 1998 – 2004. In Table 5, we therefore interpret the result for this item as consistent with the conditional conservatism interpretation of the Basu coefficient. Therefore, for all seven of the components believed to be affected by conditional conservatism, the results are consistent with the conditional conservatism interpretation of the Basu coef-ficient. However, within this group, there is only weak evidence of association
between the magnitude of theb2 coefficients and our judgements as to the
like-lihood that components are affected by conservatism: although the five highest
ranked items have much higher b2 coefficients than the two lowest ranked
Table 4. Results from estimation of the sensitivity-difference-measurement regression model (3) Dependent variables (X) a1 a2 b1 b2 Adj. R2 (%) CFOI (CFOI) 0.105 20.020 20.024 0.207 5.74 (18.89)∗ ∗ (23.07)∗ ∗ (21.94) (9.51)∗ ∗ Investing accruals (IA) 0.005 20.001 20.000 0.035 0.69 (20.57) (20.02) (20.02) (3.42)∗ ∗ Change in accounts receivable (DAR) 0.017 (4.86)∗ ∗ 0.001 (0.23) 0.020 (5.54)∗ ∗ 0.031 (4.23)∗ ∗ 2.86 Change in inventory (DInv) 0.012 20.001 0.001 0.029 0.87
(4.58)∗ ∗ (20.23) (0.53) (3.44)∗ ∗ 2Change in accounts payable (DAP) 20.020 (27.34)∗ ∗ 0.007 (2.34)∗ 20.009 (23.68)∗ ∗ 20.026 (24.28)∗ ∗ 1.49 Other operating accruals
(OOA) 20.002 (21.88) 0.006 (3.92)∗ ∗ 0.000 (0.60) 0.043 (4.50)∗ ∗ 1.82 Operating profit (OP) 0.117 20.008 20.012 0.319 14.74 (18.75)∗ ∗ (20.97) (20.66) (10.61)∗ ∗ Special etc. (Special+ONO) 0.001 (0.89) 0.002 (0.65) 0.002 (0.82) 0.034 (2.78)∗ ∗ 0.63 Interest income less interest
expense (Int) 20.018 (217.01)∗ ∗ 20.000 (20.36) 0.001 (0.44) 20.005 (20.89) 0.04 Pre-tax income (Pretax) 0.100 20.006 20.009 0.348 14.00
(15.32)∗ ∗ (20.72) (20.60) (10.88)∗ ∗
2Taxation (Tax) 20.035 0.006 20.002 20.038 11.92
(231.89)∗ ∗ (5.60)∗ ∗ (20.62) (210.76)∗ ∗
Post-tax income (Posttax) 0.065 20.000 20.011 0.310 12.27
(11.53)∗ ∗ (20.07) (20.91) (10.62)∗ ∗
Extraordinary items (Extra) 0.000 20.000 20.000 20.001 0.06
(1.21) (21.36) (20.65) (21.22)
2Minority etc. (Minpref) 20.003
(27.61)∗ ∗ 20.001 (20.85) 0.000 (0.52) 20.005 (25.48)∗ ∗ 0.21 Net income (Netinc) 0.062 20.001 20.011 0.304 12.09
(11.25)∗ ∗ (20.12) (20.90) (10.44)∗ ∗ Prior-period adjustment (PPA) 20.001 (21.10) 20.000 (20.26) 20.001 (21.40) 0.002 (0.74) 20.00 Foreign-currency translation difference (FCT) 20.002 (22.53)∗ 20.000 (20.49) 0.000 (0.33) 20.001 (20.46) 20.02 Revaluation gains and
losses (Rev) 0.002 (3.19)∗ ∗ 0.001 (2.08)∗ 0.000 (0.08) 0.005 (2.19)∗ 0.04 2Goodwill (GW) 20.010 0.001 20.013 20.002 0.46 (21.97)∗ (0.42) (21.40) (20.35)
Other dirty surplus flows (ODSF) 20.000 (20.72) 20.000 (20.63) 0.001 (2.01)∗ 20.000 (20.79) 0.04 Clean surplus earnings 0.051 0.001 20.024 0.308 8.51 (CSE) (7.62)∗ ∗ (0.08) (22.81)∗ ∗ (10.79)∗ ∗
(Continued)
items (revaluation gains and losses; goodwill), the coefficient for goodwill for 1992 – 97 only is larger than those of the five highest ranked items (see note b to Table 5).
Of the seven items believed not to be affected by conditional conservatism, the sensitivity difference is positive and significantly different from zero in only one
case: CFOI (b2: 0.207,t-statistic: 9.51). Not only is this coefficient highly
statisti-cally significant, it is also large relative to the Basu coefficients for the earnings measures for which results are reported in Table 4, which fall in the range 0.304 –
0.348.9As CFOI cannot be directly affected by accounting-conservatism-induced
asymmetric timeliness, the effect observed here may be due to asymmetric response of cash flow to bad news and good news but cannot be directly due to conditional conservatism. This result for CFOI, together with similar results
Table 4.Continued
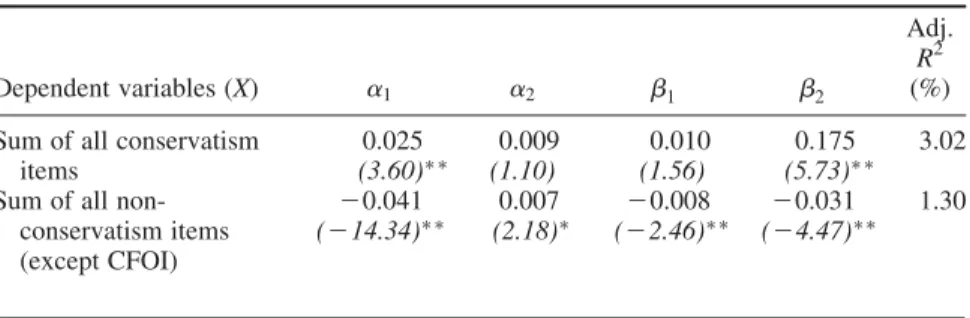
Dependent variables (X) a1 a2 b1 b2
Adj.
R2
(%) Sum of all conservatism
items 0.025 (3.60)∗ ∗ 0.009 (1.10) 0.010 (1.56) 0.175 (5.73)∗ ∗ 3.02 Sum of all
non-conservatism items (except CFOI) 20.041 (214.34)∗ ∗ 0.007 (2.18)∗ 20.008 (22.46)∗ ∗ 20.031 (24.47)∗ ∗ 1.30 Notes: a
The results reported above are from the estimation of the following pooled cross-section time-series regression model:
Xit=a1+a2DUMit+b1Rit+b2Rit×DUMit+1it (3)
whereXitis an earnings measure or component for firmifor the accounting period ended at timet, scaled
by the market value of equity shareholders’ funds at the beginning of that period;Ritis the share return
for the accounting period ended at timet;DUMitis a dummy variable that takes the value of one when Ritis negative, and zero otherwise; theaandbterms are regression coefficients;1itis the error term.b2
is the Basu coefficient whereXitis an earnings measure, and is the sensitivity difference for that
component whereXitis an earnings component.t-statistics are given in parentheses.∗(∗∗) denotes
significance at the 5% (1%) level in a two-sided test. Following Petersen (2008) and Gow et al.
(2009), our test statistics are based on two-way cluster-robust standard errors. The number of cases is 10,791. The data used in the regression models in respect of change in accounts payable, taxation, minority interest and preference dividends and goodwill write-offs are multiplied by 21. Thus, the coefficients for these earnings components can be added to those of all other components to give the coefficients for the relevant earnings measures.
bThe sum of all conservatism items is the sum of all items judged to be affected by conditional
conservatism: Investing accruals (IA)+Change in accounts receivable (DAR)+Change in inventory (DInv)+Other operating accruals (OOA)+Special and other non-operating items (Special+ONO)
+Revaluation gains and losses (Rev)2Goodwill (GW). The sum of all non-conservatism items (except CFOI) is the sum of all items except CFOI judged not to be affected by conditional conservatism:2
Change in accounts payable (D AP)+Interest income less interest expense (Int)+Extraordinary items (Extra)+Prior-period adjustment (PPA)+Foreign-currency translation difference (FCT)+ Other dirty surplus flows (ODSF).
Table 5. Summary of inferences from sensitivity differences reported in Table 4 b2 coefficient Percentage of totalb2 coefficient b2coefficient in model (3) positive and significantly different from zero? Consistent with conditional conservatism interpretation of Basu coefficient?
Items believed to be affected by conditional conservatism (listed in rank order):
Other operating accruals (OOA) (1st equal)
0.043 14.0% Yes Yes Special and other non-operating items
(Special+ONO) (1st equal)
0.034 11.0% Yes Yes Change in accounts receivable (DAR)
(3rd equal)
0.031 10.1% Yes Yes Change in inventory (DInv) (3rd
equal)
0.029 9.4% Yes Yes Investing accruals (IA) (5th) 0.035 11.4% Yes Yes Revaluation gains and losses (Rev)
(6th equal)
0.005 1.6% Yes Yes
2Goodwill (GW) (6th equal) 20.002 20.7% No Yes 0.175 56.8% (See note b)
Items believed not to be affected by conditional conservatism: Cash flow:
CFOI (CFOI) 0.207 67.2% Yes No
Items other than CFOI believed not to be affected by conditional conservatism:
2Change in accounts payable (DAP) 20.026 28.4% No Yes Interest income less interest expense
(Int)
20.005 21.6% No Yes Extraordinary items (Extra) 20.001 20.3% No Yes Prior-period adjustment (PPA) 0.002 0.6% No Yes Foreign-currency translation
difference (FCT)
20.001 20.3% No Yes Other dirty surplus flows (ODSF) 20.000 20.0% No Yes
20.031 210.0%
Other items:
2Taxation (Tax) 20.038 212.4%
2Minority int. and preference dividends (Minpref)
20.005 21.6%
20.043 214.0% Total 0.308 100.0%
Notes:
aThe information tabulated is based on theb
2coefficients from regression model (3) reported in
Table 4.
bTheb
2coefficient for goodwill is not positive and significantly different from zero for the data-set as a
whole. However, because of the fundamental change in the accounting for goodwill brought about by
FRS 10from 1998, we also estimate model (3) separately for the interval 1992–97, during which direct write-off of goodwill to equity was standard practice in the UK, and for the interval from 1998 to 2004, during which such write-offs were not permitted and movements within this category comprised only write-backs on disposal. Theb2coefficient on goodwill is positive and significantly
different from zero in the first interval (b2: 0.056,t-statistic: 2.33), but not in the second. We interpret this result as consistent with the conditional conservatism interpretation of the Basu coefficient.
reported by other studies in respect of cash-flow measures, suggests that, where the Basu coefficient is used to measure conditional accounting conservatism, it may be advisable to test the robustness of results to the exclusion of the element of the coefficient due to cash flows. For the other six items believed not to be affected by conditional conservatism, in no case is the sensitivity difference positive and significantly different from zero: change in accounts
payable (b2: 20.026,t-statistic: 24.28); interest income less interest expense
(b2: 20.005, t-statistic: 20.89); extraordinary items (b2: 20.001, t-statistic:
21.22); prior-period adjustment (b2: 0.002, t-statistic: 0.74); foreign-currency
translation difference (b2: 20.001,t-statistic:20.46); other dirty surplus flows
(b2: 20.000, t-statistic: 20.79). The only one of these b2 coefficients that is
significantly different from zero is that for change in accounts payable. We investigate this coefficient in light of the possibility that it arises in part because of association between accounts payable and other components of
working capital. We find that the b2 for the residuals from a regression of
change in accounts payable on change in accounts receivable and change in inventories is not significantly different from zero. This suggests that the significant negative sensitivity difference for change in accounts payable is due to association between accounts payable and other components of working
capital rather than to any underlying sensitivity difference for that item.10
As the aggregate of all items classified as likely to be affected by conditional conservatism is a potential focus for studies of conditional conservatism, we also report at the foot of Table 4 the coefficients and test statistics for that aggregate, along with corresponding statistics for the aggregate of all items classified as not
likely to be affected by conditional conservatism except for CFOI. Theb2
coeffi-cients andt-statistics for these two items are, respectively:b2: 0.175,t-statistic:
5.73;b2:20.031,t-statistic: 24.47.
In summary, the results reported above suggest that researchers using the Basu coefficient as an indicator of conditional conservatism should test the robustness of their results to the exclusion of the element of the coefficient due to cash flows, but are otherwise consistent with the conditional conservatism interpretation of the coefficient.
5.2. Test of Robustness of Results to the Bias Documented by Patatoukas and Thomas (2009)
As mentioned in the introduction, Patatoukas and Thomas (2009) report that association between return volatility and the probability of a loss can cause a bias in the Basu coefficient large enough to induce an apparent sensitivity differ-ence for lagged earnings with respect to return, which cannot be due to con-ditional conservatism. In light of the evidence of such a bias in the Basu coefficient, we examine whether the sensitivity differences reported in this study may be due to that bias. We do so by replicating for our earnings measures and earnings components a test that Patatoukas and Thomas (2009) implemented
for earnings. This involves re-estimating our regression model (3) for each earn-ings measure and earnearn-ings component, using as the dependent variables the lagged earnings measures and components in place of the contemporaneous
earn-ings measures and components, and examining whetherb2coefficients for lagged
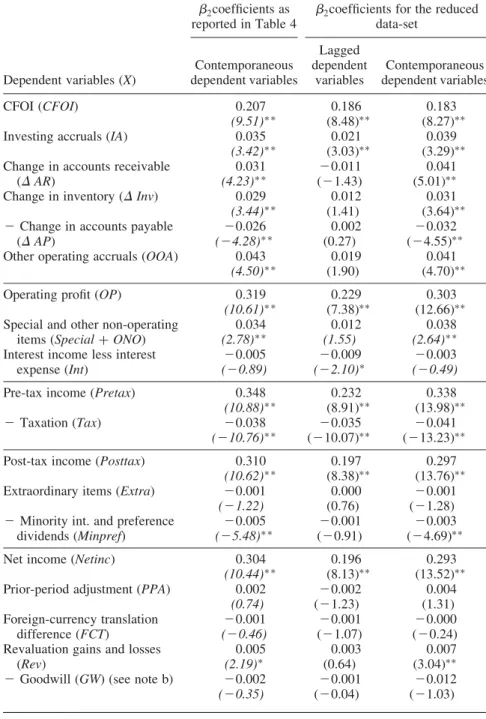
earnings measures and lagged earnings components with respect to contempora-neous share returns are significant. For this lagged-dependent-variable procedure, we eliminate the first case for each firm and those cases for which the previous-period case is deleted as an outlier, giving a reduced data-set of 8,386 cases. In order to allow comparison of the lagged-dependent-variable results with the con-temporaneous-dependent-variable results reported in Tables 4 and 5 and with the contemporaneous-dependent-variable results for the reduced data-set, Table 6
reports three sets of b2 coefficients (sensitivity differences). Column 2 gives
the b2 coefficients from regression model (3) for the complete data-set as
reported in Table 4 (n¼10,791); column 3 reports the corresponding
coeffi-cients where the dependent variable is a lagged earnings measure or earnings
component for the reduced data-set (n¼8,386); column 4 reports the
corre-sponding coefficients where the dependent variable is a contemporaneous
earn-ings measure or earnearn-ings component for the reduced data-set (n¼8,386).
From comparison of columns 2 and 4, it can be seen that estimation of the con-temporaneous-dependent-variable version of regression model (3) gives very similar results for the full data-set and the reduced data-set. We now consider the lagged-dependent-variable results reported in column 3. Consistent with
Pata-toukas and Thomas (2009), the b2 coefficients for all of our lagged earnings
measures are positive and significantly different from zero. This is supportive of the Patatoukas and Thomas (2009) argument that the Basu coefficient for aggregate earnings is significantly affected by a bias not directly related to accounting conservatism. However, the sensitivity difference for lagged earnings
in our data is heavily concentrated in lagged CFOI. Theb2coefficient for CFOI is
0.186 (t-statistic: 8.48) and that for clean surplus earnings is 0.195 (t-statistic:
11.51). Also, of the seven earnings components that we classify as likely to be affected by conditional conservatism, including goodwill for 1992 – 97, investing accruals is the only one that has a sensitivity difference for the lagged component
that is positive and significantly different from zero (b2: 0.021,t-statistic: 3.03).
For the other six components classified as likely to be affected by conditional conservatism, including other operating accruals and special and other
non-oper-ating items which are particularly likely to be affected, theb2for the lagged
com-ponent is not significantly different from zero.
In our data, the non-conditional-conservatism bias documented by Patatoukas and Thomas (2009) does not appear to be an important cause of the sensitivity differences for those earnings components likely to be affected by conditional conservatism, but it does appear to be an important cause of the sensitivity differ-ence for CFOI, which cannot be directly due to conditional conservatism. This is supportive of our inference that, subject to the need to test the robustness of results to the exclusion of the element of the Basu coefficient due to cash
Table 6. Evidence on sensitivity differences for earnings components and the Patatoukas and Thomas (2009) bias
Dependent variables (X)
b2coefficients as reported in Table 4
b2coefficients for the reduced data-set Contemporaneous dependent variables Lagged dependent variables Contemporaneous dependent variables CFOI (CFOI) 0.207 0.186 0.183 (9.51)∗ ∗ (8.48)∗∗ (8.27)∗∗ Investing accruals (IA) 0.035 0.021 0.039 (3.42)∗ ∗ (3.03)∗∗ (3.29)∗∗ Change in accounts receivable
(DAR) 0.031 (4.23)∗ ∗ 20.011 (21.43) 0.041 (5.01)∗∗ Change in inventory (DInv) 0.029 0.012 0.031
(3.44)∗ ∗ (1.41) (3.64)∗∗
2Change in accounts payable (DAP) 20.026 (24.28)∗ ∗ 0.002 (0.27) 20.032 (24.55)∗∗ Other operating accruals (OOA) 0.043 0.019 0.041
(4.50)∗ ∗ (1.90) (4.70)∗∗ Operating profit (OP) 0.319 0.229 0.303
(10.61)∗ ∗ (7.38)∗∗ (12.66)∗∗ Special and other non-operating
items (Special+ONO)
0.034 (2.78)∗ ∗ 0.012 (1.55) 0.038 (2.64)∗ ∗
Interest income less interest expense (Int) 20.005 (20.89) 20.009 (22.10)∗ 20.003 (20.49)
Pre-tax income (Pretax) 0.348 0.232 0.338
(10.88)∗ ∗ (8.91)∗∗ (13.98)∗∗
2Taxation (Tax) 20.038 20.035 20.041
(210.76)∗ ∗ (210.07)∗∗ (213.23)∗∗ Post-tax income (Posttax) 0.310 0.197 0.297
(10.62)∗ ∗ (8.38)∗∗ (13.76)∗∗ Extraordinary items (Extra) 20.001 0.000 20.001
(21.22) (0.76) (21.28)
2Minority int. and preference dividends (Minpref) 20.005 (25.48)∗ ∗ 20.001 (20.91) 20.003 (24.69)∗∗ Net income (Netinc) 0.304 0.196 0.293
(10.44)∗ ∗ (8.13)∗∗ (13.52)∗∗ Prior-period adjustment (PPA) 0.002 20.002 0.004
(0.74) (21.23) (1.31) Foreign-currency translation difference (FCT) 20.001 (20.46) 20.001 (21.07) 20.000 (20.24) Revaluation gains and losses
(Rev) 0.005 (2.19)∗ 0.003 (0.64) 0.007 (3.04)∗∗
2Goodwill (GW) (see note b) 20.002 20.001 20.012
(20.35) (20.04) (21.03)
(Continued)
flows, our findings are consistent with the conditional conservatism interpretation of the coefficient.
6. Conclusion
The Basu coefficient, which measures the excess of the sensitivity of accounting earnings to negative share returns over its sensitivity to positive share returns, is widely used as an indicator of conditional-conservatism-induced asymmetric timeliness in the recognition within earnings of bad news and good news. Support for the conditional conservatism interpretation of the coefficient is
Table 6.Continued
Dependent variables (X)
b2coefficients as reported in Table 4
b2coefficients for the reduced data-set Contemporaneous dependent variables Lagged dependent variables Contemporaneous dependent variables Other dirty surplus flows (ODSF) 20.000 0.000 20.001
(20.79) (0.12) (21.39) Clean surplus earnings (CSE) 0.308 0.195 0.291
(10.79)∗ ∗ (11.51)∗∗ (11.96)∗∗ Sum of all conservatism items 0.175 0.055 0.185
(5.73)∗ ∗ (3.55)∗ ∗ (6.34)∗ ∗
Sum of all non-conservatism items (except CFOI)
20.031 (24.47)∗ ∗ 20.010 (20.96) 20.033 (24.65)∗ ∗ Notes:
aThis table reportsb
2coefficients (sensitivity differences) from the following versions of regression
model (3):
Column 2: where the dependent variable is a contemporaneous earnings measure or earnings component, for the complete data-set as reported in Table 4 (number of cases¼10,791);
Column 3: where the dependent variable is a lagged earnings measure or earnings component, for all cases for which results are reported in Tables 4 and 5 except the first case for each firm and those cases for which the previous-period case is deleted as an outlier (number of cases¼8,386);
Column 4: where the dependent variable is a contemporaneous earnings measure or earnings component, for all cases for which results are reported in Tables 4 and 5 except the first case for each firm and those cases for which the previous-period case is deleted as an outlier (number of cases¼8,386).
∗(∗∗) denotes significance at the 5% (1%) level in a two-sided test. Following Petersen (2008) and
Gowet al.(2009), our test statistics are based on two-way cluster-robust standard errors. The data used in the regression models in respect of change in accounts payable, taxation, minority interest and preference dividends and goodwill write-offs are multiplied by21. Thus, the coefficients for these earnings components can be added to those of all other components to give the coefficients for the relevant earnings measures.
b
Theb2coefficient for goodwill for the interval 1992–97, during which direct write-off of goodwill to
equity was standard practice in the UK, is positive and significantly different from zero when contemporaneous goodwill is regressed on contemporaneous return (corresponding to columns 2 and 4 above), but not when lagged goodwill is regressed on contemporaneous return (corresponding to column 3 above).
found in the extensive evidence that it is associated with factors predicted to be associated with conditional conservatism. However, there are grounds for concern that the Basu coefficient may reflect things other than conditional accounting conservatism, and that this might interfere with its interpretability as an indicator of that phenomenon.
In this study, we argue that evidence on the validity of the Basu coefficient as an indicator of conditional conservatism can be obtained by disaggregating earn-ings into components, classifying those components by whether or not they are likely to be affected by conditional conservatism, and examining whether or not the Basu coefficient arises primarily from components classified as likely to be affected by conditional conservatism. We then implement this procedure
for a sample of UK firms reporting underFRS 3: Reporting Financial
Perform-ance in periods from 1992 to 2004. With the notable exception of CFOI, for
which we report a large and statistically significant positive sensitivity difference, and when consideration of goodwill write-offs is limited to the time from 1992 to 1997 only, the sensitivity difference for each earnings component classified as likely (unlikely) to be affected by conditional conservatism is (is not) positive and significantly different from zero. By measuring the sensitivity differences for lagged earnings measures and earnings components with respect to contem-poraneous share returns, we also seek evidence as to whether sensitivity differ-ences reported in this study may be the artefact of the non-conservatism bias documented by Patatoukas and Thomas (2009). We find that the bias documented by Patatoukas and Thomas (2009) is present in all of our aggregate earnings measures, but that it is heavily concentrated in the CFOI component of earnings and largely absent from components of earnings that we classify as likely to be affected by conditional conservatism. Our result for CFOI, together with similar results reported by other studies and our test for the Patatoukas and Thomas (2009) bias, suggests that, where the Basu coefficient is used to measure conditional accounting conservatism, it may be advisable to test the robustness of results to the exclusion of the element of the coefficient due to cash flows. Otherwise, the results of this study are consistent with the conditional conservatism interpretation of the coefficient.
Our results are subject to a number of caveats. First, although our results are supportive of the conditional conservatism interpretation of the Basu coefficient, they do not rule out the possibility that the sensitivity differences in non-cash-flow components of earnings might be due in part to factors other than conditional conservatism, such as those referred to in the introduction to this study. Second, our inferences are conditional on some relatively strong assump-tion regarding the classificaassump-tion of components as likely and not likely to be affected by conditional conservatism, although we should emphasise that this classification is based on a detailed review of accounting regulation and practice during the interval covered by the study. Third, we have limited our focus to the plausibility of the conditional conservatism interpretation of the Basu coefficient in light of accounting regulation and practice with regard to earnings
components, and have not sought to address economic or behavioural determi-nants of conditional conservatism.
Acknowledgements
The study has benefited from the comments of the associate editor, two referees, Sudipta Basu and participants at the European Accounting Association Congress (2008) and seminars at the University of Essex, the University of Cambridge, National Taiwan University, Exeter University, Tilburg University and City University of Hong Kong.
Notes
1
Some analysis related to that proposed and carried out in this study has been done previously, but at a less detailed level than in this study. By comparing the sensitivity difference for indirectly measured cash flows with that for earnings, Basu (1997) infers that the Basu coeffi-cient is primarily due to the accruals component of earnings rather than to the cash-flow com-ponent. Also, using a number of news proxies including abnormal share return, Ball and Shivakumar (2006) report that total accruals and total working capital accruals are more sensi-tive to bad news than to good news.
2
The start of the interval coincides with the introduction ofFRS 3, which was mandatory for accounting periods ending on or after 22 June 1993 and ends with the discontinuation by the Datastream financial database of the accounting data series used in this study, which coincides approximately with the time at which UK listed firms were required to adopt International Financial Reporting Standards (IFRSs) and ceased to report in accordance withFRS 3. UK listed firms were required to adopt IFRSs for accounting periods starting after 1 January 2005.
3
Prior toFRS 3, the reporting of income components was significantly less uniform than under
FRS 3, particularly in the case of gains and losses reported outside net income; after the intro-duction of IFRSs, there were changes in the reporting of income, including with regard to items that were classified as ‘exceptional items’ underFRS 3(seeFRS 3and Ernst and Young LLP, 2008, chap. 3).
4
To the extent that share issues are recorded at prices different from market value, for example, as a result of employees exercising options, clean surplus earnings as defined in (1a) does not conform to what Christensen and Feltham (2003) call ‘super clean surplus’. When share issues are recorded at a price other than market value, it will usually be at a discount reflecting the dilutive effect of the transaction, resulting in clean surplus earnings being larger than ‘super clean surplus’ earnings. This non-conservative aspect of accounting is not addressed in this study.
5
FRS 15, which supersededSSAP 12: Accounting for Depreciation(ASC, 1977) for accounting periods ending on or after 23 March 2000, prohibited the previously permitted recognition as an exceptional item of the entire accumulated depreciation effect of a change in estimated asset life. Since this change affected an item categorised within ‘other operating accruals’, it did not materially affect our measure of depreciation.
6
See Ernst and Young LLP (1999, chap. 22, pp. 1500 – 1503) for discussion of possible conflict betweenFRS 3andSSAP 2with regard to provisions.
7
In our data-set comprising 10,791 firm-years, there are only nine firm-years where extraordi-nary items are not equal to zero. Examination of these cases confirmed that they arose from events of a highly abnormal nature, including events associated with related-party transactions.
8
Cases excluded from this set include those where there is a significant discrepancy between the reported operating profits given by the income statement and the Datastream-reported operating profits given by the statement of cash flows, and some cases of multiple