University of Nebraska - Lincoln
DigitalCommons@University of Nebraska - Lincoln
Cornhusker Economics
Agricultural Economics Department
10-21-2018
Farm Programs, Payments and Prospects
Bradley D. Lubben
University of Nebraska-Lincoln
Follow this and additional works at:
https://digitalcommons.unl.edu/agecon_cornhusker
Part of the
Agricultural Economics Commons
, and the
Economics Commons
This Article is brought to you for free and open access by the Agricultural Economics Department at DigitalCommons@University of Nebraska Lincoln. It has been accepted for inclusion in Cornhusker Economics by an authorized administrator of DigitalCommons@University of Nebraska -Lincoln.
Lubben, Bradley D., "Farm Programs, Payments and Prospects" (2018).Cornhusker Economics. 972. https://digitalcommons.unl.edu/agecon_cornhusker/972
agecon.unl.edu/cornhuskereconomics
Cornhusker Economics
It is the policy of the University of Nebraska–Lincoln not to discriminate based upon age, race, ethnicity, color, national origin, gender-identity, sex, pregnancy, disability, sexual orientation, genetic information, veteran’s status, marital status, religion or political affiliation.
October 21, 2018
Farm Programs, Payments and Prospects
The USDA Farm Service Agency (FSA) began issuing payments to producers in October for Price Loss Cov-erage (PLC) and Agriculture Risk CovCov-erage (ARC) grams for the 2017 crop year. While these farm pro-gram payments had provided substantial cash flow to help buffer falling market price and farm income pro-jections in the past three years, the current programs will provide relatively little cash flow for now and for the coming year. Only the ad hoc trade assistance pay-ments and the outlook for new farm programs and de-cisions in 2019 may provide potential relief from the current outlook.
Farm Program Payments
An analysis of farm program payment rates provides details on the current payments as well as the outlook for future support. The federal farm program support comes from commodity programs created in the 2014 Farm Bill. The legislation gave producers a choice of enrollment by commodity and by county in either a price-based program (PLC) or a revenue-based pro-gram (ARC) at either the county level (ARC-CO) or the farm level (ARC-IC for “individual coverage”). As com-modity prices have declined from pre-2014 levels, both ARC and PLC have become important components of the farm income safety net and also substantial infu-sions of cash flow for producers.
Table 1 provides historic national marketing year aver-age prices and current national marketing year price projections for the primary Nebraska crops for the 2014-2018 crop marketing years, the years covered by the 2014 Farm Bill programs. National marketing year average prices are used to calculate potential PLC pay-ments and ARC paypay-ments. ARC-CO paypay-ments are also dependent on county yields while ARC-IC is depend-ent on individual farm-level yields.
Market Report Year
Ago
4 Wks
Ago 10-19-18
Livestock and Products,
Weekly Average
Nebraska Slaughter Steers,
35-65% Choice, Live Weight. . . .
*
*
*
Nebraska Feeder Steers,Med. & Large Frame, 550-600 lb. . . . . 179.00 179.12 174.48 Nebraska Feeder Steers,
Med. & Large Frame 750-800 lb. . .. . 162.62 167.53 160.45
Choice Boxed Beef,
600-750 lb. Carcass. . . . 198.63 204.98 205.74 Western Corn Belt Base Hog Price
Carcass, Negotiated . . . .. 65.38 61.58 57.54 Pork Carcass Cutout, 185 lb. Carcass
51-52% Lean. . . . 74.13 77.52 77.17 Slaughter Lambs, wooled and shorn,
135-165 lb. National. . . . 144.53 137.78 138.21 National Carcass Lamb Cutout
FOB. . . . 396.62 378.76 381.31
Crops,
Daily Spot Prices
Wheat, No. 1, H.W.
Imperial, bu. . . . 3.21 4.61 4.45
Corn, No. 2, Yellow
Columbus, bu. . . . 3.10 3.22 3.33 Soybeans, No. 1, Yellow
Columbus, bu. . . .. . . 8.85 7.18 7.39 Grain Sorghum, No.2, Yellow
Dorchester, cwt. . . . 5.65 5.10 5.27 Oats, No. 2, Heavy
Minneapolis, Mn, bu. . . . 2.99 3.02 3.20
Feed
Alfalfa, Large Square Bales, Good to Premium, RFV 160-185
Northeast Nebraska, ton. . . . 147.50
*
*
Alfalfa, Large Rounds, GoodPlatte Valley, ton. . . . 83.75 102.50 102.50
Grass Hay, Large Rounds, Good
Nebraska, ton. . . .. . . . 85.00 102.50 87.50 Dried Distillers Grains, 10% Moisture
Nebraska Average. . . . 122.50 135.00 137.50 Wet Distillers Grains, 65-70% Moisture
Nebraska Average. . . . 43.50 43.00 48.00
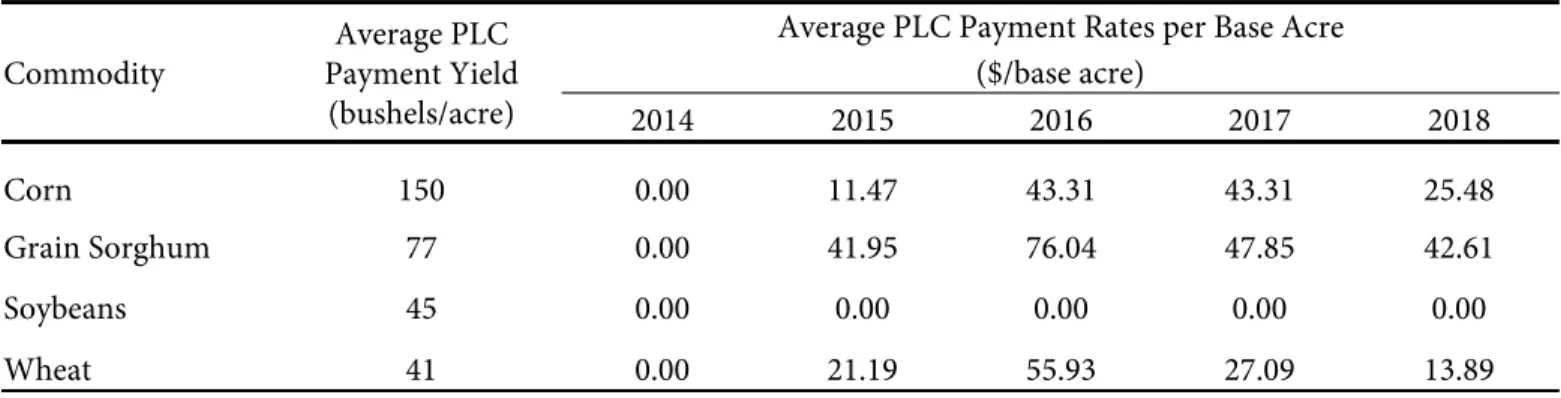
prices for wheat, grain sorghum, and corn dropped below reference price levels. Using average program yields across the state, Table 2 presents average PLC payment rates per base acre for the 2014-2018 crop years, based on official FSA data through the 2017 crop year and current price projections as noted in the table for the 2018 crop years.
While producers with base acres of wheat, grain sor-ghum and some minor crops enrolled a substantial portion of the acreage in PLC, corn and soybean base acres were overwhelmingly enrolled in the ARC pro-gram, given the projections of substantially more sup-port from ARC at the time for those crops. Thus, even though PLC payment rates have increased with lower price levels, the total amount of PLC payments in Ne-braska this year remains relatively small at about $53 million for the 2017 crop. Looking forward to the 2018 crop payments to be made in October 2019, the pro-jections are even smaller at around $35 million due to the projected modest recovery in corn and wheat pric-es.
Commodity Reference Price
($/bushel) Prices ($/bushel) 2014 2015 2016 2017 2018 Corn 3.70 3.70 3.61 3.36 3.36 3.50 Grain Sorghum 3.95 4.03 3.31 2.79 3.22 3.30 Soybeans 8.40 10.10 8.95 9.47 9.33 8.60 Wheat 5.50 5.99 4.89 3.89 4.72 5.10
Table 1. Farm Program Price Projections*
* Final price estimates for 2014-2017 from USDA-NASS. Price projections for 2018 from USDA-WAOB and USDA-FSA as of October 2018. Sources: USDA-FSA, USDA-NASS, and USDA-WAOB.
The multi-year decline in prices has translated into sub-stantial farm program payments and projected payments. However, the differing objectives and mechanics of ARC and PLC create very different payment levels and projec-tions.
PLC payment rates are directly tied to the difference be-tween the legislated reference price and the national mar-keting year average price for each commodity, with a maxi-mum payment rate equal to the difference between the ref-erence price and the national average marketing loan rate. Table 1 also provides the reference price for each major commodity to allow comparisons of market prices and ref-erence prices. PLC payment rates per base acre for each crop are based on the calculated payment rate multiplied by the producer’s program yield and 85% of the producer’s base acreage. The total payment is limited by producer pay-ment limit and eligibility rules and is reduced according to the rules of budget sequestration.
PLC payments were negligible in Nebraska for the 2014 crop year, but payment rates have become substantial as
Commodity
Average PLC Payment Yield
(bushels/acre)
Average PLC Payment Rates per Base Acre ($/base acre) 2014 2015 2016 2017 2018 Corn 150 0.00 11.47 43.31 43.31 25.48 Grain Sorghum 77 0.00 41.95 76.04 47.85 42.61 Soybeans 45 0.00 0.00 0.00 0.00 0.00 Wheat 41 0.00 21.19 55.93 27.09 13.89
Table 2. Farm Program Average PLC Payment Rates in Nebraska*
* PLC payments and payment projections based on weighted average PLC payment yields in Nebraska. Payments based on prices for 2014-2017 from USDA-NASS and price projections for 2018 from USDA-WAOB and USDA-FSA as of October 2018. Sources: USDA-FSA, USDA-NASS, and USDA-WAOB.
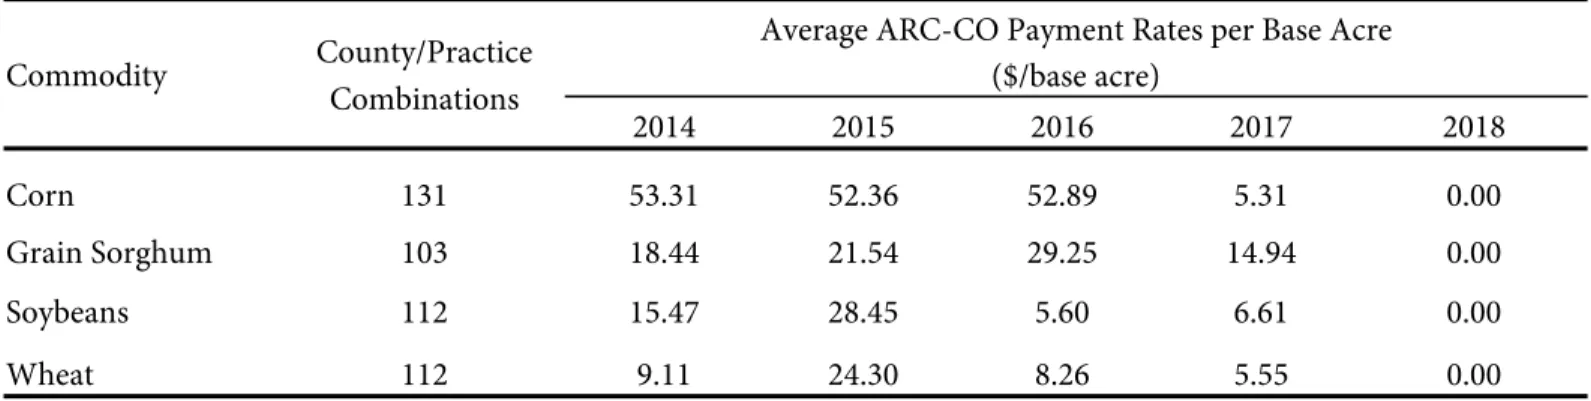
While PLC payment rates have grown over the life of the 2014 Farm Bill, ARC payment rates have fallen dramatical-ly. Unlike PLC payments that are tied to a fixed reference price set in legislation, ARC-CO payments are tied to reve-nue (price times yield) results for the crop year compared to a benchmark revenue based on the five-year Olympic aver-age price and yield for each crop by county and by practice for those crops where county-level irrigated and non-irrigated yields are calculated separately. ARC-IC is calcu-lated similarly, but on farm-level yield averages and results. The ARC program protects producers when revenue drops below a guarantee equal to 86% of the benchmark revenue based on the average prices and yields.
ARC payments are based on the same national marketing year average prices that are used with PLC. ARC-CO pay-ments are additionally based on county-level crop yieldsas estimated from USDA National Agricultural Statistics Ser-vice (NASS) data where available or from USDA Risk Man-agement Agency (RMA) data or other procedures as neces-sary. Yields per harvested acre are adjusted by FSA for un-harvested acreage to generate yields per planted acre used in the ARC formula. ARC-IC payments are based on actual farm-level yields per planted acre and add to total ARC pay-ments, but are an insignificant part of the total payment amounts due to limited enrollment.
Table 3 shows the average ARC-CO payment rates per base acre for the 2014-2017 crop years for major Nebraska crops along with projections for the 2018 crop year. As with PLC, the total payment is limited by producer payment limit and eligibility rules and is reduced according to the rules of budget sequestration.
The payment rates in Table 3 were calculated per base acre, taking into account that payments are made on only 85% of base acres. The payment rates also represent a simple aver-age of all calculated payment rates in Nebraska for each crop, including all irrigated, non-irrigated, and blended practices by county. Thus, the rates do not reflect any single
Commodity County/Practice Combinations
Average ARC-CO Payment Rates per Base Acre ($/base acre) 2014 2015 2016 2017 2018 Corn 131 53.31 52.36 52.89 5.31 0.00 Grain Sorghum 103 18.44 21.54 29.25 14.94 0.00 Soybeans 112 15.47 28.45 5.60 6.61 0.00 Wheat 112 9.11 24.30 8.26 5.55 0.00
Table 3. Farm Program Average ARC-CO Payment Rates in Nebraska*
* ARC-CO payments and payment projections averaged across all counties and practices in Nebraska where data is available. Pay-ments for 2014-2017 from USDA-FSA. Payment projections for 2018 based on yield and price projections from USDA-NASS, USDA-WAOB, and USDA-FSA as of October 2018. Sources: USDA-FSA, USDA-NASS and USDA-WAOB.
payment rate and do not illustrate the wide variability in payment rates due to variable yield results, but they do demonstrate the general level of payments for each crop over the life of the 2014 Farm Bill.
While ARC payment rates were large in the first years of the 2014 Farm Bill, the payment rates and projec-tions have fallen dramatically as lower market prices led to lower 5-year Olympic average prices and thus, lower ARC guarantees. Total ARC payments in Ne-braska exceeded $600 million on each of the 2014 and 2015 crops and $550 million on the 2016 crop, but are now projected at just $80 million on the 2017 crop and nothing on the 2018 crop based on current price and yield forecasts.
Detailed payment estimates and analyses are available on the Nebraska Extension farm bill website at http:// farmbill.unl.edu. Full tables of all counties, crops, and practices under the ARC-CO program in Nebraska are posted online for the 2014-2017 crop years along with current projections for the 2018 crop year. The data is regularly updated as new price, yield, and/or program information is available.
Farm Program Prospects
The decline in farm program payments and support even as market prices are slow to recover will stress farm income and cash flow projections through 2019. However, Market Facilitation Program (MFP) pay-ments made as part of the trade assistance announced earlier this fall by the Secretary of Agriculture will pro-vide some temporary relief from the declining cash flow. As discussed by Giri, Peterson, and Sharma in a recent Cornhusker Economics article, the payments were announced for crop and livestock commodities most directly impacted by market losses as a result of the on-going trade conflict with China.
Based on current production estimates and announced pay-ment rates, total MFP paypay-ments could exceed $320 million in Nebraska, offsetting a large share of the simultaneous decline in ARC payments. While that will help cash flow projections in 2018, the expectation of little combined ARC and PLC payments in 2019 (on the 2018 crop) will keep cash flow prospects dim, barring a substantial market re-bound or additional assistance from USDA.
While producers need to manage for the reduced farm pro-gram supports over the coming year, they also need to be ready for new farm program decisions in the coming year. The 2014 Farm Bill expired at the end of September without either a new farm bill or an extension of current programs in place. While negotiators from both the Senate and the House are continuing to work through differences in legis-lative proposals from both chambers, the outlook for the 2018 Farm Bill remains cloudy as of mid-October. If a com-promise is reached, it could be voted on in a lame duck ses-sion of Congress after the November election. If consensus can’t be achieved, the fallback is likely a vote to extend cur-rent legislation from the 2014 Farm Bill for a year and begin the farm bill debate again in a new session of Congress.
With the current uncertainty, the primary question ahead for crop producers may not be whether Con-gress passes a new farm bill or extends current legisla-tion, but whether to sign up for ARC or PLC in 2019 under new or extended programs. While the 2018 farm bill proposals from the Senate and the House contain several competing policy ideas, they both sug-gest the continuation of the current ARC and PLC programs. Even with potential changes to the pro-grams, the biggest change for producers could be hav-ing a new ARC vs. PLC decision in 2019 under very different price conditions than when the decision was last made in 2014.
Figures 1 through 4 show market prices and projec-tions against the price-based support of the PLC pro-gram and the price component of the revenue-based ARC program through 2023, the presumed end of the next farm bill. The price projections for 2018 are from current USDA reports while the price projections for 2019-2023 are from baseline USDA projections re-leased in February (before current trade conflicts spiked).
Figure 1. Corn Prices, PLC, and ARC Price Protection Figure 2, Sorghum Prices, PLC, and ARC Price Protection
In each graph, the PLC reference price set in the 2014 Farm Bill is projected to continue as is under the new or extended legislation and provide income support to pro-ducers if market prices are below reference rate levels. The price component of the ARC protection is the moving 5-year Olympic average price. Based on historic and project-ed prices, that average price has been falling for all com-modities and has bottomed out at the reference price (the minimum price to count for each year of the average under ARC program rules) for major commodities other than soybeans. But, since the ARC guarantee is 86% of the aver-age yield and averaver-age price, the effective price protection starts at 86% of the moving average, assuming average yields (more price protection under lower yields, less price protection under higher yields). Using that as a baseline for comparison, the effective price projection (assuming average yields) offered by ARC in 2019 and beyond will fall below that provided by PLC for all major commodities assuming current projections of only modest price recov-ery. While ARC will provide revenue support due to low yields that PLC will not provide, the economics of the two programs are definitely different than when the ARC vs. PLC decision was first made in 2014.
Summary
In sum, farm program payments have helped Nebraska crop producers cope with the dramatic drop in prices since 2013 with $500-$600 million plus in payments received on each of the 2014-2016 crops. But, that sup-port, largely in ARC, is quickly disappearing with sub-stantially less than $100 million in projected payments for the 2017-2018 crops, buffered only temporarily by the $300 million plus in trade assistance payments this fall. Barring significant market recovery or further trade assistance, producers will be managing for rela-tively low market prices and relarela-tively little farm pro-gram support in 2019. A new farm propro-gram decision in 2019 could provide additional payments in
2020, but regardless, producers will need to manage their risk carefully, including not just farm programs, but also production, insurance, and marketing deci-sions that all contribute to a portfolio approach to risk management.
Updated information, detail, and analysis is available at http://farmbill.unl.edu.
Reference:
Giri, A., W. Peterson, and S. Sharma. “Market Facilita-tion Program: Impact on Nebraska Corn and Soy-bean Producers.” Cornhusker Economics, October 3, 2018
Bradley D. Lubben Extension Associate Professor, Policy Specialist, Faculty Fellow, Rural Futures Institute, and Director, North Central Extension Risk Management Education Center [email protected]