G A Gratsos, Naval Architect, Shipowner, President Hellenic Chamber of Shipping, Greece H N Psaraftis, Professor, National Technical University of Athens, Greece
P Zachariadis, Naval Architect, Technical Director, Atlantic Bulk Carriers Management Ltd., Greece SUMMARY
In order to maintain shipping capacity to serve seaborne trade, new ships have to be built to replace those scrapped. The cost of building, manning, operating, maintaining and repairing a ship throughout its life is borne by society at large through market mechanisms. The original paper investigated through a cost/benefit analysis, how the average annual cost of ship transport varies with the corrosion additions elected at the design stage. The results of the study clearly indicated that ships built with sufficient corrosion allowances, truly adequate for the ship’s design life, have a lower life cycle cost per annum (AAC) despite the fact that such ships would carry a slightly smaller quantity of cargo. Furthermore the safety and environmental benefits due to the reduced repairs and extended lifetime of such ships were briefly discussed. The debate of how robust a ship should be was also transferred to IMO in the context of Goal Based Standards following a submission by Japan which stated that the increased steel weight of a more robust ship will result in increased CO2 emissions due to a reduced cargo carrying capacity. Greece replied by submitting a summary of the original paper and preliminary estimations on Life cycle CO2 emissions disputing the Japanese contentions. However, taking onboard the challenge, the authors present here an update, using the final IACS CSR bulk carrier corrosion margins and taking into account the major environmental implications of the heavier ship scantlings for two bulk carrier size brackets, Panamax and Handymax. The results show that the more robust ships would produce less CO2 emissions over their lifetime.
NOMENCLATURE AAC: Average Annual Cost CSR: Common Structural Rules CO2: Carbon Dioxide
GHG: Greenhouse Gases GBS: Goal Based Standards
IACS: International Association of Classification Societies
IMO: International Maritime Organization NAABSA: Not Always Afloat But Safely Aground
RINA: Royal Institution of Naval Architects UR: Unified Requirement
1. INTRODUCTION
Shipping transports over 90% of world trade. In order to maintain shipping capacity to serve this trade, new ships have to be built to replace those scrapped. The cost of building, manning, operating, maintaining and repairing a ship throughout its life is borne by society at large through market mechanisms.
The results of the economic study of the first paper, presented at the last RINA “Design and Operation of Bulk Carriers” Conference, 2005 in London (Gratsos and Zachariadis, 2005),
indicated that ships built with corrosion allowances, which are truly adequate for the ship’s design life, when all factors have been taken into account, have a lower Life Cycle cost per annum (AAC) for the maintenance of the integrity of their structure. This despite the fact that they would carry a slightly smaller quantity of cargo and therefore their income over time would be marginally less. This appears to be a general truth regardless of the inflation environment. Furthermore these ships are more reliable performers having a lower average annual downtime.
The side benefit of such construction would be greater safety since it is accepted that steel renewals do not always restore the effectiveness of a ship’s structure. In addition the increased scantlings serve as a much needed safety margin for hull strength and fatigue, especially in view of new satellite data on global wave statistics, indicating more severe spectra than previously thought. More importantly, it is now admitted even by classification societies themselves, that the rule, minimum required, longitudinal strength (UR S-11) of tankers and bulk carrier requires increase and IACS has scheduled its revision. Therefore building ships that will only require
LIFE CYCLE COST OF MAINTAINING THE EFFECTIVENESS OF A
SHIP’S STRUCTURE AND ENVIRONMENTAL IMPACT OF SHIP DESIGN
the minimum steel renewals during their design life is an added safety benefit.
Furthermore the original paper contended that ships built with truly sufficient corrosion allowances do not waste the world’s resources or increase environmental pollution.
The international press (Lloyd’s List, Fairplay and others) made extensive references to the paper, even calling it as “the main thrust of arguments” of Greek shipping in criticizing the IACS Common Structural Rules (Fairplay’s Solutions and Newbuildings Magazine, 04 May 2006).
The debate moved to IMO in the context of Goal Based Standards for the Construction of Bulk Carriers and Oil Tankers. Following a submission by Japan (MSC 81/6/4) which stated that “advocating too robust a ship is like carrying steel ballast – this leads to increased CO2 emissions”, Greece countered by submitting the results of the original paper, including rough preliminary estimations of Life cycle CO2 emissions (MSC 81/6/17). These showed that, due to the shorter life of a less than robust ship, 50% more such ships are required to satisfy world cargo capacity. The additional CO2 emitted to produce the steel for these ships makes the longer life (more robust) ships more environmentally friendly. But the issue is more complex than simply the difference in lifetimes.
Thus, the authors, taking onboard this criticism, have been working on an update, using the final IACS CSR bulk carrier corrosion margins and taking into account some of the major possible environmental implications of the heavier ship scantlings for two ship sizes, Panamax and Handymax. The rest of this paper is organized as follows. Section 2 gives an overview of the results reported in the original paper. Section 3 reports on ship operation experience and Section 4 describes the purpose of this study. Section 5 describes the comparison among the two ship types in terms of carbon dioxide emissions and section 6 presents the paper’s conclusions. Some calculations are in the Appendix.
2. PREAMBLE: OVERVIEW OF PREVIOUS RESULTS
For over two decades shipyards and others have promoted the concept of “carry cargo, not steel” and have proceeded to over-optimize ship structures in an attempt to persuade shipowners that it was more beneficial to
construct ships in this fashion. The original paper (Gratsos and Zachariadis, 2005) showed that this is not the case at least from an economic point of view. The reduced steel repairs of a more robust ship, the reduced downtime and the increased lifetime produce substantially larger economic benefits to the operator, over the lifetime of such ship. Furthermore, designing ships that need to have main structural elements or extensive scantlings replaced during their design life, misrepresents the concept of “Design Life”. The original paper investigated, through a cost/benefit analysis, how the average annual cost of ship transport varies with the corrosion additions elected at the design stage. No attempt was made to differentiate between sale and purchase decisions of various owners throughout the ship’s life since, regardless of ownership, a ship will continue to be repaired and traded until scrapped. The study used a Panamax bulk carrier.
The results of the study clearly indicated that ships built with corrosion allowances dictated by experience, adequate for the ship’s design life, when all factors have been taken into account, have a lower Life Cycle cost per annum (AAC). This despite the fact that they would carry a slightly smaller quantity of cargo and therefore their income over time would be marginally less. This appears to be a general truth regardless of the inflation environment. Furthermore these ships are more reliable performers having a lower average annual downtime.
Steel renewal requirements were based on actual corrosion rates experienced by the Greek shipping industry, which controls approximately 27% of the world’s bulk carrier fleet of all ages, from new buildings to ships of over 25 year of age, built with the pre-CSR corrosion allowances. The same concept of Ship types A and B was used as in the present paper (see Section 4). The then available CSR Draft1 corrosion margins were used.
In making the Life Cycle cost calculations, the authors separately accounted for Daily Running Expenses (DRE), Steel Renewal costs, Downtime (representing the cost of lost opportunity to trade) and Benefits from the greater deadweight capacity of the lighter ship. The calculations took account of the Purchase Price of the ship as a new building, its Sale Price as Scrap at the end of its useful life and reverse the drydocking cost element in the DRE from the time of the last drydocking to the sale of the ship for scrap. They did not take
into account the financial costs as these vary between owners. Income data used in the Downtime and Benefit calculations also included estimated adjustments to the earning capacity of ships imposed through the overage insurance premiums presently required by cargo underwriters due to their experience with cargo losses from the over-optimized ships presently trading
Three series of calculations were attempted: The first series of calculations was divided in two parts. Part A was based on an inflation environment of 2% per annum with a discount rate of 5% per annum, with the other series using varying inflation and discount rates. The third series of calculations used nominal rates i.e. 0% inflation and 0% discount rate. Further to the Life Cycle cost calculations, Cash Flow calculations had been carried out estimating the cash-in/cash-out of the whole project for all above series of calculations.
It is interesting to note that the assumed income/cost figures used then (2004-2005) closely approximate today’s (2009 post-crisis) economic climate.
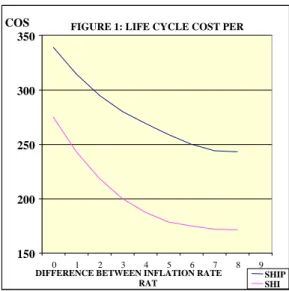
The first series of calculations, Part A, for the low interest rate environment, provided the following results: The Life Cycle cost of SHIP A is USD 2,916,000 per annum (AAC) while the Life Cycle cost of SHIP B is USD 2,185,000 per annum (AAC). In other words SHIP A is about 33.5% per year more expensive to operate. Even if SHIP B for some reason has to be scrapped at 20 years it still has a cheaper Life Cycle cost than SHIP A at $ 2,814,000 per annum (AAC). Similar results were obtained for the other series of calculations with the AAC difference between ships A and B increasing.
It is also interesting to note that, even if a shipowner decides to scrap the ship at around 20 years of age, SHIP B is still the preferred (more economic) choice. The additional robustness, strength, safety and reduction of related accidental pollution are just side benefits to him, his crew and society.
Sensitivity analyses were performed on newbuilding prices, freight rates and interest rates but the economic superiority of SHIP B remained strong in all cases.
Thus, the Life Cycle cost calculation results proved that steel renewals increase the Life Cycle cost per annum (AAC) of over-optimized ships (SHIP A) regardless of the
benefits from their greater deadweight and give it a greater Life Cycle cost per annum (AAC) than a ship built with higher corrosion margins (SHIP B) in any economic environment. It is clear that the percentage difference in Life Cycle cost per annum (AAC) between the two ships increases as the difference between the inflation rate and the discount rate increases. Thus the statement “carry cargo, not steel” does not stand up to scrutiny in any foreseeable economic environment.
3. SHIP OPERATION EXPERIENCE
Experience has shown that the pre-CSR corrosion allowances of even the more conservative classification society were marginally adequate for a 20-year design life vessel. The new corrosion allowances in the IACS Common Structural Rules were for the most part further reduced and especially for some critical areas, such as side and bottom shell, even though the new CSR ships are supposedly designed for a 25 year life. It should be pointed out that, following complaints by Greek shipping and International ship operating organizations, IACS improved its final CSR corrosion margins over those of the CSR first draft. However, in most areas they are still smaller than those allowed before CSR and they still fall short of those dictated by experience and many previous corrosion studies.
Many reliable and respected studies on annual corrosion rates for all parts of a ship were performed and published before the development of CSR. Many of these were performed and published by classification societies themselves. It is a wonder why the
FIGURE 1: LIFE CYCLE COST PER
150 200 250 300 350 0 1 2 3 4 5 6 7 8 9
DIFFERENCE BETWEEN INFLATION RATE RAT
COS
SHIP SHI
CSR finally adopted corrosion allowances which reflect much smaller corrosion rates than those published by several IACS members before CSR was conceived.
Parts of bulk carrier structures are known not to be able to maintain coatings and thus corrode faster, the hold structure is a case in point. It makes no financial sense to replace say a 20 mm tank top when an extra 2 mm of corrosion allowance at time of build would have allowed the ship to trade to her design life of 25 years without the renewal of the tank top in question. Such a better design with regard to the tank top would cost 15 times less than the cost of the eventual repairs not including the associated down time. It would also squander fewer resources.
Similarly areas such as side shell plating, heated fuel oil tanks, bottom plating subject to NAABSA trading as well as other locations from experience require more substantial plating. Such experience is fully confirmed by the results of the above mentioned studies.
4. PURPOSE OF STUDY
Having shown in the first paper that a robust ship has a lower lifecycle cost than a ship built marginally to comply with the rules, the purpose of this paper is to estimate and compare the life cycle CO2 emissions of such ships. We thus compare the life cycle CO2 emissions of two Panamax and two Handymax bulk carriers built to two different design concepts:
Ship A: is built according to the concept of low initial cost, lighter lightship weight in order to maximize cargo carrying capacity, with corrosion margins according to IACS’s new Common Structural Rules, Final Version, and
Ship B: is a ship of identical form and displacement to ship A but with a higher lightship weight due to greater corrosion allowances and particularly so in selected areas commensurate with present industry experience in order to minimize steel renewals. Ship B has overall similar corrosion margins with the pre-CSR ships (typically equivalent to 20-25% of original plate thickness) with further increases in some areas where these pre-CSR margins had proved inadequate (such as bulk carrier hold frames, lower transverse bulkheads, ballast tank scantlings etc.) Alternatively ship B can be arrived at by starting with IACS CSR
scantlings (as ship A) and adding the appropriate corrosion margins for true 25 year design life. In that case the required steel addition is more than that of a pre-CSR ship. The ships are otherwise identical having similar coatings, materials, operation and maintenance policies and are assumed to be employed in similar trading patterns.
The calculations for the steel renewals required for ships A and B have been updated to reflect the final IACS CSR corrosion allowances. Tables 8 and 9 in the Appendix show these calculations in detail, and also show the difference in operating days per year expected because of differences in steel renewals. As alluded to above, it is interesting to note, that a Panamax Bulk carrier built according to previous (20 year) class rules would need only 450 tons of extra steel to reach and exceed the 25 year lifetime. But a Panamax bulker built according to the new (25 year) IACS CSR requires nearly double that extra steel to conform to the advertised design life. Similar considerations pertain for the Handymax ships.
5. CO2 EMISSIONS COMPARISON
5.1 General considerations
A full-fledged ‘cradle-to-grave’ comparison of the CO2 emissions generated by the two alternative designs, ship A and ship B, is a non-trivial task, as there are some components that can be computed in a straightforward manner but other components are more difficult to do so. Here we shall attempt such a comparison, by focusing on the components that we think are the most important and can be calculated with some confidence.
Before we proceed, it is important to establish the framework for comparison. Thus, we shall be requiring both types of ships to produce the same amount of transport work (expressed in tonne-km’s) in a year. Not doing so would skew the analysis by comparing these two designs on an unequal basis. However, requiring the same tonne-km’s in a year would require some adjustments. The two ship types not only have unequal payloads (ship A’s higher than ship B’s) but also unequal operating days per year (ship B’s longer than ship A’s, due to more repair days for ship A). As these two differences work in opposite ways regarding tonne-km’s produced in a year, it is not a priori clear which of the two designs would produce more transport work in a year,
everything else being equal. But if the tonne-km’s are not equal, the question is, how can these designs be made to produce the same tonne-km’s in a year? Or, how can the denominator be made common?
One obvious way to accomplish this is by adjusting speed, that is, compute how much ship A’s speed has to be in order for tonne-km’s to be the same for both designs. However, we decided that speeds (and hence power plants and installed horsepowers) should be kept the same, so as to keep the differences among the two designs to a minimum. After all, ships will proceed at the maximum speed that their specification would allow (which for the two examined designs is very similar), or they will proceed at speeds dictated by the economic environment (price of fuel vs. freight earned). But if speeds are the same, the only way to equalize tonne-km’s in a year is to adjust the number of ships in the fleet. We shall thus compute how many more (or less) ships A are required at any point in time so that total tonne-km’s in a year are the same among the two designs, and we shall call this ‘the additional ships factor’. This factor can be fractional, with the understanding that if
it is (say) 1.001, then one additional ship A would be required at any point in time alongside a fleet of 1,000 ships of type A, so as to produce the same tonne-km’s as 1,000 ships of type B. Note that this has nothing to do with the fact that the life-time of ship A is 20 years and that of ship B is 30 years, as it only reflects the number of ships that are operational at any point in time.
5.2 Operational CO2 emissions
The most straightforward type of CO2 emissions that can be calculated are emissions generated while the ship is in operation through its lifetime. Here we assume for both ship types that, given each ship’s operational days per year, 70% of that time is spent at sea and 30% in port. Daily fuel consumptions at sea and in port are assumed known and are the same for both types, and so are the ship’s speeds. No operational emissions are assumed during each ship’s idle time (365 days minus operational days).
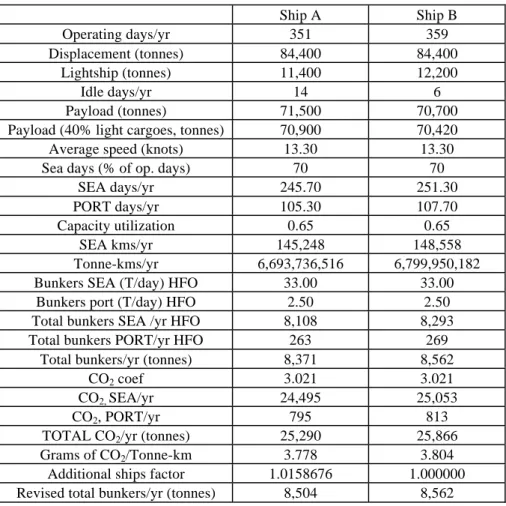
The results of the comparison are shown in Table 1 for the Panamax case and Table 2 for the Handymax case.
Table 1: Operational CO2 emissions, Panamax ships
Ship A Ship B Operating days/yr 351 359 Displacement (tonnes) 84,400 84,400 Lightship (tonnes) 11,400 12,200 Idle days/yr 14 6 Payload (tonnes) 71,500 70,700
Payload (40% light cargoes, tonnes) 70,900 70,420
Average speed (knots) 13.30 13.30
Sea days (% of op. days) 70 70
SEA days/yr 245.70 251.30
PORT days/yr 105.30 107.70
Capacity utilization 0.65 0.65
SEA kms/yr 145,248 148,558
Tonne-kms/yr 6,693,736,516 6,799,950,182
Bunkers SEA (T/day) HFO 33.00 33.00
Bunkers port (T/day) HFO 2.50 2.50
Total bunkers SEA /yr HFO 8,108 8,293
Total bunkers PORT/yr HFO 263 269
Total bunkers/yr (tonnes) 8,371 8,562
CO2 coef 3.021 3.021
CO2, SEA/yr 24,495 25,053
CO2, PORT/yr 795 813
TOTAL CO2/yr (tonnes) 25,290 25,866
Grams of CO2/Tonne-km 3.778 3.804
Additional ships factor 1.0158676 1.000000
Revised CO2/yr (tonnes) 25,691 25,866
Revised tonne-kms/yr 6,799,950,182 6,799,950,182
Life cycle yrs 20 30
No. of cycles in 60 yrs 3 2
Tonne-kms in 60 yrs 407,997,010,937 407,997,010,937
SUBTOTAL 1, CO2 in 60 yrs
(tonnes) 1,541,468 1,551,975
Table 2: Operational CO2 emissions, Handymax ships
Ship A Ship B Operating days/yr 353 360 Displacement (tonnes) 54,600 54,600 Lightship (tonnes) 8,087 8,700 Idle days/yr 12 5 Payload (tonnes) 45,000 44,400
Payload (40% light cargoes, tonnes) 43,800 43,440
Speed (knots) 13.30 13.30
Sea days (% of op. days) 70 70
SEA days/yr 247.10 252.00
PORT days/yr 105.90 108.00
Capacity utilization 0.65 0.65
SEA kms/yr 146,075 148,972
Tonne-kms/yr 4,158,762,101 4,206,371,043
Bunkers SEA (T/day) HFO 30.50 30.50
Bunkers port (T/day) HFO 2.50 2.50
Total bunkers SEA /yr HFO 7,537 7,686
Total bunkers PORT/yr HFO 265 270
Total bunkers/yr (tonnes) 7,801 7,956
CO2 coef 3.021 3.021
CO2, SEA/yr 22,768 23,219
CO2, PORT/yr 800 816
TOTAL CO2/yr (tonnes) 23,568 24,035
grams of CO2/Tonne-km 5.667 5.714
additional ships factor 1.0114479 1.000000
revised total bunkers (tonnes) 7,891 7,956
revised CO2/yr (tonnes) 23,838 24,035
revised tonne-kms/yr 4,206,371,043 4,206,371,043
life cycle yrs 20 30
no. of cycles in 60 yrs 3 2
tonne-kms in 60 yrs 252,382,262,566 252,382,262,566
SUBTOTAL 1, CO2 in 60 yrs
(tonnes) 1,430,252 1,442,105
Notes:
1. Operating days and lightship weights for each ship have been calculated according to the analysis presented in the Appendix (see Tables 8 and 9).
2. The calculations are based on an estimated actual payload for each ship which is slightly less than the maximum payload. The reason is that such ships often carry light cargoes and thus the holds’ available cubics are fully utilized before reaching the maximum deadweight draft mark. Such cargoes are wheat, coals, etc. Furthermore such ships often load or discharge at ports of reduced draft. Past data from the Greek shipping industry indicates that at least 40% of the loaded cargoes involve light ones or ports and channels of reduced draft. Thus the used actual payloads of the tables use this percentage and assume that, in case of light cargoes, the achieved maximum payload for Panamax is 70,000 tons whereas for Handymax 42,000 tons
3. Ship capacity utilization is estimated at 65% on the average, taking into account possible route triangularization, meaning that 65% of sea time is laden and 35% is on ballast.
4. Bunker consumptions at sea and in port are taken from data collected in the context of an emissions study funded by the Hellenic Chamber of Shipping (see Psaraftis and Kontovas (2009)).
5. The CO2 coefficient (tonnes of CO2 per tonne of fuel consumed) is taken from the latest update of the IMO Greenhouse Gas (GHG) study (Buhaug et al, 2008).
6. A common ‘super-life cycle’ of 60 years is assumed as the least common multiple of the 20-year life cycle of ship A and the 30-20-year life cycle of ship B. There will be three cycles of ship A and two cycles of ship B within this period.
One can observe from the above tables that the life cycle environmental performance of ship A is better than that of ship B, if only CO2 due to fuel burned through the ship’s lifetime operation is taken into account. The difference amounts to less than 600 tonnes of CO2 per ship per year for the Panamax ship and to less 200 tonnes of CO2 per ship per year for the Handymax ship, but it is a positive difference in favor of Ship A. However, this only accounts for the operational phase of a ship’s lifetime. Additional CO2 emissions will be produced during the ship’s lifetime, not connected to the ship’s operation but due to activities related to (list is not exhaustive):
• Steel fabrication • Shipbuilding • Repairs • Recycling
• Transport of raw materials and steel In the sections that follow we shall attempt to look into each of these activities, by making some estimates that we think are on the conservative side (that, is, underestimate total emissions, and, as such, favor ship A vis-à-vis ship B).
5.3 CO2 emissions due to steel fabrication
CO2 produced at the steel fabrication stage is assumed to be 1.75 tonnes for each tonne of steel produced (Oxera, 2004). This accounts only for emissions produced at the steel mill, and does not account for emissions due to:
• Mining of the raw materials (iron ore, coal, limestone or other)- these emissions will not be examined here, but can be substantial
• Transport of these raw materials to the steel mill (various modes will generally be involved, including the maritime one)- these are included into the ‘transport of raw materials’ emissions, see below
• Transport of steel from the steel mill to the shipyard- these are included into the ‘shipbuilding’ emissions, see below
• Cutting and welding of the steel and other energy use to fabricate the ship- these are also included into the ‘shipbuilding’ emissions, see below It should be mentioned that the factor of 1.75 is likely to be encountered in ‘state-of-the-art’ steel facilities, but can be higher if this is not the case. Also, the fact that emissions due to mining of raw materials are not taken into account means that the factor of 1.75 quite likely underestimates this component of emissions.
5.4 CO2 emissions due to shipbuilding
This involves shipyard energy use for various reasons (electricity for equipment and offices, welding, gas heating, gas cutting, transport of plates and equipment, sea trials of ship, etc). Kameyama et al (2004) estimate CO2 due to yard activities, including electricity, welding, cutting and plate forming, transport within the yard, etc, at 11% of total CO2, the rest (89%) being attributed to steel production. Therefore one can use a factor of 1.75*11/89 = 0.216 per tonne of steel processed at the yard.
5.5 CO2 emissions due to repairs
Here we are talking about repairs for steel replacement only, as all other repairs are assumed to be the same. Emissions due to fabrication of this steel are accounted for in section 5.3 above. These repairs involve all shipyard-related activities to cut, transport and weld the replacement plates on the ship. As some 43% of the CO2 directly emitted at the shipyard is due to sea trials (Kameyama et al, 2004), the rest (57%) amounts to 0.216*0.57 = 0.123 tonnes of CO2 per tonne of steel. In addition to that, we have to account for cutting off the old steel from the ship, assumed to be of equal weight to the replacement steel . Data
from specialized Greek repair companies (e.g. NAVEP Ltd) indicate that cutting one tonne of steel uses some 60 kg of liquid propane (C3H8). That produces exactly 3 times as much CO2 in weight, therefore the CO2 factor for cutting can be estimated to be 0.18 per tonne of steel cut. Thus, the total CO2 factor for repairs is estimated at 0.123+0.18 = 0.303 per tonne of replacement steel.
5.6 CO2 emissions due to recycling
As regards recycling, this activity involves cutting of steel plates, of weight equal to the
lightship. We use the same CO2 factor of 0.18 per tonne of steel cut, as in the previous section. Emissions due to remelting the recycled steel are not taken into account, therefore the factor of 0.18 is likely to underestimate this component of emissions. Emissions due to transporting the recycled steel to the steel mill are accounted for in the next section.
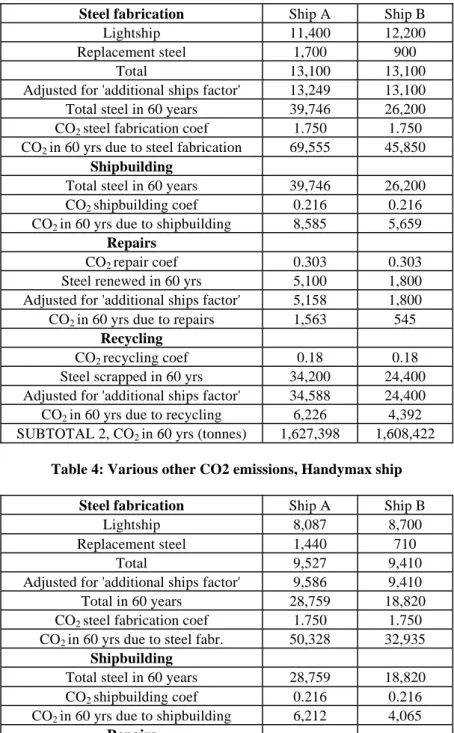
Tables 3 and 4 summarize the calculations of sections 5.3 to 5.6 for the two sizes of ships and present new CO2 subtotals.
Table 3: Various other CO2 emissions for Panamax ship
Steel fabrication Ship A Ship B
Lightship 11,400 12,200
Replacement steel 1,700 900
Total 13,100 13,100
Adjusted for 'additional ships factor' 13,249 13,100
Total steel in 60 years 39,746 26,200
CO2 steel fabrication coef 1.750 1.750
CO2 in 60 yrs due to steel fabrication 69,555 45,850 Shipbuilding
Total steel in 60 years 39,746 26,200
CO2 shipbuilding coef 0.216 0.216
CO2 in 60 yrs due to shipbuilding 8,585 5,659 Repairs
CO2 repair coef 0.303 0.303
Steel renewed in 60 yrs 5,100 1,800
Adjusted for 'additional ships factor' 5,158 1,800
CO2 in 60 yrs due to repairs 1,563 545
Recycling
CO2 recycling coef 0.18 0.18
Steel scrapped in 60 yrs 34,200 24,400
Adjusted for 'additional ships factor' 34,588 24,400 CO2 in 60 yrs due to recycling 6,226 4,392 SUBTOTAL 2, CO2 in 60 yrs (tonnes) 1,627,398 1,608,422
Table 4: Various other CO2 emissions, Handymax ship Steel fabrication Ship A Ship B
Lightship 8,087 8,700
Replacement steel 1,440 710
Total 9,527 9,410
Adjusted for 'additional ships factor' 9,586 9,410
Total in 60 years 28,759 18,820
CO2 steel fabrication coef 1.750 1.750
CO2 in 60 yrs due to steel fabr. 50,328 32,935 Shipbuilding
Total steel in 60 years 28,759 18,820
CO2 shipbuilding coef 0.216 0.216
CO2 in 60 yrs due to shipbuilding 6,212 4,065 Repairs
CO2 repair coef 0.303 0.303
Steel renewed in 60 yrs 4,320 1,420
Adjusted for 'additional ships factor' 4,347 1,420
CO2 in 60 yrs due to repairs 1,317 430
Recycling
CO2 recycling coef 0.18 0.18
Steel scrapped in 60 yrs 24,261 17,400
Sdjusted for 'additional ships factor' 24,412 17,400 CO2 in 60 yrs due to recycling 4,394 3,132 SUBTOTAL 2, CO2 in 60 yrs (tonnes) 1,492,503 1,482,667
5.7 CO2 emissions due to transport of raw
materials and steel
Finally as regards emissions generated from the transport of the raw materials needed to produce the steel of these ships, including steel renewal, we assume a ‘raw materials’ factor of 2.66, that is, for every tonne of steel to be produced, 2.66 tonnes of raw material (iron ore, coal, limestone, etc) are needed (Worldsteel, 2009). As an illustration, we assume that these raw materials are hauled by ship only, over an average distance of 3,484 nautical miles (6,452 km), corresponding to a trip from Port Hedland, Australia, to Busan, Korea. The amount of raw materials to be hauled correspond to the ‘super-life cycle’ of 60 years. Also we assume that the ‘carbon footprint’ of the ships that carry these raw materials is 4 grams of CO2 per tonne-km (that would correspond to a large bulk carrier). Similar calculations pertain to recycling. The transport of the steel that is scrapped from the
scrap yard to the steel mill would burn some CO2. How much, depends on the distance. If the steel furnace is in India or Bangladesh, then the distance is short, but then one would have to haul the steel to China, Korea or Japan. If one hauls the scrap metal over a long distance to the steel mill, it will again burn CO2 to haul it. So either way some steel will have to be hauled. Again as an illustration we assume an average distance of 4,136 nautical miles (7,760 kms), corresponding to a trip from Chittagong, Bangladesh, to Dalian, China. Either way we assume that the amount of steel to be hauled is the lightship steel for the two ship types, over 60 years. Again we assume a 4 grams of CO2 per tonne-km carbon footprint for the ship that would transport this steel.
The resulting calculations are shown in Tables 5 and 6, which also present the total CO2 emissions.
Table 5: CO2 emissions from the transport of raw materials and steel, Panamax ship
Transport of raw materials and steel Ship A Ship B
Lightship steel needed in 60 yrs 39,746 26,200
Steel renewed in 60 yrs 5,158 1,800
Total steel in 60 years 44,904 28,000
Raw materials factor 2.66 2.66
Raw materials for total steel 119,444 74,480
Average distance (km) 6,452 6,452
Tonne-kms for raw materials 770,654,413 480,544,960
Grams CO2 per tonne-km of ship to transport raw
materials or steel 4.00 4.00
Tonnes CO2 for raw materials 3,083 1,922
Average distance (km) for scrap 7,760 7,760
Tonne-kms for scrap 308,428,837 203,312,000
Tonnes CO2 for scrap 1,234 813
TOTAL CO2 for transport of raw materials and steel 4,316 2,735
Table 6: CO2 emissions from the transport of raw materials and steel, Handymax ship
Transport of raw materials and steel Ship A Ship B
Lightship steel needed in 60 yrs 28,759 18,820
Steel renewed in 60 yrs 4,347 1,420
Total steel in 60 years 33,106 20,240
Raw materials factor 2.66 2.66
Raw materials for total steel 88,062 53,838
Average distance (km) 6,452 6,452
Tonne-kms for raw materials 568,176,602 347,365,357
Grams CO2 per tonne-km of ship to transport raw
materials or steel 4.00 4.00
Tonnes CO2 for raw materials 2,273 1,389
Average distance (km) for scrap 7,760 7,760
Tonne-kms for scrap 223,170,812 146,043,200
tons CO2 for scrap 893 584
TOTAL CO2 for transport of raw materials and steel 3,165 1,974 TOTAL CO2 in 60 yrs (tonnes) 1,495,669 1,484,641 It is important to point out that, even though
these results seem to be marginal on a per ship basis (a difference on the order of 1% between ship A and ship B), they can be substantial overall if we take into account the number of ships in the fleet. In 2007, and according to the Lloyds-Fairplay ship database, there were
some 1,383 Panamax ships and some 1,732 Handymax ships in the world fleet (among a total of 6,462 dry bulk carriers). Assuming an identical performance of all ships in the fleet per size bracket, Table 7 summarizes the total CO2 produced by these fleets over 60 years and on a per year basis.
Table 7: Fleet CO2 statistics
PANAMAX Ship A Ship B
Number of ships in fleet (2007) 1,383 1,383
Fleet CO2 in 60 yrs (tonnes) 2,256,660,347 2,228,230,597
Per year (tonnes) 37,611,006 37,137,177
Difference per year (tonnes) 473,829
Grams of CO2 per tonne-km 3.999 3.949
HANDYMAX
Number of ships in fleet (2007) 1,732 1,732
Fleet CO2 in 60 yrs 2,590,498,344 2,571,397,475
Per year 43,174,972 42,856,625
Difference per year (tonnes) 318,348
Grams of CO2 per tonne-km 5.926 5.883
Finally we should mention that for this analysis to be complete, several more issues could be examined. For example type A ships will require several more paints which produce CO2 and volatile compounds to manufacture and apply. Such refinement could be the scope of future work; however it is clear that due to the increased resources required for type A ships, such considerations will only increase the environmental difference between the two ship types in favor of ship B.
6. CONCLUSIONS
Based on the results shown above, it can be safely concluded that for both the Panamax and Handymax sizes, the life cycle environmental performance of ship B is better than that of ship A, at least as far as CO2 is concerned. It is speculated that similar results also hold for other ship sizes and types. Just for these two ship sizes, and based on the sizes of the current fleet, operating ship of type A would produce about 790,000 tonnes of CO2 per year more than if ship B were used instead.
790,000 tonnes is not a negligible quantity. Percentage-wise the difference may not be substantial globally, but at least the comparison serves to disprove the statement that ship B is environmentally worse than ship A by carrying ‘steel ballast’. Moreover, stronger corrosion margins are likely to contribute to a better life cycle safety performance of ship B versus ship A.
It can also be seen that for both these sizes total CO2 emissions in a ship’s life cycle are some 5-6% higher than operational CO2 emissions alone, even though in our opinion the real level of non-operational emissions has been underestimated in our paper and these are likely to he higher. As world fleet current operational emissions are estimated on the order of a billion tonnes per year (Buhaug et al (2008) and Psaraftis and Kontovas (2009)), 5-6% is some 50-60 million tonnes of additional CO2 per year, to the extent the same percentage is true globally. Similarly, 1% (the difference between ship A and ship B), to the extent it is also true for other ship types and sizes, is some 10 million tonnes of CO2 per year. These may be small percentages, but worthy of note in absolute terms.
REFERENCES
Buhaug, Ø., J.J. Corbett, Ø. Endresen, V. Eyring, J. Faber, S. Hanayama, D.S. Lee, D. Lee, H. Lindstad, A. Mjelde, C. Pålsson, W. Wanquing, J.J. Winebrake, K. Yoshida, (2008). ‘Updated Study on Greenhouse Gas Emissions from Ships: Phase I Report’. International Maritime Organization (IMO) London, UK, 1 September, 2008 (included as Annex in IMO document MEPC 58/INF.6). Kameyama, M., K. Hiraoka, A. Sakurai, T. Naruse, H. Tauchi (2004), “Development of LCA software for ships and LCI analysis based on actual shipbuilding and operation,” Proceedings of The 6th International Conference on EcoBalance, Oct.25-Oct. 27, Tsukuba, Japan、pp159-162.
Gratsos, G, P. Zachariadis (2005), “The Life Cycle Cost of maintaining the effectiveness of a ship’s structure and environmental impact of ship design parameters” Royal Institution of Naval Architects (Transaction papers of 18/19 October 2005).
Oxera (2004), “CO2 emissions trading: How will it affect UK industry?” report available at www.oxera.com
Psaraftis, H.N. & Kontovas, C.A. (2009).
‘CO2 Emissions Statistics for the World
Commercial Fleet’, WMU Journal of Maritime
Affairs 8(1), pp.1-25.
Worldsteel (2009): web site of World Steel Association (www.worldsteel.org)
Various IMO documents
MSC 81/6/4, “Japan’s position on goal-based new ship construction standards,” document submitted by Japan for MSC 81, 7 March 2006.
MSC 81/6/17, “Life cycle cost and environmental impact,” document submitted by Greecce for MSC 81, 21 March 2006.
AUTHORS BIOGRAPHIES
George A. Gratsos is President of the Hellenic Chamber of Shipping, on the Board of Directors of the Union of Greek Shipowners and alternate Chairman of the Maritime Safety and Maritime Environment Protection Committee of the UGS, member of the board of the UK FREIGHT DEMMURAGE AND DEFENCE ASSOCIATION LTD LONDON and HELMEPA. He is a Member of ABS, member of the Hellenic Committee of ABS, the Hellenic Committee of DNV, the Hellenic Technical Committee of LRS, past Vice-President, member of the Executive Committee and on the Board of Directors of BIMCO and on the Board of Directors of the (Hellenic) Tourist Development Company. Mr. Gratsos is a third generation shipowner, President of STANDARD BULK TRANSPORT CORPORATION, operating Panamax bulk carriers, and ELASIS (a real estate and construction company). He is a Naval Architect with a BSc from MIT.
Harilaos N. Psaraftis is Professor of Maritime Transport at the School of Naval Architecture and Marine Engineering (NA&ME) of the National Technical University of Athens (NTUA), Greece. He has a diploma from NTUA (1974), and two M.Sc. degrees (1977) and a Ph.D. (1979) from the Massachusetts Institute of Technology (MIT). He has been a
faculty member at MIT from 1979 to 1989. He was the chairman of the International Symposium on Maritime Safety, Security and Environmental Protection (Athens, 2007) and has also chaired several other conference sessions and clusters on topics such as intermodal transport, maritime transport, ports, vehicle routing, and logistics. He has been a member of the Greek delegation to the IMO (MSC and MEPC) since 2006. Since 2007 he is the coordinator of an MEPC correspondence group on environmental risk evaluation criteria and since 2009 he is a member of the MSC Group of Experts on Formal Safety Assessment. Psaraftis also served as CEO of the Piraeus Port Authority (OLP) from 1996 to 2002.
Panos Zachariadis is Technical Director of Atlantic Bulk Carriers Management Ltd, an operator of 23 bulk carriers. From 1984 to 1997 he was Marine Superintendent for a New York bulk carrier and oil tanker shipping
company. His shipping experience spans diverse areas such as sea service in bulk carriers and oil tankers, supervision of dry dock repairs, new building specifications and supervision, ship operations and chartering. For several years he has been a regular member of the Greek delegation to IMO as technical advisor. Mr. Zachariadis holds a BSc degree in Mechanical Engineering from Iowa State University and a MSE degree in Naval Architecture and Marine Engineering from the University of Michigan. Memberships include the American Society of Mechanical Engineers, SNAME, BIMCO Marine Committee, ABS European Technical Committee, LR Hellenic Technical Committee, Union of Greek Shipowners Maritime Safety and Marine Environment Protection Committee, Hellenic Chamber of Shipping Technical Committee, BoD and founding member Marine Technical Managers Association (MARTECMA) of Greece.
APPENDIX TABLE 8
STEEL RENEWAL SCENARIOS
SHIP A: As per IACS new proposed CSR (final version) corrosion margins Panamax Lightship 11,400 MT
Handymax Lightship 8,100 MT
Max expected Lifetime 20 years (due to reduced corrosion margins necessitating expensive repairs - see write up). Specified corrosion margins are overall less than half of those required for 25 year lifetime (based on corrosion rates experience, past studies and pre-CSR class regulations). It follows that such margins will be exhausted much earlier than the design life, at which time major steel replacement will be required.
A major improvement of final CSR corrosion margins from the first draft of CSR was the increased margins for hold bulkheads and lower hold areas. However the inadequate corrosion margins for side shell and ballast tank internals, and to a smaller extent, hold frames, increase repairs at year 15 on dramatically. The possibility of a CSR ship economic life extending beyond 20 years is still very remote, since at year 20 extensive replacements of deck, sides and bottom shell will be required (thousands of tons).
Estimated Steel Replacement of Ship A: Age for Panamax for Handymax
10 50+ MT 50+ MT Some frames, bal. internals
13 170+ MT 140+ MT Some Frames, various ballast internals, top hoppers 15 480+ MT 400+ MT Various, some upper side shell, ballast internals, underdecks 18 1,000+ MT 850+ MT Various ballast, substantial side shell, some deck, some bottom Total 1,700+ MT 1,440+ MT (conservative estimate with very good maintenance)
Scrapping dictated by financial necessity at 20 years.
SHIP B: To arrive at the lightship and performance of ship B there are two alternative but equivalent methods. One is to start with a ship built to pre-CSR scantlings and proceed to upgrade the corrosion margins of certain needed areas. The other way is to start with a CSR scantlings ship and upgrade its corrosion margins as needed (based on past studies and experience).
First method: We start with a vessel built as per old regulations with corrosion margins of some parts upgraded for same lifetime as the rest of the ship (which with maintenance can be 27 years, scrapping at 30 years, see write up). I.e. the ship has overall similar corrosion margins with the pre-CSR ships (typically equivalent to 20-25% of original plate thickness) with increases in some areas where the pre-CSR margins had proved inadequate as follows: Hold frames: increase corrosion allowance by 80-90% (almost double). All height of hold transverse Bulkheads, underdecks, tank internals (selected), tanktops, double bottom longitudinal bulkheads: increase allowance by about 50%. Hold hoppers top and bottom: increase by abt. 40%, and various other selected increases.
EXTRA WEIGHT for 30 year lifetime of a pre-CSR ship (PANAMAX EXAMPLE): FRAMES (3 mm extra): 70 mt
TANKTOP (3 mm extra): 100 mt H.BULKHD (2 mm extra): 35 mt UNDERDECK (3 mm extra): 35 mt DECK LONG. (3 mm extra): 25 mt HOPPERS (2 mm extra): 85 mt BAL. SCANTL. (selected): 100 mt TOTAL : 450 mt
Lifetime 27 years + (actual 30 years)
Second Method: We proceed to incorporate the IACS new CSR scantlings but with all corrosion margins upgraded for 25 year lifetime as follows.
CSR PROVIDED REQUIRED EXTRA WEIGHT (MT) CORR MARGIN CORR MARGIN PANAMAX HANDY
HOLD FRAMES FROM 4.5 MM TO 7 MM 60 40
TANKTOP FROM 5.5 MM TO 7.5 MM 65 42
TOP HOPPERS FROM 3.5 MM TO 7 MM 80 55
BOTTOM HOPPERS FROM 5.5 MM TO 7 MM 28 20
LOWER BULKHEADS FROM 6.5 MM TO 7 MM 4 3
STOOLS/UDECKS FROM 4.0 MM TO 7 MM 40 28
SIDE SHELL FROM 3.5 MM TO 5 MM 88 74
HOLD SHELL FROM 3.5 MM TO 5 MM 38 27
DECK FROM 4.0 MM TO 5.5 MM 50 40
BOTTOM FROM 3.0 MM TO 5 MM 80 65
U/DECK LONGIT. FROM 4.0 MM TO 6 MM 16 11
GIRDERS/FLOORS FROM 3.0 MM TO 5.5 MM 114 96
TOP SIDE WEBS FROM 3.5 MM TO 5.5 MM 63 45
OTHER BALLAST FROM 3.0 MM TO 5.5 MM 72 54
TOTAL 800 600 Panamax Lightship at 12,200 MT
Handymax Lightship at 8,700 MT
Note that to arrive at a 30 year lifetime ship, a Panamax pre-CSR ship needs 450 metric tons
(see above) of additional corrosion margins, whereas a current CSR ship needs nearly double
that amount (800 MT).
ESTIMATED STEEL REPLACEMENT OF SHIP B (In 30 years): for Panamax for Handymax
Age 13 0 MT 0 MT “ 15 20 MT 20 MT
“ 18 80 MT 50 MT Internals
“ 20 120 MT 80 MT Some frames, various “ 23 180 MT 150 MT Frames, bulkheads, internals “ 25 200 MT 160 MT Various
“ 28 300 MT 250 MT Various Total: 900 MT 710 MT
Scrapping age 30+ years, if it is possible to employ the ship further. If scrapping is done at 25 years, then only 400 mt of repairs estimated will have been carried out for the Panamax and 300 mt for the Handymax.
TABLE 9
DOWN TIMES DUE TO DRYDOCKINGS AND STEEL REPAIRS Notes
1. For good maintenance, it is assumed that owner elects to drydock ships at years 3 and 8, even though current regulations permit skipping these drydocks.
2. Steel replacement is assumed in China due to lower costs. A 7 ton/day steel replacement rate is assumed. This rate can vary for small or large pieces from 5 to 10 or even 12 tons per day for some good yards. However the popularity of Chinese yards has resulted in yard overbookings and thus usual waiting delays for the arrived ship. This is not expected to change in the near to medium term future since more ships are being delivered whereas new yard construction in China has stalled. Thus a 7 ton/day production rate is considered a good average even for large repairs.
SHIP A
PANAMAX HANDYMAX
YEAR STEEL DOWNTIME STEEL DOWNTIME MT DAYS MT DAYS 01 02 03 9 9 04 05 9 9 06 07 08 9 9 09 10 50 9 50 9 11 12 13 170 24 140 20 14 15 480 69 400 54 16 17 18 1000 143 850 121 19 20 --- TOTAL 1700 272 1440 234THUS PANAMAX A REPAIR DAYS = 272 IN 20 YRS = 14 D/YR -> THUS OPER DAYS 351 HANDY A REPAIR DAYS = 234 IN 20 YRS = 12 D/YR -> THUS OPER DAYS 353
SHIP B
PANAMAX HANDYMAX
YEAR STEEL DOWNTIME STEEL DOWNTIME MT DAYS MT DAYS 01 02 03 9 9 04 05 9 9 06 07 08 9 9 09 10 9 9 11 12 13 9 914 15 20 9 20 9 16 17 18 80 12 50 9 19 20 120 17 80 11 21 22 23 180 26 150 21 24 25 200 29 160 23 26 27 28 300 43 250 36 29 30 --- TOTAL 900 181 710 154
THUS PANAMAX B REPAIR DAYS = 181 IN 30 YRS = 6 D/YR -> THUS OPER DAYS 359 HANDY B REPAIR DAYS IN 30 YRS = 154 = 5 D/ YR -> THUS OPER DAYS 360/YR