ENGINEERING GUIDELINES FOR THE EVALUATION OF HYDROPOWER PROJECTS
CHAPTER 11 - ARCH DAMS
Federal Energy Regulatory Commission
Division of Dam Safety and Inspections
Washington, DC 20426
TABLE OF CONTENTS 11-1 INTRODUCTION... 11-1 11-1.1 Purpose... 11-1 11-1.2 Applicability... 11-1 11-1.3 Definition of Safety... 11-2 11-1.4 Evaluation Criteria ... 11-3 11-1.4.1 Review of Existing Data and Site Inspection... 11-3 11-1.4.2 Method of Analysis ... 11-4 11-1.4.3 Evaluation for Static Loading ... 11-4 11-1.4.4 Evaluation for Seismic Loading... 11-6 11-1.4.5 Sliding Stability ... 11-7 11-2 FOUNDATION CONSIDERATIONS... 11-9 11-2.1 General ... 11-9 11-2.2 Field Investigations ... 11-9
11-2.2.1 Foundation Features that Create Stability Concerns and
Warning Signs ... 11-9 11-2.3 Material Parameter Selection ... 11-12
11-2.3.1 Shear Strength of Foundation Interface ... 11-12 11-2.3.2 Shear Strength of Potential Foundation Failure Planes &
Wedges ... 11-16 11-2.3.3 Foundation Modulus of Deformation ... 11-16 11-2.4 Foundation Rock Erodibility... 11-19 11-2.4.1 Field Investigations ... 11-19 11-2.4.2 Assessing the Erodibility of Rock ... 11-20 11-2.4.3 Errosion Downstream from the Dam ... 11-32
11-3 CONCRETE MATERIAL PARAMETERS... 11-39
11-3.1 Visual Inspection of the Concrete ... 11-39 11-3.2 Ultrasonic Pulse Velocity Tests ... 11-39 11-3.3 Concrete Coring and Specimen Parameters... 11-41 11-3.4 Petrographic Examination of Concrete ... 11-41 11-3.5 Elastic Properties ... 11-42 11-3.6 Thermal Properties... 11-42 11-3.7 Strengths of Concrete... 11-43 11-3.7.1 Compressive Strength ... 11-43 11-3.7.2 Tensile Strength ... 11-43 11-3.7.3 Shear Strength ... 11-45 11-3.8 Dynamic Material Properties ... 11-46
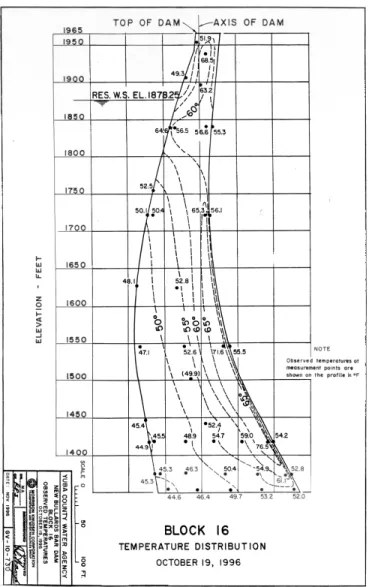
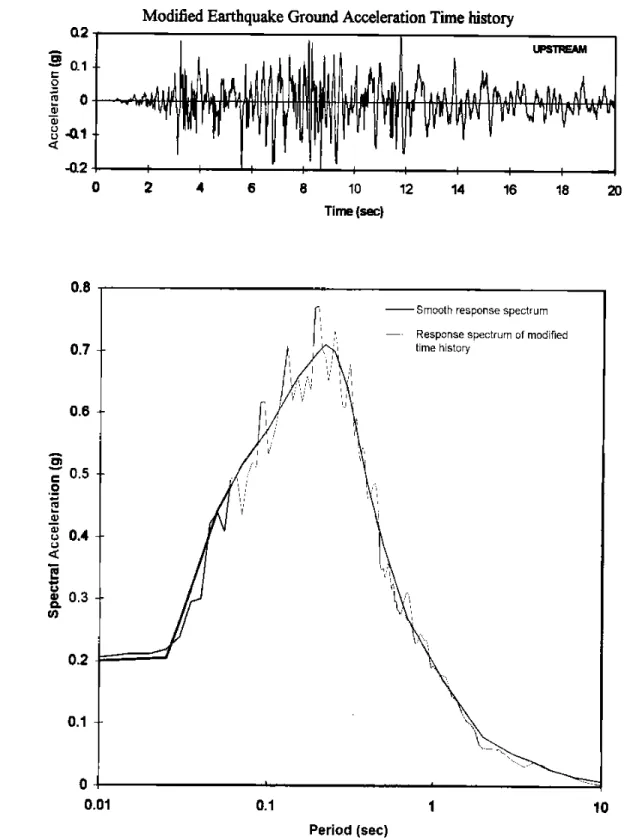
11-4 LOADING... 11-47 11-4.1 Dead Load ... 11-47 11-4.2 Hydraulic Loading ... 11-47 11-4.2.1 Normal Water Loads ... 11-47 11-4.2.2 Flood Loads... 11-48 11-4.2.3 Uplift ... 11-48 11-4.2.4 Silt Load... 11-49 11-4.2.5 Ice Load... 11-50 11-4.2.6 Hydraulic Loading of Spillways ... 11-51 11-4.3 Thermal Loading... 11-52 11-4.3.1 Temperature Distribution... 11-52 11-4.3.2 Air Temperature... 11-53 11-4.3.3 Reservoir Water Temperature... 11-54 11-4.3.4 Solar Radiation... 11-55 11-4.3.5 Concrete Temperatures ... 11-55 11-4.4 Earthquake Loading ... 11-56
11-4.4.1 Safety Evaluation Earthquakes and Associated Ground
Motions ... 11-56 11-4.4.2 Response Spectrum Earthquake Input ... 11-56 11-4.4.3 Acceleration Time History Earthquake Input ... 11-56 11-4.4.4 Spatial Variation of Ground Motion ... 11-58 11-4.5 Loading Combinations... 11-60 11-4.5.1 Usual Loading Combinations... 11-60 11-4.5.2 Unusual Loading Combinations... 11-61 11-4.5.3 Extreme Loading Combinations ... 11-62 11-5 STATIC ANALYSIS... 11-63 11-5.1 Overview... 11-63 11-5.2 Finite Element Analysis ... 11-63 11-5.2.1 Structural Modeling and Assumptions... 11-63 11-5.2.2 Application of Loads... 11-67 11-5.2.3 Presentation and Interpretation of Results ... 11-70 11-5.2.4 Evaluation of Stress Results... 11-73 11-5.3 Alternative Continuum Models... 11-74 11-5.3.1 Trial Load Method ... 11-74 11-5.3.2 Other Methods ... 11-76
11-5.4.1 Identification of Kinematically Capabale Potential Failure
Planes and Wedges... 11-77 11-5.4.2 Analysis by Stereographic Projection Procedures ... 11-78 11-5.4.3 Vectorial Analysis ... 11-78 11-5.4.4 Loads to be Considered... 11-79 11-5.4.5 Appropriate Factors of Safety ... 11-81 11-5.5 Parameter Sensitivity ... 11-82 11-5.5.1 Effects of Foundation Modulus on dam Stresses... 11-82 11-5.6 Limit State Analysis... 11-90 11-5.6.1 Sliding on the Abutment Contact... 11-90 11-5.6.2 Buckling Failure Modes... 11-92 11-6 DYNAMIC ANALYSIS... 11-94 11-6.1 Overview... 11-94 11-6.2 Finite-Element Response Spectrum Analysis ... 11-96 11-6.2.1 Structural Models... 11-96 11-6.2.2 General Principles ... 11-97 11-6.2.3 Presentation and Interpretation of Results ... 11-100 11-6.3 Finite-Element Time-History Analysis ... 11-104 11-6.3.1 Structural Models... 11-104 11-6.3.2 General Principles ... 11-105 11-6.3.3 Presentation and Interpretation of results... 11-107 11-6.3.4 Time-History Stability Analysis... 11-118 11-6.4 Alternative Analysis Techniques ... 11-119 11-6.5 Reservoir and Foundation Effects... 11-120 11-6.5.1 Dam-Water Interaction ... 11-120 11-6.5.2 Dam-Foundation Interaction ... 11-126 11-6.5.3 Direction of Ground Motions... 11-129 11-6.6 Post-Earthquake Safety Evaluation... 11-130 11-6.6.1 Evaluation for Static Loads... 11-131 11-6.6.2 Evaluation for Aftershock Events ... 11-132 11-7 INSTRUMENTATION... 11-134 11-7.1 Purpose and Need for Instrumentation... 11-134 11-7.2 Special Instrumentation Considerations for Arch Dams... 11-134 11-7.3 Frequency of Measurements ... 11-135 11-7.4 Presentation of Data and Interpretation of Readings ... 11-136 11-7.5 Comparison of Predicted and Measured Deflections... 11-136
11-7.6 Long Term Instrumentation Performance ... 11-137 11-7.7 Interpretation of Data ... 11-137 11-8 HISTORIC FAILURES - PROBLEMS... 11-140 11-8.1 Overview... 11-140 11-8.2 Landslide Case ... 11-143 11-8.2.1 Vajont Dam ... 11-143 11-8.3 Abutment Failure Cases ... 11-146 11-8.3.1 Malpasset Dam... 11-146 11-8.3.2 Experimental Plum Dam... 11-149 11-8.4 High Discharge Induced Failures... 11-151 11-8.4.1 Failures of Arch Dams ... 11-151 11-8.4.2 Damage to Stilling Basins and Plunge Pools ... 11-152 11-8.5 Earthquake Induced Damage ... 11-153 11-8.5.1 Pacoima Dam ... 11-153 11-8.5.2 Other Significant Cases... 11-158 11-8.6 Detrimental Chemical Reactions ... 11-159 11-8.6.1 Kouga Dam, South Africa... 11-162 11-8.6.2 Santa Luzia Dam, Portugal ... 11-162 11-8.6.3 Alto-Ceiro Dam, Portugal ... 11-162 11-8.6.4 Cahora-Basa Dam, Mozambique ... 11-163 11-8.6.5 Gene Wash and Copper Basin Dmas, California... 11-163 11-8.6.6 Horse Mesa Dam, Arizona... 11-164 11-8.6.7 Owyhee Dam, Oregon... 11-164 11-8.6.8 N'Zilo Dam, Zaire ... 11-165 REFRENCES ... 11-166
ENGINEERING GUIDELINES FOR THE EVALUATION OF HYDROPOWER PROJECTS
CHAPTER 11 - ARCH DAM 11-1 INTRODUCTION
11-1.1 Purpose
This chapter of the Guidelines provides guidance on the criteria and procedures used by the FERC to evaluate the safety and structural integrity of existing arch dams under its jurisdiction. The intent of this guidance is to outline criteria and evaluation procedures including foundation considerations, material properties and testing, loading, methods of analyses, and predicted and observed performance that provide the basis for review and approval of the analysis and inspection studies submitted to the FERC.
The material presented in this chapter assumes that the reader has a general knowledge and understanding of the basic principles of arch dams, i.e., how they are designed, con-structed, operated, and maintained. For detailed discussions on design and a better under-standing of the arch dam behavior, consult the US Bureau of Reclamation "Design of Arch Dams," (USBR 1977) and the US Army Corps of Engineers EM 1110-2-2201 "Arch Dam Design," (COE 1994) ," (USBR 1977). This chapter presents much information. The intent of this chapter not to mandate new analyses and investigations regardless of whether or not they are needed. Rather, the variety of issues addressed and computation methods put forward are an attempt to anticipate the variety of problems that could be encountered. This chapter should not be interpreted as requiring every test, analysis, and investigation that it describes at every dam. It may well be that for a given dam, specific failure mechanisms suggested in this chapter are not pertinent. Analysis of arch dam safety should always start with simple analysis techniques and conservative assumptions. If simple analyses indicate problems, more complicated and rigorous analyses may be in order.
11-1.2 Applicability
This guidance is applicable to FERC engineers and licensees engaged in the safety evalu-ation of existing arch dams. The design of new arch dams should follow the guidance and criteria of the references (USBR, 1977 and COE, 1994) , but could also benefit from the evaluationphilosophy presented in this chapter.
11-1.3 Definition of Safety
Safety is defined as their adequacy against an uncontrolled release of reservoir water. The structural integrity is maintained and the dam is considered safe if overstressing, sliding, and other possible modes of failure will not occur. A safety evaluation, therefore, should identify all significant failure modes and conduct appropriate analyses to assure that the structural stability of the dam is maintained.
Overstressing of concrete arch dams may exhibit a tendency toward developing a partial failure, if large tensile stresses from the linear-elastic analysis indicate extensive joint opening and cracking . Considering that the ultimate load-resisting capacity of an arch dam is limited by the compressive strength of the concrete (unless foundation or other mode of failures occur first), severe and widespread joint opening and cracking might eventually exhaust the capacity of the concrete to carry compression due to subsequent load redistributions, or might form surfaces along which partial sliding could occur. Whether such partial failures could actually occur is unknown, because they have not been observed previously, and also because of the inherent redundancy in arch dams and the fact that arch action might restrain movements of the portions separated by joint opening and cracking.
With respect to sliding failures, two types of potential foundation sliding instability cases should be considered. The first type is potential sliding of rock wedges within the foun-dation and in contact with the dam, and the second is potential sliding along the contact between the dam and foundation rock. The sliding of rock wedges typically occurs along one potential failure plane (plane sliding) or along the line of intersection of two of these planes (wedge sliding). For a rock wedge to be kinematically capable of failure, the di-rection of sliding must intersect or "daylight" a free surface downstream from the dam. While an arch dam might be capable of bridging a small unstable foundation block at the bottom, large, unstable wedges of rock in the abutments could endanger the safety of the dam. In fact, the first failure of an arch dam at Malpasset Dam in 1959 resulted from dis-placements of a large wedge of rock in the left abutment.
Sliding stability along the dam-foundation contact of a concrete arch dam is less likely because of the wedging produced by arch action and embedment of the structure into the rock. However, arch dams with relatively flat abutment slopes, or arch dams with abut-ment thrust blocks supported by rock foundations with inadequate shear strength could be
Other cases requiring special considerations include structural deformations and deterio-ration of concrete caused by alkali-aggregate reactions, and foundation or abutment ero-sion due to overtopping, which if severe, could lead to instability.
11-1.4 Evaluation Criteria
Existing concrete arch dams should be evaluated by conducting a review and analysis of all existing data, a field inspection, and any analyses necessary to determine the safety of the dam for continued normal operation and resistance against the unusual and extreme loading conditions.
11-1.4.1 Review of Existing Data and Site Inspection
A thorough knowledge must first be gained on a dam's original design and its perform-ance history and records, to provide a basis for evaluation and any further studies that might be required. The existing data for review can be obtained from the owner's files or from the files maintained by the FERC. The review should reveal whether the original design criteria and assumptions, materials investigations, geological and seismological studies, and design analyses are satisfactory based on the current practice, and if not, whether they are acceptable. The same should also be applied to any modifications or al-terations in design and on any subsequent analyses, investigations, or reviews. Of par-ticular value are data on instrument readings that provide information on actual perform-ance of the dam.
It is sometimes difficult to locate historic data from older projects. In addition to the owner’s and FERC’s files, other sources may include articles in periodicals and technical journals, state dam safety engineer’s files, consultant’s records, construction contractor’s records and personal files of individuals who worked on the project.
After completion of the review of existing data, a site inspection should be carried out to observe the present condition of the dam, and to resolve any discrepancy that may exist concerning available data such as drawings, instrument data, and other pertinent informa-tion. The inspection should also provide the opportunity to identify any cracks, deterio-rated joints, and other distress conditions that need to be considered in the evaluation of dam safety.
In some cases, an adequate determination of dam safety might be possible from the re-view and analysis of existing data and field observations. If the rere-view and observations indicate that additional analyses are required, then these analyses should be performed as follows:
11-1.4.2 Method of Analysis
Three dimensional finite-element analysis is preferred for the static and dynamic analysis of arch dams. Trial load method may be used for static stress analysis only, if the dam has a simple geometry and uniform material parameters can be assumed for the concrete and for the foundation rock. Other mathematical formulations and approaches can also be employed, but the accuracy of such methods should be verified by comparison with the finite-element analyses.
11-1.4.3 Evaluation for Static Loading
The performance of concrete arch dams under static loading conditions should be evalu-ated using deflections and stresses. Concrete and foundation rock material parameters used in the analyses should be determined on the basis of field and laboratory in-vestigations (Sections 11-2.4 and 11-3). In situations where determination of certain ma-terial parameters is neither cost effective nor conclusive, their effects on the dam response should be evaluated by parameter sensitivity analyses (Section 11-5.5). All applicable static loads should be considered and combined according to their probabilities of occur-rence in three categories of Usual, Unusual, and Special loading combinations (Section 11-4).
The basic results of analyses should include both deflections and stresses developed in the dam. Plots of computed deflections provide a visual means for checking the numerical results, and whenever possible they should be correlated with the observed deflections measured by instrumentation monitoring (Section 11-7), in order to verify and possibly calibrate the mathematical model. The initial position and temperature of the dam is not typically known. For this reason, when comparing computed deflections to observed de-flections, it is the differential deflection rather than the absolute deflection that is mean-ingful.
Stress results are used to evaluate the dam performance in the response to each loading combination. The evaluation starts with comparison of the computed stresses with strength of the concrete reduced by a factor of safety (Table 11-1.1), but will also involve determination of location, magnitude, extent, and direction of high stresses should some crack-inducing stresses be expected. If all factors of safety are met the dam is considered to perform satisfactorily, even though some minor contraction joint opening may occur. Otherwise joint opening and cracking could be significant and should be evaluated in
ac-Table 11-1.1 Factors of Safety for Existing Arch Dams
Loading Combination Compressive
Stresses Tensile Stresses Internal Shear Stresses Sliding 1 Stability
Usual (normal operating) 2.0 1.0 2.0 1.5
Unusual (flood condition) 1.5 1.0 1.5 1.5
Extreme (seismic) 1.1 1.0 1.1 1.1
1
Factors of safety valid for the assumption of no cohesion.
11-1.4.3.1 Performance for Usual and Unusual Loading Combinations
Arch dams resist applied static loads by developing primarily compressive stresses along the arch sections. The adequacy of the dam under a given load combination should be evaluated in accordance with the compressive stress and shear stress criteria listed in Ta-ble 11-1.1.
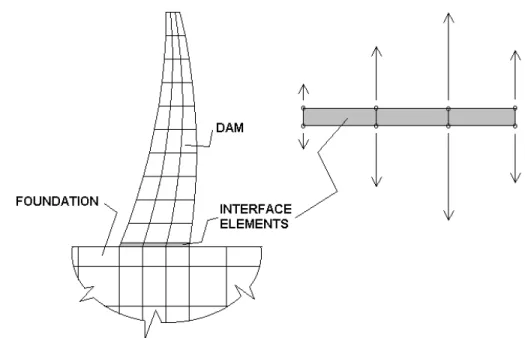
The stress results produced by the linear-elastic finite-element analysis usually indicate some areas of tensile stress in the dam. While tensile strength of the intact concrete can reach several hundred psi, the fact that a typical arch dam is made of concrete blocks di-vided by lift joints, vertical contraction joints, and pre-existing cracks should be consid-ered in the evaluation of tensile stresses (Figure 11-1.1).
Fig. 11-1.1 Existing arch dam with vertical contraction joints, horizontal lift joints, and pre-exiting cracks
The tensile strength in the direction normal to the contraction joints and cracks is very small, and across the lift joints may be only a fraction of the tensile strength of the intact
concrete. In some cases, joints and cracks may have no tensile strength at all. For this reason, it is not appropriate to evaluate the indicated tensile stresses of a finite element model in terms of an allowable tensile stress for the intact concrete alone.
When a finite element model does indicate regions of tensile stress, the reviewer must realize that these stresses are probably not an indication of the actual stress state of the dam, but a consequence of the modeling assumptions of linear elasticity and structural continuity. Thus, large areas of indicated tensile stress may reveal a problem with the assumption of linear-elastic behavior and not necessarily a problem with the performance of the dam.
The effect of tensile stress relief by joints and cracks is to increase compressive and pos-sibly shear stress in other areas of the dam. If a finite-element model indicates large areas of tensile stress, or tensile stresses that are high (see Section 11 -3.7.2), the finite element model should be modified to account for the loss of tensile resistance due to joint opening or cracking. The modified model should then be re-run and evaluated. This process will require some judgement on the part of the reviewer and the analyst as to when indicated tension is excessive thus requiring model modification. If the combination of linear finite element analysis and engineering judgement is not sufficient to determine whether or not a dam is safe, non-linear finite element analysis may be required.
11-1.4.4 Evaluation for Seismic Loading
The performance of concrete arch dams under earthquake loading should be evaluated by conducting a three-dimensional linear-elastic dynamic analysis using the finite-element method (Section 11-6). The FE model of the dam system should account for the dam-water and the dam-foundation rock interaction effects. Material parameters for the con-crete and foundation rock should be established by giving due consideration to the effects of the rate of loading typical of earthquake response. The design earthquake for the safety evaluation of arch dams is the maximum credible earthquake (MCE). The MCE is an extremely rare event capable of producing the largest ground motion that could ever occur at the dam site. An MCE should be considered to be an extreme loading condition, for which significant damage would be acceptable, but the dam must not rupture and thus threaten life and property downstream. Seismic input ground motions for the MCE should be developed from a deterministic ground motion analysis, but may be supple-mented by a probabilistic ground motion analysis should evaluation of the likelihood of the MCE ground motions become desirable. The earthquake response of the dam may be
stresses exceed the allowable values a linear time-history analysis can be helful to as-sessing the severity of joint opening and tensile cracking .
For evaluation of the earthquake performance of arch dams using response-spectrum method, dynamic stresses are combined with static stresses due to the usual loading combination and compared with the allowable values. The evaluation criterion for time-history analysis, however, is more involved than simple stress checks. It considers not only the maximum stress values, but also the sequencing, spatial extent, and number of excursions beyond the allowable values. In addition, in cases where severe damage is predicted, sensitivity analyses should be performed to account for uncertainties associated with modeling assumptions, seismic input application, and material properties. Horizon-tal lift joints and vertical contraction joints should be assumed to crack when subjected to tensile stresses exceeding their tensile strengths. In situations where there is a net tensile force across a vertical contraction joint, it should be assumed that the contraction joint will open through the full thickness of the dam, possibly forming a free cantilever block. (See 11-6.3.3.5) The evaluation of dam safety using linear elastic assumptions requires a qualitative judgement of how stresses will be redistributed during joint opening and cracking. This evaluation is done in lieu of more sophisticated nonlinear analysis. This approach may not be sufficient for some situations and a more detailed analysis using non-linear techniques may be required. The dam may be considered safe for the MCE if, after the effects of crack and joint opening have been accounted for, it can be shown that the concrete is not over-compressed and free cantilevers do not topple.
11-1.4.4.1 Post-earthquake Safety Evaluation
A post-earthquake safety evaluation is required to assure the safety of the dam if, a dam-aging MCE should occur near the dam site, or the predicted performance of the dam due to a postulated MCE should indicate substantial damage. This evaluation should consider the effects of static loads as well as severe aftershock earthquakes that invariably occur after any major quake. Factors of safety for the post-earthquake conditions are the same as those given in Table 11-1.1 for the usual case.
11-1.4.5 Sliding Stability
To assure safety against sliding along identified kinematically admissible failure planes in the dam , at the dam foundation/interface, or in the foundation, the shear friction factor of safety assuming no cohesion shall be 1.5 for normal and unusual loading, and greater than 1 for extreme loading. These safety factors assume that stability has been evaluated with respect to conservative shear strength parameters.
For major dam structures subjected to severe seismic loading, response history analyses should be performed for abutment and foundation stability instead of the usual pseudo-static analyses. In response history analyses, factor of safety varies with time and may be-come less than 1.0 for one or more cycles provided that the resulting cumulative sliding displacement is very small and can be tolerable.
11-2
FOUNDATION CONSIDERATIONS
11-2.1GeneralThe abutment foundations of an arch dam are particularly critical to the stability of the dam because they are required to resist the majority of the reservoir forces that attempt to push the structure in a downstream direction. The modulus of deformation of the abutments and the foundation is also an important element in analyzing the performance of the dam since the flexibilityof the foundation directly affects the stresses in the dam. Foundation informa-tion must provide sufficient geological detail to identify and locate any potential sliding wedges of rock that could cause instability. If such features are found to exist, a stability analysis must be performed to assure that thereis an adequatefactor of safety against abut-ment sliding. For some existing dams, sufficient data and analyses are already available to provide the necessary information. In other cases it will be necessary to perform field investigations and conduct stability analyses. In either event, the staff must require that sufficient abutment foundation information and analysis be provided to support a review that verifies the findings with regard to the stability of the foundation and abutments. The same requirement is true for the foundation modulus of deformation.
11-2.2 Field Investigations
Field investigations are well described in Chapter 5 of these Guidelines and in the U.S. Army Corps of Engineers EM 2-2201 (1994). Additional details are contained in EM 1110-1-1804 (1984) and EM 1110-1-2908 (1994) (See References). The following narrative is intended as a summary and for the purpose of additional elaboration where required to specifically address the requirements of this Guideline.
It is imperative that the conditions of the foundation at the site be well defined. In particular, geologic investigations as outlined in Chapter 5 should provide an interpretation of the rock type and quality, identify the discontinuity (joint) pattern, locate any planes or wedges of rock which could fail under the structural loading, provide samples and data for determining the rock mass modulus of deformation, the bearing capacity and the shear strength available to resist failure.
11-2.2.1 Foundation Features That Create Stability Concerns and Warning Signs
Jointing - A feature of primary concern is a large wedge of rock in an abutment foundation created by a planar rock fracture or the intersection of two or more rock fractures whose intersection trend daylights in a downstream direction. Refer to EM 1110-2-2201, pages 10-28 and 29, for examples. Because of the high intact strength of most rock formations,
failure is improbable unless it can occur along preexisting fractures. For a failure to occur, movement of the rock wedge must be kinematically possible. In other words, the orienta-tion of the trend of the intersecorienta-tion of the rock fractures or slide plane must normally daylight in a direction which would allow movement to take place under the applied loads without shearing a great deal of intact rock. A relatively small amount of intact rock may sometimes be sheared when the trend comes close to daylighting without it actually occurring.
In addition to joint orientation, joint connectivity must be considered. Joint connectivity determines whether kinematically possible wedges are small, and of little consequence, or large and capable of compromising the stability of the dam.
Hydrostatic Pressure - The stability of an abutment rock wedge is affected by the hydrostatic pressure in the joints that define the wedge as can be seen in the figure below. The drilling of joint drainage holes to relieve hydrostatic pressure is often very effective in increasing wedge stability.
Fig. 11-2.1
Faults - Zones of faulted or sheared rock within the foundation must be carefully considered. A fault is a rock fracture distinguished from a joint by virtue of translational movement of one wall relative to the other wall at some time during the geologic record. If a fault is found to be present, the question as to whether it is active or inactive must be answered. If it is determined to be an active fault, its effect upon the structure during movement must be very carefully assessed and appropriately acted upon.
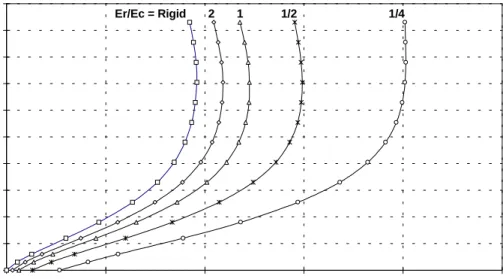
it is a presheared feature in the rock, it probably provides a plane of reduced strength to resist movement. In many cases slickensides and clay gouge are formed which greatly reduce the rock strength. Its orientation is significant in the effect it has on reducing stability against sliding in the foundation.
Another concern is the permeability of a through-going fault. If the sheared rock was very brittle and the shearing process formed a zone of primarily broken rock (breccia), it may form a highly permeable path for water passage beneath the dam. If the shearing movement forms a clay gouge within the breccia zone, the result may be a very impervious barrier in the foundation. Such a barrier to seepage can in some configurations result in the develop-ment of abnormally high uplift pressure in the foundation. These questions must be ad-dressed, satisfactorily answered and incorporated into the stability analysis of the dam. Treatment may consist of curtain and consolidation grouting of a highly pervious shear zone or drains to relieve abnormal uplift created by a highly impervious shear zone. The possibil-ity of erosion of gouge must also be considered.
The effect of a large faulted shear zone on the modulus of deformation of the foundation must be taken into consideration. A large change in modulus over a very short distance may result in the formation of concentrated stresses in the concrete of the dam if the shear zone was not properly treated during construction. Treatment usually consists of excavation of the sheared material to a depth from two to three times its width followed by backfill with dental concrete.
Coal Seams - Coal seams or beds in the foundation of an arch dam are a feature of concern. The clay layers associated with coal beds are an even greater concern. This combination in the foundation of an arch dam can form a plane with significantly lower shearing resistance than the surrounding rock. It should be evaluated both for planar failure and as a wedge in combination with the fracture pattern existing in the rock mass.
Planar Features - Planar features such as bedding, fisility, shale or clay seams, schistocity, foliation, cleavage, and stress relief features such as exfoliation and valley relief joints may all form sides of a rock wedge and therefore are features of some concern to be included in the abutment foundation stability analysis.
Sudden Changes in Stiffness - Adjacent rock beds with radically different moduli of defor-mation are of some concern. This difference must be taken into account during the stress analysis for the dam.
Experienced engineering and geologic judgement are very important in the selection of foundation material parameters for use in the analytical procedures. Since it is often not feasible to make prototype tests and measure directly the rock mass strength and deformation properties, it is necessary to use laboratory tests of small samples as the basis for estimating these properties. Laboratory testing may be required to identify rock types and to provide shear strength and rock mass modulus of deformation data. The testing program must be carefully developed by the Independent Consultant to provide sufficient tests to establish a statistically sound basis for estimating shear strengths of all critical features as well as the rock mass modulus of deformation. Refer to the Rock Testing Handbook (1990) and to Chapter 10 of EM 1110-2-2201 (1994) for more detail on laboratory testing than is provided in this Guideline.
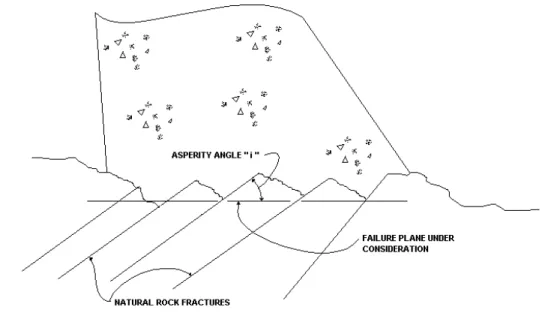
Three parameters may be involved in providing shearing resistance to sliding at the interface, in the foundation and in the abutments. These include angle of friction, cohesion, and the angle of the rock asperities. Circumstances will dictate the applicability of using cohesion versus asperity angle. With smaller structures where the normal force applied by the dam and the weight of the overlying rock is insufficient to shear through the rock asperities during sliding, no cohesion parameter should be counted in the analysis. Instead, the angle of the asperities should be added to the angle of friction as a resisting parameter, since no move-ment can occur without overriding the asperities. This results in dilation or lifting, thereby requiring an increased driving force to slide the structure. Conversely, in large dams that impose high normal forces, shearing through asperities may occur rather than riding over them during sliding failure. In this circumstance it is proper to use cohesion as a resisting force rather than the angle of the asperities. Further explanation is contained in the following paragraphs.
11-2.3.1 Shear Strength of Foundation Interface
Factors to be considered in estimating the shear strength of the foundation interface include strength of the bond of the concrete to the rock foundation, roughness or asperity angle "i" of the interface, and embedment of the structure into the rock. Laboratory testing of intact core samples of the interface can provide data on which to estimate the bond strength. Sufficient core samples of the interface must be obtained to allow a statistically sound appraisal of the percentage of the interface that can be reliably assumed to be bonded.
irregularity from closely spaced core borings. Refer to Figure 11-2.2b for a diagrammatic representation of interface roughness.
Where information exists for determination of an asperity angle at the interface between the structure and the foundation, this angle may be added to the friction angle as a resisting force in the stability analysis if the least resistance to sliding includes overriding the irregularities. It is not applicable where the least resistance is developed by shearing through the rock of the irregularities. Refer to Figure 11-2.2b for an example to illustrate the effect that founda-tion roughness may have in resisting sliding at the interface.
Embedment may possibly be determined from as-built drawings, construction photographs, and borings. This factor can be very important for preventing sliding on the interface pro-vided the concrete is placed against the embedded surface, which would mobilize the down-stream rock strength before movement could occur.
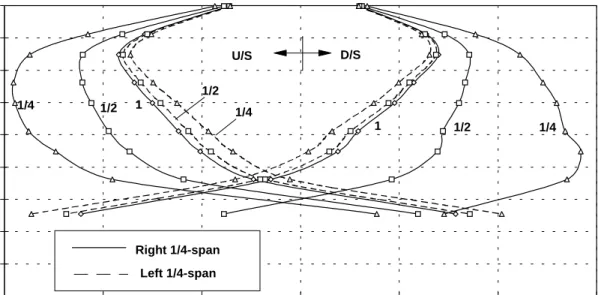
The process of determining interface strength for arch dams is not as straight forward as is the case of gravity dams. This is because failure mechanisms must be considered in 3 dimensions. As can be seen in Figure 11-2.2a, the direction of shear force at the dam/foundation interface changes with respect to position along the valley. In one area, the shear force may be parallel to the strike of the asperities, in another area it may be perpen-dicular. Strength must be defined with respect to the direction of shearing force. As in the case of indicated tensile stresses, local exceedance of the shear strength of the interface may not be an indication of dam failure. Excessive shear stress may be able to be re-distributed.
Fig. 11-2.2a Direction of shear stress at dam/foundation interface
Fig. 11-2.2b Concrete to rock foundation interface showing asperities interrupting poten-tial failure plane
The strength of the concrete to rock interface where the concrete is bonded is represented by the angle of friction plus cohesion. Data needed for determination of conservative values of the angle of friction and cohesion are obtained by laboratory direct shear tests. Normal stresses for these tests are determined by bracketing the stress level expected in the founda-tion. The tests should include a suite of core samples where the concrete is bonded to the foundation rock.
The strength of the concrete to rock interface where the concrete is not bonded to the rock is represented by the angle of friction and either the apparent cohesion or the asperity angle. To determine the angle of friction and the apparent cohesion, a suite of core samples should be tested in which the interface is either not bonded naturally or the bond has been previously broken. Judgement must be carefully exercised in determining whether apparent cohesion may be allowed along unbonded portions of the potential failure plane. Test results will frequently result in a cohesion intercept on the shear stress diagram even though the contact is unbonded. This is probably explained by shearing of the concrete during testing due to the roughness of the interface. If it is determined that apparent cohesion is to be used, it is prudent to ignore the asperity angle since they both reflect shearing resistance due to inter-face roughness. There may be some exceptions where it can be demonstrated that there are two or more orders of asperity angles existing at the interface, i.e. fine versus coarse irregu-larities. In this case, the tested samples would reflect shearing strength caused by the fine asperities, while the structure itself would mobilize the resistance provided by both fine and coarse asperities.
If it is decided that shear resistance is a combination of shear through asperities and asperity ride up, strain compatibility may become an issue. It is likely that the shear through asperi-ties will occur at lower strains than asperity ride up. Therefore, frictional resistance from aspertity ride up may not be mobilized simultaneously, and can not be added to the ultimate shear strength.
The strength parameters resisting failure along a plane at the interface should be weighted according to the percentage of the plane where bonding of concrete to rock is expected, the percentage where unbonded contact is expected, and the percentage where shear through rock or dilation over the rock irregularities is expected. Where shear through rock is a factor, it must be determined whether the failure would likely follow a natural rock fracture or would be required to shear through intact rock. The latter determination can make a very large difference in the estimation of resisting forces because of the large difference in the strength of intact rock versus fractured rock.
prudent to rationalize and select conservative strength parameters based on the test results.
11-2.3.2 Shear Strength of Potential Foundation Failure Planes and Wedges
The abutment foundations are particularly critical to the stability of an arch dam as previ-ously discussed in Sections 11.2.1 and 11-2.2.1. Abutment instability can develop along either a planar discontinuity or a combination of planar discontinuities which intersect to form an unstable wedge. Procedures for determining the shear strength of potential foun-dation failure planes and wedges are discussed in detail in Chapter 5 of these guidelines.
11-2.3.3 Foundation Modulus of Deformation
The deformability of the foundation of an arch dam can affect the behavior of the structure because the dam and foundation function together as an integrated unit. The modulus of deformation provides a measure of this property. It is a representation of the deformational property of the rock mass as a whole, with all its discontinuities, as contrasted with the modulus of elasticity of an intact specimen of the rock.
There are different approaches to developing an estimation of the modulus of deformation. The most direct measurement can be made by performing static in situ jacking tests in abutment adits. There are also procedures available for measuring the dynamic elastic properties of a rock mass using seismic techniques. It is generally accepted that the lower modulus values provided by the jacking tests are more appropriate for use in arch dam foundation analysis because it appears that this technique better models the effect that dis-continuities have on the foundation. However, the results obtained from a jacking test are very local in nature, and may not be appropriate for the foundation in another area.
In the case of existing structures it is unlikely that an adit will be available in which to perform either jacking or seismic tests. In some cases these tests may have been performed for the original design and the results may still be available. In this case a review of the existing data maybe all that is required to develop an estimate of the foundation modulus of deformation.
Where no data is available, it is possible to develop an estimate of the foundation modulus by testing representative intact specimens of the rock obtained from core samples to
deter-convert from the modulus of elasticity of the intact rock to the modulus of deformation of the rock mass. Refer to Hendron (1968) for a study which demonstrated that the fracture frequency in the rock mass is a primary factor in the reduction of the elastic modulus of a rock mass from the modulus of an intact specimen. He provides examples of how rock quality designation (RQD) and velocity ratio may be used to estimate the appropriate reduc-tion factor.
TABLE 11-2.1 (From Bieniawski, 1990)
GEOMECHANICS CLASSIFICATION OF JOINTED ROCK MASSES
A. CLASSIFICATION PARAMETERS AND THEIR RATINGS
PARAMETER RANGE OF VALUES
Point-load strength index
>10MPa 2 - 4 Mpa 2 - 4 MPa 1 - 2 Mpa For this low range, uniaxial com-pressive test is preferred Strength of intact rack material Uniaxial compressive strength
>250MPa 100-250MPa 50–100 MPa 25-50MPa 5-25
MPa 1 -5 MPa <1 MPa 1 Rating 15 12 7 4 2 1 0
Drill core quality RQD 90% - 100% 75% - 90% 50% - 75% 25%- 50% <25% 2 Rating 20 17 13 8 3 Spacing of discontinuities > 2 m 0.6 -2 m 200-600 mm 60 - 200 mm < 60 mm 3 Rating 20 15 10 8 5 Condition of discontinui-ties Very rough surface Not continuous No separa-tion Unweathered wall rack Slightly rough surface Sepa-ration < 1 mm slightly weathered walls Slightly rough sur-face Separa-tion < 1 mm Highly weathered walls Sickensided surface OR Gauge < 5 mm thick OR Separation 15 mm continuous
Soft gauge > 5 mm thick OR Separation >5 mm Continuous 4 Rating 30 25 20 10 0 inflow per 10 m tunnel length Ratio: (joint water pressure)/(major principle stress) Ground Water General Conditions None OR _ ___ 0 OR ____ Dry < 10 liters/min OR ____ 0.0 - 0.1 OR ____ Damp 10-25 li-ters/min OR _ 0.1 - 0.2 OR __ Wet 25-125 iters/min OR ____ 0.2 - 0.5 OR __ Dripping > 125 liters/min OR _ > 0.5 OR _ Flowing 5 Rating 15 10 7 4 0
B. RATING ADJUSTMENT FOR JOINT ORIENTAITON
Strike and dip orientations for joints Very favorable Favorable Fair Unfavorable Very unfavorable Tunnels 0 -2 -5 -10 -12 Foundations 0 -2 -7 -15 -25 Ratings
Slopes 0 -5 -25 -50 -60
C. ROCK MASS CLASSES DETERMINED FROM TOTAL RATING
Rating 100←81 80←61 60←41 40←21 <20
Class No. I II III IV V
Description Very good rock Good rock Fair rock Poor rock Very poor rock
D. MEANING OF ROCK MASS CLASSES
Class No. I II III IV V
Average Stand-up time 10 years for15 m span 6 months for8 m span 1 week for5 m span 10 hours for 2.5mspan 30 minute for 1 m span Cohesion of the rock mass > 400 kPa 300-400 kPa 200-300 kPa 100-200 kPa <100 kPa Friction angle of the rock mass >45 35 - 45 25 – 35 15 - 25 <15
Serafim and Pereira (1983) developed a relationship between Bieniawski's (1979) Rock Mass Rating (RMR) system and the modulus of deformation of rock masses which has been shown tobe valid on other projects. This relationship is as follows:
(RMR-10)
For RMR’s < 58 E = 10 40
(11-2.1) For RMR’s > 58 E = 2·(RMR) - 100
E = Modulus of Deformation measured in gigapascals (GPa) 1 GPa = 145,037.7 psi.
Factors included in Bieniawski's RMR are unconfined compressive strength or point load strength index, RQD, spacing of discontinuities, condition of discontinuities, and ground water. Refer to Table 11-2.1 for his Geomechanics Classification of Jointed Rock Masses.
The above described systems may be used to develop a rational basis for estimating the modulus of deformation of the foundation of an existing dam. It must, however, be
consid-2201 (1994) for additional guidance.
Borehole dilatometers and pressure meters are also available for performing in situ deforma-tion tests in boreholes. Data from these tests may also be useful in estimating the rock mass modulus of deformation
It must be realized that the modulus of deformation is often difficult to quantify. The techniques discussed above can be useful, however it may be more prudent to run several analyses with differing foundation modulii bracketing reasonable expected values rather than to spend effort in laboratory testing and field investigations attempting to more precisely quantify the modulus of deformation.
11-2.4 Foundation Rock Erodibility
The erosion of a plunge-pool downstream of a functioning arch dam spillway is a common occurrence unless measures have been taken to prevent it. It is a natural way for the energy of the falling water to be dissipated. Erosion of even very strong and massive rock can occur at the location of impingement of the water falling from a high dam spillway. Two examples of deep erosion of strong rock include the 79 ft. (24m) deep plunge-pool eroded in blocky andesite at Alder Dam in the USA and the 65 ft. (20m) deep plunge-pool eroded in excellent granite at Picote Dam in Portugal described by Mason (1984). Typically, the rate of plunge-pool erosion decreases with depth until a stable configuration is reached. Plunge-plunge-pools are sometimes planned for in the design of a spillway as a means of energy dissipation, but plunge-pool formation can cause a stability problem if it continues to grow laterally, eroding the dam foundation.
11-2.4.1 Field Investigations
Field investigations are conducted to determe the extent of previous erosion that may have occurred and to provide data for determining the threat to the structure posed by possible future erosion during flood events. The investigations should consider the erosion that has occurred around the spillway(s) and at or near the toe of the dam with the intent of assessing the long-term erodibility of the rock in these locations. Investigations may include hydro-graphic surveys to establish the depth and extent of an existing plunge-pool, and by repeating surveys after spillway flows it is possible to determine plunge-pool stabilization or continued growth. Engineering geology investigations are conducted to provide data on the foundation rock conditions including such things as rock type, fracture spacing and condition, bedding
frequency, zones of weaker rock such as softer beds and sheared rock zones, unconfined compressive strength, orientation of beds and fractures, etc. Borings may be required to provide data for the engineering geology investigations.
11-2.4.2 Assessing the Erodibility of Rock
The erodibility of rock has been the subject of numerous studies by both engineering geolo-gists and hydraulic engineers. These studies have provided considerable insight into this very complex problem. The complexity of the interaction of the water forces with the endless variety of rock conditions encountered, however, makes each situation unique.
Rock erodibility is controlled by the following factors:
1. Intact rock strength (unconfined compressive strength).
2. Fracture frequency (size of individual rock blocks).
3. Orientation of fracture sets.
4. Shear strength and condition of fractures (continuity, roughness, aperture opening, in-filling material and alteration or weathering condition of wall rock).
5. Weak planes in the intact rock (bedding, foliation, schistocity, fissility, etc.)
6. Faults and shear zones.
An assessment of rock erodibility must take these factors into account. The integration of these factors is best accomplished by the use of one or more of the rock classification sys-tems, such as the Geomechanics Classification developed by Bieniawski (1979 and 1990) and Barton's Q System (1974 and 1988).
Plunge-pool growth is a function of hydrologic factors as much as erodibility of the bed material. Mason (1984) presented an equation which related depth of scour to unit flow, head drop, acceleration of gravity, tail-water depth and particle size of bed material. This equation is lacking in that it looks at only one aspect of the bed's resistance to erosion, that being particle size. He did, however, calibrate the equation using both model tests and actual case histories and developed reasonable agreement with actual plunge-pools.
There have been studies made which related rock erodibility to an RMR System. Annandale (1995) presents an erodibility index related to a rippability index developed by Kirsten (1982 and 1988) using Barton's (1974 and 1988) Q System as a basis. Another study was per-formed by Cameron et al. (1986, 1988a, 1988b, and 1989) which relates rock erosion in emergency chute spillways to Bieniawski's Geomechanics Classification System (1979 and 1990). These may be useful in assisting the independent consultant in his evaluation of the likelihood of further development of a plunge-pool. This subject is still under investigation by government agencies and other institutions. More reports further defining rock erodibility may be expected in the literature in the future.
11-2.4.2.1 Quantitative Method of Assessing the Erodibility of Rock
There are two situations in which rock downstream from an arch dam can be subject to erosion. Some arch dams are designed with an overflow spillway which is an integral part of the dam. When the spillway operates, the rock in the area impacted by the jet can be eroded. A plunge-pool is usually provided in the area where the jet falling from the spillway impacts. The plunge-pool acts to dissipate the energy of the falling water and minimize potential for erosion of the rock. If the rock in the impact area is hard and free of fractures, an excavated but unlined plunge-pool may allow for satisfactory energy dissipation and adequately limit erosion. However, if the rock in the impact area is fractured, a substantial concrete lining of the plunge-pool may be required. For low arch dams with sound rock under and downstream from the dam, the falling jet may not have the potential to erode the rock.
An arch dam may be subject to overtopping during extreme floods if spillway capacity is not sufficient. When overtopping occurs, water falling from the dam crest will impact rock all along the downstream of the dam and the potential for erosion of the abutments becomes a concern. Erosion of abutments is a particular concern for arch dams for which rock in the abutments is not sound. Such overtopping can pluck out loose rock. Joints in the abutment rock will make the abutments particularly susceptible to erosion. Thus, it is important to consider the possible effects of erosion that would result from overtopping of the dam as that resulting from operation of the spillway.
Two questions need to be answered relative to the erodibility of a given rock resulting from overtopping of the dam or from spillway operation: 1.) Will the rock erode as a result of the impact of the falling water?, and 2.) If the rock will erode, will the extent of erosion cause a stability problem?. To answer the first question, information must be obtained on the
overall quality of the rock and the degree to which it is fractured; and a measure of the energy with which the water impacts the rock must also be developed. At present, the second question can only be answered in terms of past experience.
An articleby Annandale (1995) provides a quantitative methodology by which an assessment can be made of whether or not a given rock will erode under the action of falling water. The method assumes that there is a relationship between the rate at which energy is dissipated in the receiving pool of water (the stream power P) and the erodibility of the rock. The fol-lowing Erodibility Index, developed by Kirsten (1982), was used as a quantitative estimate of erodibility:
Kh = MsKbKdJs (11-2.2)
where Kh is the erodibility index, Ms is the mass strength number, Kb is the particle block
size number, Kd is the discontinuity or inter-particle bond shear strength-number and Js is the
relative ground-structure number. Higher values of the Erodibility Index indicate greater resistance to erosion. In evaluating the Erodibility Index the following equations are re-quired:
Kb = RQD/Jn (11-2.3)
where RQD is the Rock Quality Designation, a standard parameter in drill-core logging (Deere 1988), and Jn is the joint-set number, which is a function of the number of joint sets
in a rock mass (Table 11-2.7). The particle block size number for cohesionless granular materials can be determined directly with the following equation:
Kb = 1000 (D50)3 (11-2.4)
where, for a cohesionless granular material, D50 is the mean particle size. Kd is evaluated in
terms of the ratio Jr/Ja where Jr is the joint roughness number and Ja is joint alteration
num-ber. All of the independent parameters required to evaluate the Erodibility Index can be assessed with standard geotechnical field techniques and laboratory tests. Tables 11-2.2 through 11-2.10, developed by Kirsten (1982), provide the means for quantitatively evaluat-ing these parameters from the results of field observations and standard geotechnical tests.
A collection of data obtained for unlined spillways by the U.S. Soil Conservation Service and the U.S. Bureau of Reclamation was used to develop a graphic relationship between the erodibility index and rate of dissipation in the plunge-pool. The data included values for materials ranging from 0.1 mm diameter through gravels, cohesive soils, vegetated soils, weathered rock, and jointed and fractured rock. The resulting relationship between the Erodibility Index and energy dissipation is plotted in Fig. 11-2.7, which indicates a division between cases where erosion has and has not occurred.
Fig 11-3 Erodibility of Rock and Earth Materials by Hydraulic Jets (Annandale, 1995)
To use the method proposed by Annandale, the Erodibility Index must be evaluated for the rock in which the plunge-pool will develop, which will require field observations and labo-ratory tests. In general, the equation for Stream Power is:
P = Q γ E (11-2.5) Where P is the stream power, Q is the flow rate, γ is the unit weight of water (62.4 Lb/ft3), and E is the reduction in velocity head that occurs in the impact area (V2/2g). The rate at which energy dissipation will occur in the impact areamust then be evaluated. Techniques and relationships for evaluation of the rate of energy dissipation can be found in The Hand-book of Hydraulics by Davis and Sorensen (1969), Open Channel Flow by Henderson
(1966), Hydraulic Engineering by Roberson, Cassidy, and Chaudry (1988), and Open Chan-nel Hydraulics by Chow (1959).
The method proposed by Annandale is at present (1997)the only available method by which a quantitative estimate of erodibility can be made in terms of the hydraulic parameters of a plunging spillway jet and characteristics of the rock in the impactarea. It has had limited application at the present time, and the resultsshould be used with caution. Nevertheless, Fig. 11-2.3 appears to indicate that the use of this method can give a reasonable conclusion as to whether the rock downstream from a given damshould be expected to erode.
Table 11-2.2. Mass Strength Number for Granular Soils (M)
Consistency Identification in Profile
SPT Blow Count Mass Strength Number (M)
Very loose Crumbles very easily when scraped with geological
pick 0-4 0.02
Loose Small resistance to penetration by sharp end of
geo-logical pick 4-10 0.04
Medium dense Considerable resistance to penetration by sharp end
of geological pick 10-30 0.09
Dense Very high resistance to penetration of sharp end of geological pick - requires many blows of pick for excavation
30-50 0.19
Very dense High resistance to repeated blows of geological pick
-requires power tools for excavation 50-80 0.41 Note: Granular materials in which the SPT blow count exceeds 80 to be taken as rock – see Table 11-2.4.
Table 11-2.3 Mass Strength Number for Cohesive Soils (M) Consistency Identification Vane Shear Strength (kPa) Mass Strength Number (M)
Very soft Pick head can easily be pushed in up to the shaft
of handle. Easily moulded by fingers. 0 - 80 0.02
Soft
Easily penetrated by thumb; sharp end of pick can be pushed in 30 mm - 40 mm; moulded by fingers with some pressure.
80 - 140 0.04
Firm
Indented by thumb with effort; sharp end of pick can be pushed in up to 10 mm; very difficult to mould with fingers. Can just be penetrated with an ordinary hand spade.
140 - 210 0.09
Stiff
Penetrated by thumbnail; slight indentation pro-duced by pushing pick point into soil; cannot be moulded by fingers. Requires hand pick for exca-vation.
210 - 350 0.19
Very stiff Indented by thumbnail with difficulty; slight in-dentation produced by blow of pick point. Re-quires power tools for excavation.
350 - 750 0.41
Note: Cohesive materials of which the vane shear strength exceeds 750 kPa to be Taken as rock - see Table 11-2.4.
Table 11-2.4 Mass Strength Number for Rock (M).
Hardness Identification in Profile
Unconfined Compressive Strength (MPa) Mass Strength Number (M)
Very soft rock Material crumbles under firm (moderate) blows with sharp end of geological pick and can be peeled off with a knife; is too hard to cut triaxial sample by hand.
Less than 1.7
1.7 - 3.3
0.87
1.86
Soft rock Can just be scraped and peeled with a knife; indentations 1 mm to 3 mm show in the specimen with firm (moderate) blows of the pick point.
3.3 - 6.6
6.6 - 13.2
3.95
8.39
Hard rock Cannot be scraped or peeled with a knife; hand-held specimen can be broken with hammer end of geological pick with a single firm (moderate) blow.
13.2 - 26.4 17.70
Very hard rock Hand-held specimen breaks with hammer end of pick under more than one blow.
26.4 - 53.0 53.0 - 106.0 35.0 70.0 Extremely hard rock
Specimen requires many blows with geo-logical pick to break through intact material.
Larger than
212.0
Table 11-2.5 Mass Strength Number for Detritus (M).
Consistency Identification in Profile
In Situ De-formation Modulus (MPa) Mass Strength Number (M)
Very loose Particles very loosely packed. High percent-age voids and very easily dislodged by hand. Matrix crumbles very easily when scraped with geological pick. Raveling often occurs in excavated faces.
0 - 4 0.02
Loose Particles loosely packed. Some resistance to being dislodged by hand. Large number of voids. Matrix shows small resistance to penetration by sharp end of geological pick.
4 - 10 0.05
Medium dense Particles closely packed. Difficult to dislodge individual particles by hand. Voids less ap-parent. Matrix has considerable resistance to penetration by sharp end of geological pick.
10 - 30 0.10
Dense Particles very closely packed and occasion-ally very weakly cemented. Cannot dislodge individual particles by hand. The mass has a very high resistance to penetration by sharp end of geological pick - requires many blows to dislodge particles.
30 - 80 0.21
Very dense Particles very densely packed and usually cemented together. The mass has a high re-sistance to repeated blows of geological pick - requires power tools for excavation.
80 - 200 0.44
Table 11-2.6 Joint Count Number (Jc).
Number of Joints Per Cubic Meter (Jc)
Ground Quality Des-ignation
(RQD)
Number of Joints Per Cubic Meter (Jc)
Ground Quality Des-ignation (RQD) 33 5 18 55 32 10 17 60 30 15 15 65 29 20 14 70 27 25 12 75 26 30 11 80 24 35 9 85 23 40 8 90 21 45 6 95 20 50 5 100
Table 11-2.7 Joint Set Number (Jn).
Number of Joint Sets Joint Set Number
(Jn)
Intact, no or few joints/fissures 1.00
One joint/fissure set 1.22
One joint/fissure set plus random 1.50
Two joint/fissure sets 1.83
Two joint/fissure sets plus random 2.24
Three joint/fissure sets 2.73
Three joint/fissure sets plus random 3.34
Four joint/fissure sets 4.09
Table 11-2.8 Relative Ground Structure Number (Js). Dip Direction of Closer
Spaced Joint Set
Dip Angle of Closer
Spaced Joint Set Ratio of Joint Spacing, r
(degrees) (degrees) 1:1 1:2 1:4 1:8 180/0 90 1.14 1.20 1.24 1.26 In direction of stream flow 89 85 80 70 60 50 40 30 20 10 5 1 0.78 0.73 0.67 0.56 0.50 0.49 0.53 0.63 0.84 1.25 1.39 1.50 0.71 0.66 0.60 0.50 0.46 0.46 0.49 0.59 0.77 1.10 1.23 1.33 0.65 0.61 0.55 0.46 0.42 0.43 0.46 0.55 0.71 0.98 1.09 1.19 0.61 0.57 0.52 0.43 0.40 0.41 0.45 0.53 0.67 0.90 1.01 1.10 0/180 0 1.14 1.09 1.05 1.02 Against direction of stream flow -1 -5 -10 -20 -30 -40 -50 -60 -70 -80 -85 -89 0.78 0.73 0.67 0.56 0.50 0.49 0.53 0.63 0.84 1.26 1.39 1.50 0.85 0.79 0.72 0.62 0.55 0.52 0.56 0.68 0.91 1.41 1.55 1.68 0.90 0.84 0.78 0.66 0.58 0.55 0.59 0.71 0.97 1.53 1.69 1.82 0.94 0.88 0.81 0.69 0.60 0.57 0.61 0.73 1.01 1.61 1.77 1.91 180/0 -90 1.14 1.20 1.24 1.26
Notes: 1. For intact material take Ks = 1.0
Table 11-2.9 Joint Roughness Number (Jr).
Joint Separation Condition of Joint Joint Roughness Number
Joints/fissures tight or closing during excava-tion
Discontinuous joints/fissures Rough or irregular, undulating Smooth undulating
Slickensided undulating Rough or irregular, planar Smooth Planar Slickensided planar 4.0 3.0 2.0 1.5 1.5 1.0 0.5
Joints/fissures open and remain open during ex-cavation
Joints/fissures either open or containing relatively soft gouge of sufficient thickness to prevent joint/fissure wall contact upon excavation.
Shattered or micro-shattered clays
1.0
Table 11-2.10 Joint Alteration Number (Ja).
Description of Gouge
Joint Alteration Number (Ja) for Joint Separation (mm)
1.01 1.0 - 5.02 5.03
Tightly healed, hard, non-softening im-permeable filling
0.75
Unaltered joint walls, surface staining only
1.0
Slightly altered, softening, non-cohesive rock mineral or crushed rock filling
2.0 2.0 4.0
Non-softening, slightly clayey non-cohesive filling
3.0 6.0* 10.0*
Non-softening, strongly over-consolidated clay mineral filling, with or without crushed rock
3.0* 6.0** 10.0
Softening or low friction clay mineral coatings and small quantities of swelling clays
4.0 8.0* 13.0*
Softening moderately over-consolidated clay mineral filling, with or without crushed rock
4.0* 8.0* 13.0
Shattered or micro-shattered (swelling)
clay gouge, with or without crushed rock 5.0* 10.0* 18.0
Note: 1. Joint walls effectively in contact.
2. Joint walls come into contact after approximately 100 mm shear 3. Joint walls do not come into contact at all upon shear
4. * Values added to Barton et al's data
5. ** Also applies when crushed rock occurs in clay gouge without rock wall contact
11-2.4.3 Erosion Downstream from the Dam
Jets thatimpact the downstream area with a large velocity (100 ft/sec or larger) willusually produce erosionunless the rock is extremely hard and quite sound. Cases where erosion has notoccurred are rarely described in the technical literaturesince they do not create problems. In actuality, erosion of rock has occurred in almost all cases where a high-velocity jet impacts on rock, particularly if the rock in the impactarea is of poor quality or is highly weathered or fractured.
11-2.4.3.1 Historic Observations of the Depth and Extent of Erosion
Cases in which erosion downstream from spillwayshas occurred are abundant in the techni-cal literature. However, information on erosion due to overtopping of a dam is scarce. Data from thereported cases of erosion downstream from spillways has been used by several engineers to provide an estimate of the depth of expected erosion due to impact of a falling jet of water. The depth of erosion is a function of the velocity at which the jet enters the plunge-pool, the angle at which the jet enters, the depth of water in the impact area, and the physical character of the rock. Field and laboratory observations have shown that erosion will continuewith further operations, but at a decreasing rate. Bulletin Number 58 of the International Commission on Large Dams (1985) states that significant plunge-pool erosion has not been observed for many existing spillways. However, in many cases those spillways have operated only for short durations and at small discharges since they were constructed. Table 11-2.11 provides a summary of information on several cases where erosion down-stream from a spillwayhas been observed and recorded.
Table 11-2.11 shows that in some cases deep erosion has been experienced even though the rock in the impact area was apparently hard. In general the depth of erosiondepends upon the energy of the falling jet, the duration of the flow, and the character of the rock. The extent of erosion depends mostly on the character of the rock. If the upper layers of rock are more erodible than the deeper layers, the lateral extent of the erosion will spread to form a wider hole since the harder lower layers will deflect the high velocities toward the more erodible sides.
Table 11-2.11 Historic Scour Depths of Plunge-pools
Material Country
q1 Head3 Depth3
Alder Andesite USA 20,0002 300 79
Na-ciemento
SS,MS4 USA 250
Picote Granite Portugal 1250 213 118
Kariba Gneiss Zimbabwe 415 160
Tarbela Limestone Pakistan 570
854 320 323 121 160 Karakaya Turkey 1034 619 413 403 131 90 Keban Turkey 351 360 335 75 44 Killckaya Turkey 130 245 39 Elmali Granite 32 89 49 Kondo-poga Granite 149 39 21 Cabora Bassa Mozam-bique 2957 283 300 315 223 75
Ukai Basalt India 854 154 95
Guri Basalt Venezuela 52,8002 118
1
Discharge q is unit discharge in cfs/ft.
2
Only the total discharge for the spillway was available.
3
Head is given in feet.
4
Abbreviations are: SS-Sandstone, MS-Mudstone.
11-2.4.3.2Analytical Methods for Calculating Erosion Depth Downstream from Spillways
Maximum Depth of Scour. As pointed out in Section 11-2.5.2.1, erosion of concern can occur downstream from an arch dam due to spillway operation if the spillway is located on the dam.
Over the years, a large number of empirical equations have been developed for estimation of the depth of erosionwhich should be expected in the area impacted by the jet produced by operation of an overflow spillway. Mason (1985) has documented 25 different equations developed for this purpose, dating from 1937. Figure 11-2.4 shows a typical cross section
of an arch dam with an overflow spillway and the parameters that have been found to be important in the estimation of depth of erosion. Erosion of rock by an impacting jet occurs when the rock is fractured. Turbulent eddies unsteady pressures produced by the impacting jetattack, move, and eventually pluck out particles of rock. Tailwater depth has an important influence on the maximum depth of erosion since deeper water in the impact area results in greater energy dissipation within the pool. Deeper tailwater results in less erosion.
The parameters which have been found to be important in determining the depth of erosion D are shown on Fig. 11-2.4. They include the head H (the vertical distance between the reservoir surfaceand the tailwater surface), the tailwater depth h2, the angle at which the jet
enters the pool Θ, the discharge per unit width of the jet q, and the size of fractured rock particles d.
Fig 11-2.4 Typical arch dam with overflow spillway and plunge-pool
The best known of these equations, and the simplest, is that by Veronese (1937):
D = 1.32 H0.225 q0.54 (11-2.6)
where D is the maximum scour depth (FT), H is the difference in elevation between the reservoir and the tailwater surfaces (FT), and q is the unit discharge (CFS). The Veronese Equation, as is true of all other forms of the equation, was derived by empirical analysis of recorded data on erosion downstream of flip-bucket and overflow spillways. In the Veronese
is considered explicitly. This equation has been widely used by the design profession and is given in the U.S. Bureau of Reclamation Design of Small Dams (1987).
Yildiz (1994) reasoned that the Veronese Equation had been developed for cases where the spillway jet entered the tailwater at a nearly vertical angleas would occur for an overflow spillway on a high arch dam as shown in Fig. 11-2.3. Yildiz suggested that the depth of scour asgiven by Eq. 11-2.6 should be measured along a line tangent to the direction of the jet as it enters the plunge-pool. Fig. 11-2.4 shows such a configuration. Yildiz then modified the Veronese Equation as:
D = 1.32 H0.225 q0.54 Sin Θ (11-2.7) where Θ is the angle of inclination of the jet at the water surface in the plunge-pool. The resulting scour-depth predictions using Eq. 11-2.7 give a better fit to the recorded erosion depths downstream fromspillways than is achieved using Eq. 11-2.8.
Although the size of fractured rock (the size of the fractured particles of rock that would be plucked out by the action of the spillway jet) is considered to be important, neither Eq. 11-2.8 nor Eq. 11-2.9 considers rock size. Mason (1985), on the basis of data from model studies as well as prototype experience, derived the following equationfor depth of erosion:
(11-2.8)
In Eq. 11-2.8, g is the acceleration due to gravity, d is the mean rock size, and h2 is the
tailwater depth. Mason found that Eq. 11-2.8 gave scour depth predictions which agreed well with prototype experience and also yielded maximum scour depths which agreed well with the results obtained in model studies when H was considered to be the total energy in the jet as it leaves the spillway. For prototypes, he found that the effect ofaccounting for energy loss occurring on the spillway surfacewas negligible.
It appears that either the modified Veronese Equation 11-2.7 or Mason’s Equation 11-2.8 is as good as is available for estimating depth of erosion downstream from a spillway. How-ever, the user should always be aware of the fact that both equations are strictly empirical and could either overestimate or underestimate the potential scour depth for a particular rock condition or jet configuration.
10 . 0 30 . 0 015 . 2 05 . 0 60 . 0 72 . 3 d g h H q D=
Pattern of Erosion. The pattern of erosion downstream from a spillway is very much de-pendent upon the characteristics of the rock in the impact area. If the joint pattern and hardness of the rock is uniform throughout the area of impact and does not change with depth, the pattern will be generally symmetric about the centerline of the impacting jet. The length of the eroded hole will be from 3 to 5 times the depth of erosion and the width of the hole will be from 2.0 to 2.5 times the width of the spillway jet.
If discontinuities in the rock exist, the potential scour depth and pattern may be strongly affected. For example, if part of the rock is much harder and more durable than the average, erosion will be uneven and strong lateral currents can be created in the basin. If lower layers of the rock are more sound than the upper layers, both the lateral and longitudinal extent of erosion will be increased significantly as a result of the high velocity of the jet being de-flected toward the edges of the hole.
11-2.4.3.3 Erosion Resulting from Overtopping of an Arch Dam
Erosion downstream from an arch dam due to overtopping is quite different than that which occurs as a result of operation of an overflow spillway. The depth of erosion in either case is very much dependent upon the duration of the flow. Deep erosion downstream from a spillway is to be expected and the overflow spillway is designed so that the jet from the spillway impacts as far from the toe of the dam as possible. However, during overtopping water would fall from the top of the dam and impact very near its toe. Depths of erosion would be very much dependent upon the depth of overtopping; large depths of overtopping would result in greater energy impacting the rock producing deeper erosion. By contrast, depths of overtopping of a foot or less should not produce significant erosion of rock at an arch dam site. If deep erosion were to occur near the toe of the dam the safety of the dam could be compromised. Erosion of the abutments can be a serious concern because material in the abutments is often less sound and more erodible than the rock at the toe of the highest portion of the dam.
Spills are a relatively common occurrence and, depending upon