CEC Theses and Dissertations College of Engineering and Computing
2018
Assessing the Impact of a Geospatial Information
System for Improving Campus Emergency
Decision-Making of Novice Crisis Managers
Adam R. Albina
Nova Southeastern University,[email protected]
This document is a product of extensive research conducted at the Nova Southeastern UniversityCollege of Engineering and Computing. For more information on research and degree programs at the NSU College of Engineering and Computing, please clickhere.
Follow this and additional works at:https://nsuworks.nova.edu/gscis_etd
Part of theComputer Sciences Commons
Share Feedback About This Item
This Dissertation is brought to you by the College of Engineering and Computing at NSUWorks. It has been accepted for inclusion in CEC Theses and NSUWorks Citation
Adam R. Albina. 2018.Assessing the Impact of a Geospatial Information System for Improving Campus Emergency Decision-Making of Novice Crisis Managers.Doctoral dissertation. Nova Southeastern University. Retrieved from NSUWorks, College of Engineering and Computing. (1029)
Assessing the Impact of a Geospatial Information System for Improving
Campus Emergency Decision-Making of Novice Crisis Managers
by Adam R. Albina
A dissertation submitted in partial fulfillment of the requirements for the degree of Doctor of Philosophy
in
Information Systems
College of Engineering and Computing Nova Southeastern University
An abstract of a Dissertation submitted to Nova Southeastern University in Partial Fulfillment of the Requirements for the Degree of Doctor of Philosophy Assessing the Impact of a Geospatial Information System for Improving Campus
Emergency Decision-Making of Novice Crisis Managers By
Adam R. Albina February 2018
A significant increase in campus-based emergencies warrants the investigation into emergency management information systems that serve a novice crisis decision-maker. Institutions of higher education that are not large enough to have dedicated emergency management offices generally press novice decision-makers into emergency management roles. An investigation was conducted to assess the impact of an emergency management geospatial information system on the decision performance of novice crisis managers through the use of a scenario-based simulation.
A mixed method sequential explanatory method was used to collect quasi-experimental data on decision time, decision accuracy and situational awareness. Qualitative analysis was conducted through interviews with participants. Statistical results indicate the decision accuracy is positively affected by the use of an emergency management geospatial information system. Data Envelopment Analysis (DEA) is non-parametric linear programming method used to identify decision-making units in a data set that are optimal in their use of single or a set of resources (inputs) in delivering a set of expected results (outputs). DEA indicated that efficiency ratios from the geospatial information system group outperform the traditional group. Geospatial information systems hold much promise in providing systems that are easy to use, promote heightened levels of situational awareness and decision support.
Acknowledgments
First, a thank you to the professor who inspired my desire to research decision making under uncertainty, Dr. Glenn Browne. Dr. Browne was my advisor during my graduate work at UMBC and started a fire in 1994 that has burned brightly ever since. It is with great gratitude that I was afforded the opportunity to continue the journey 20 years later in a doctoral program with incredibly supportive faculty at NSU. Thank you to my dissertation advisor, Dr. Trudy Abramson without whom I would have never made it this far. She was encouraging, direct, and a great mentor to me. Allowing me to make my own decisions, good and bad, and helping me understand what it takes to cross the finish line. My committee, Dr. Maxine Cohen and Dr. Antonio Rincon provided valuable insight, feedback and rigor throughout the process and a sound backdrop of experience for which I am grateful. A special thanks to Dr. Sumitra Mukherjee for his wise council and Dr. Steven Terrell for his valuable assistance in research methods. A warm thanks to Dr. Kim Round for her support and guidance throughout the doctoral process and for putting up with my complaining almost every step of the way.
The inspiration for lifelong learning comes from my parents. Melvis A. Albina, Ph.D. and Rene B. Albina, J.D. have modelled a life with an unwavering commitment to education and personal growth. Both have been amazingly supportive in my doctoral journey and in my life. Much of what I have achieved and hope to be able to give back to the world in some way, is because of the love and support of my parents.
Finally, I share this moment, as I share all moments, with the love of my life. My wife, Mary, has never stood behind me, she has always been at my side or a good distance in front of me. Her patience, encouragement, and love has been the most important constant in my life. Without her support I would not be where I am today. She has created a wonderful supportive life and for her and our three sons: Nick, Tony, and Joe, I am forever grateful for their support. I love you all.
Table of Contents
Abstract iii List of Tables vii List of Figures viii Chapters
1. Introduction 1 Background 1 Problem Statement 3 Dissertation Goal 4
Research Questions and Hypotheses 5 Relevance and Significance 6
Barriers 9 Limitations 10
Definition of Terms 10 Acronyms 12
Organization of the Study 14 2. Review of the Literature 15 Emergency Management 15
Geographic Information Systems in Emergency Management 20 Situational Awareness Theory 22
Decision-making in Emergency Management 24 3. Methodology 27 Overview 27 Research Design 28 Approach 29 Research Questions 30 Procedures 34 Instrumentation 40 Sample 49 Data Collection 50 Data Analysis 51 Summary 53 4. Results 55 Overview 55
Summary of Demographic Information 57 Preliminary Data Analysis 58
Data Analysis 61 Summary 68
5. Conclusions 70 Overview 70 Implications 78 Recommendations 80 Future Research 81 Summary 82 Appendices
A. Complete Simulation Scenario 85 B. EMGIS Screenshots 93
C. NonEMGIS Group Binder Sample 95 D. Situational Awareness Rating Technique 98 E. Nova Southeastern IRB Exemption Letter 101 F. Saint Anselm College IRB Exemption Letter 102 G. Study Site Permission Letter 103
H. Experimental Qualification Questionnaire 104 I. Consent Forms 109
J. Structured Interview Protocol 115
K. Scenario Validation Expert Feedback 116 L. CMST Software Screen Shot 119
M. Experimental Timing Sheet 120
N. Open Coding EMGIS Group Interviews 121 References 125
List of Tables
Tables
1. Scenario and Decision Accuracy Expert Reviewers 42 2. Demographic Characteristics of Participants (N = 30) 59 3. Group Differences for Decision Time, Accuracy and SA 63 4. Group Differences for Efficiency Ratios 65
List of Figures
Figures
1. Research Model 5
2. Disaster Management Cycle 18
3. G*Power Graph of Sample Size and Statistical Power 50 4. Mahalanobis Distance Outliers 60
Chapter 1
Introduction
Background
The greater subject is crisis management in institutions of higher education (IHEs). Worldwide, 6,457 weather-related disasters were recorded between 1995 and 2015. These disasters claimed a total of 606,000 lives and affected more than 4 billion people. Although annual economic losses from disasters are difficult to identify, the current estimates from UN Office for Disaster Risk Reduction (UNISDR) are $250-$300 billion annually (Wahlstrom & Guha-Sapir, 2015). Higher education continues to be impacted by both natural disaster crisis as well as those inflicted by their fellow man such as acts of terror, violent activism, and shootings. Natural disasters impact IHEs and surrounding communities concurrently, often limiting the intervention of civil emergency response personnel. These types of events, often termed extreme events, tax the
organizational structure and the decision-making of the institution. Extreme events are most often associated with large scale natural disasters on the order of hurricane Katrina in the U.S. in 2005, the University of Iowa floods in 2008 (Fillmore, Ramirez, Roth, & Peek-asa, 2011), the 2011 earthquake and tsunami in Japan (Kushida, 2012), and
hurricane Sandy in the U.S. in 2012. Smaller local events such as the 2001 tornado at the University of Maryland (FEMA, 2003), or the closure of the University of South Carolina due to flooding are more limited in scope but are crisis events with problems that are unique to smaller more localized areas (Reed, 2015).
Generally, smaller IHE lack dedicated emergency management departments and formally trained staff. Staff supporting the emergency management function are doing so
as an additional duty and have very little or no experience in emergency management (Sullivan, 2012). Institutions are potentially entrusting the safety of students, institutional personnel and local community to inexperienced emergency managers.
Geospatial Information Systems (GIS) are increasingly used in professional emergency management and are gaining wider acceptance among non-professional users. Free web based tools allow greater familiarity with basic GIS operations (Yang & Lin, 2011) and have become ubiquitous in their use in personal navigation. A GIS, like any information system, is a combination of hardware, software, and communication
medium, employed to generate, collect and disseminate useful contextualized information (Valacich & Schneider, 2010). As a natural extension of mapping and cartography in the digital age, the GIS represents the earth and multi-layers of related objects in a familiar map-based paradigm. In addition to representing traditional geographical/topographical features, a GIS can also overlay imagery, census data, road networks, weather data, and other thematic information as required by a particular context (Tomaszewski, 2015). The use of GISs may provide support for novice crisis managers and facilitate more timely and accurate decision-making in smaller IHEs faced with large-scale emergency situations.
The ideal environment for participants is a College or University in the United States with no established emergency management office and a resident population of students. As the research methodology is a quasi-experimental method, it was important to select participants who individually qualified as novice crisis management decision makers in a higher education context. The unit of analysis was the individual participant from the residence life staff or other staff members who did not hold a dedicated
emergency management role. Two groups were used in the conduct of the experiment; one group was provided with training and the use of an emergency management GIS (the treatment) and the other group was provided training and used standard emergency management tools and operating procedures. Both groups had access to the same situational information.
ProblemStatement
The problem is novice crisis managers in small IHEs without emergency
management offices lack effective decision support and collaboration tools that facilitate decision-making and situational awareness. Small IHEs may benefit from geospatial, map based tools to support decision-making and foster collaboration with outside agencies when conditions prevent local emergency management teams from arriving on site.
Given the increase of campus based incidents and the high concentration of students in a small geographic area, IHEs are expected to maintain high levels of preparedness and appropriate levels of response to emergencies due to the presumed vulnerability of students in their care (Farris & McCreight, 2014). IHEs are unique in their emergency management vulnerability due to their lack of experience in the field. Nearly two-thirds of IHE emergency managers, 64.5%, have less than five years experience, and 41.3% have fewer than three years of experience in emergency management (Sullivan, 2012).
Novice IHE crisis managers possess valuable institutional information required for critical decision-making in the early stages of a crisis. Critical information may include the number of personnel potentially affected in a crisis, the organic support
facilities available, air evacuation landing sites, and local emergency management plans and procedures. In addition, IHE emergency managers may have information relevant to hazardous material storage on campus, potential ground evacuation routes, as well as other situation dependent information. Perry, Wiggins, Childs and Fogarty (2012) indicate that although inexperienced decision-makers can be guided to attend to the same information to which experienced decision-makers attend, the decision accuracy of less-experienced decision-makers does not necessarily improve. Lack of decision maker experience appears to be an important limitation in decision performance (G. Klein, 1997; Lipshitz, Klein, Orasanu, & Salas, 2001; Todd & Benbasat, 1992). To exacerbate lack of experience, environmentally imposed time pressure, as in a crisis situation, contributes negatively to decision performance (Kahneman & Klein, 2009; G. Klein, 2008).
Dissertation Goal
The goal of this study is to investigate and disseminate the effects of using a geospatial information system for emergency management on the decision performance of novice higher education decision-makers in a simulated crisis event. The independent variable is the use of a geospatial information system for crisis management. The
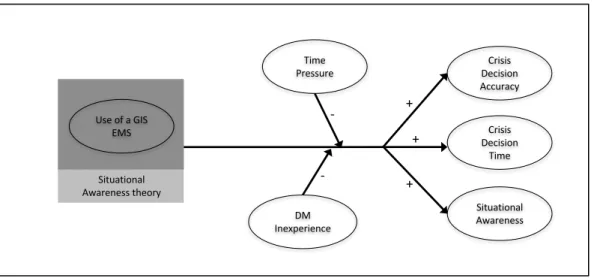
dependent variables are part of a multi-dimensional construct of decision performance defined by the time to complete a decision task, the accuracy of the decision, and an assessment of situational awareness. Constraints of the experimental environment include the moderating variables of low decision-maker experience and time pressure (see Figure 1).
Research Questions and Hypotheses
A scenario based simulation (Parker, Srinivasan, Lempert, & Berry, 2014) was conducted using a quasi-experimental research design methodology (Salkind, 2012) applied through a prototype Emergency Management GIS based system to test the following hypotheses (Hs):
• H1: Use of an Emergency Management GIS based system by a novice decision-maker reduces critical decision-making time during a simulated crisis response. • H2: Use of an Emergency Management GIS based system by a novice
decision-maker increases accuracy in critical decisions during a simulated crisis response. • H3: Use of an Emergency Management GIS based system by a novice decision-
maker increases situational awareness during a simulated crisis response. Additionally, the following research questions (RQs) will be addressed qualitatively through analysis of literature, DEA and a phenomenological qualitative approach:
Figure 1. Research model for effect of GIS Emergency Management System on Decision Performance using the underlying theory of Situational Awareness.
Situational Awareness Crisis Decision Time Use of a GIS EMS Situational Awareness theory Time Pressure DM Inexperience -Crisis Decision Accuracy + + +
• RQ1: What is known about novice decision-making in a higher education emergency management context?
• RQ2: How does the use of an Emergency Management GIS based system by a novice decision-maker affect decision-making performance, as a function of time, accuracy and situational awareness during a simulated crisis response?
• RQ3: What are the perceived benefits and drawbacks of an Emergency
Management GIS for the novice decision-maker in a higher education context? Relevance and Significance
The Higher Education Equal Opportunity Act of 2008 requires an IHE to have emergency notification and response plans and dictates a minimum of one annual exercise in order to test the plan, and conduct assessment and evaluation. An IHE must publish the procedures for communicating emergency information to the larger
community (HEOA, 2008). The ability for IHE to prepare for an emergency, respond adequately to protect life and infrastructure, recover from the damage and mitigate the local and societal impact is the primary mission of emergency management. Research in this area has focused on the professional field of emergency management such as fire brigades, emergency medical services, law enforcement, municipal emergency
management as well as non-governmental organizations (NGO) such as the Red Cross (Heard, Thakur, Losego, & Galluppi, 2014; Ley, Pipek, Reuter, & Wiedenhoefer, 2012b; Lukosch, Lukosch, Datcu, & Cidota, 2015).
The issues challenging effective inter-organizational collaboration and decision-making during extreme events include barriers to shared situational awareness (Ley et al., 2014; Mishra, Allen, & Pearman, 2013), a common language and symbol adoption in the
domain and the marked differences in normal service operation and operations during extreme events (Wu, Convertino, Ganoe, Carroll, & Zhang, 2013). Finally, extreme events generally contain high levels of uncertainty making preplanning and training less important than improvisation and quick thinking (Ley, Pipek, Reuter, & Wiedenhoefer, 2012a; Mendonça, 2007). Crisis management is a unique discipline where stakes are generally very high, the situation is fluid, rapidly changing, and full of uncertainty. Multiple agencies are generally involved in crisis management and decision-making is often distributed (Rittel & Webber, 1973; Skertchly & Skertchly, 2001). Emergency management as a profession contains various levels of expertise, training, exercise and professional development. Much of the research on information systems support for emergency management is focused on the experts who work in the field.
There is a potentially important gap of research focused on novice crisis manager decision support, collaboration and information sharing with outside agencies during extreme events especially in a higher education context (Murchison, 2010). During events of this nature, it is likely local emergency response organizations such as police, fire and emergency medical service (EMS) may be fully engaged in the most serious centers of the incident or be spread quite thin over a geographically large response area. Limited resources due to destruction, prioritization, uncertainty as to continued or follow on dangers, and potential geographic or incident based impediments to movement may leave smaller organizations struggling to cope with a crisis without immediate or even medium term local, state, or federal assistance. Under such conditions, it is likely that novices who are on the scene by virtue of their positions in affected organizations will be forced into roles for which they are ill equipped, untrained, and unprepared.
There is a general finding that a GIS context is implicit in emergency management situational awareness. It appears to be a natural vehicle in which to contextualize an emergency situation (Heard et al., 2014) and support crisis decision-making. Using a geospatial reference and augmenting familiar mapping constructs with annotations that externalize situational artifacts such as road blockages, flooded areas, weather related phenomena etc. reduces cognitive burden needed to process such contextual information (Wu et al., 2013). Disasters are inherently spatial in nature and using a GIS for emergency management provides a natural toolset for thinking spatially and making effective decisions (Tomaszewski, 2015). Understanding the impact,
requirements and design considerations for technologies that foster situational awareness and decision support to assist novice crisis managers is an area of research that is under explored.
A recent higher education emergency management survey (Sullivan, 2012) found that colleges and universities vary widely in their practices and organizational structure with respect to emergency management. The organizational location of emergency management units varies with 32% reporting locations other than Environmental Health and Safety, Public Safety, or stand-alone units. Thirty percent of IHE’s have fewer than one full time equivalent (FTE) and 43% have between one and two FTE staff members assigned to emergency management. For small colleges and universities with limited staff, it is unlikely that there is an emergency management office staffed with trained personnel. The personnel exercising emergency management responsibility are often performing the role as an additional duty (Farris & McCreight, 2014). It is time for research focused on novice crisis managers in small IHEs exploring the use of GISs to
foster situational awareness and provide decision support. Such endeavors will help start the conversation around bringing smaller entities into the larger emergency management picture. Proposing potentially transformative tools and evaluating their impact on crisis decision-making for non-expert campus crisis managers is the current research focus. Barriers
As novice emergency management decision makers are the focus of this work, the task of finding enough participants who qualify as novice emergency management
decision makers presented a barrier. In order to ensure that participants where not trained or certified in emergency management, a selection questionnaire was developed to
qualify participants for the study. Two slightly different sample populations were
identified as potential populations. The first and most preferable sample was professional staff members working in higher education who are novices in emergency management from different areas of the country. A national level professional conference that brings together these individuals would have provided a single source for participants and mitigate threats to external validity caused by a selection-treatment interaction (Creswell, 2014b) and provide for greater generalizability of results. Application was made for the conduct of a study as supported research during a national conference of student affairs professionals in higher education at the Association of College and University Housing Officers International Conference (ACUHO-I). Unfortunately, the application to conduct the study at the national conference was denied. The second potential sample population consisted of professional staff members working in higher education who are novices in emergency management located in the New England region of the north eastern United States. These participants would be found at institutions of higher education
geographically accessible for the study. Although such a sample population does increase the threat to external validity, such a limitation was necessary. Saint Anselm College, Manchester New Hampshire was chosen as the site for the study as it met the selection criterion. Finding enough qualified participants at the institution was a challenge.
Limitations
In order to conduct the simulation experiment in a timeframe that maximized subject participation, the participation was held to roughly 45-60 minutes. The scenario was accelerated in order to meet the timeline and potentially deviated from what a participant might consider a realistic sequence of chronological events. Threats to external validity include the experimental environment of a laboratory setting and the interaction of setting and treatment (Creswell, 2014b). These threats may limit the generalizability of results to on the ground decision-making in an actual emergency response.
Definitions of Terms
Acute Exposure Guidelines: AEGLs are an estimate the concentrations at which most
people experience health effects if they are exposed to a hazardous chemical for a specific amount of time. AEGL-3 is the airborne concentration, expressed as parts per million, of a substance above which most people experience life-threatening health effects or death. AEGL-2 is the airborne concentration above which most people
experience irreversible or other serious, long-lasting adverse health effects or an impaired ability to escape the affected area. AEGL-1 is the airborne concentration above which most people experience discomfort, irritation, or certain asymptomatic non-sensory effects. However, the effects are not disabling and usually reversible if exposure is removed. (NOAA, 2017).
Command, Control and Communication: The exercise of authority and direction by a
properly designated commander over assigned and attached forces in the accomplishment of the mission and the techniques and technologies used to communicate the direction (Chairman of the Joint Chiefs of Staff, 2017).
Constant Return to Scale: If output grows at the same rate as inputs, holding all else constant, the production function exhibits constant returns to scale (Basu, 2008).
Data Envelopment Analysis: A non-parametric linear programming method used to
identify decision-making units (DMUs) in a data set that are optimal in their use of single or a set of resources (inputs) in delivering a set of expected results (outputs). DEA computes both the “best practice” or efficiency frontier, in the set of DMUs, and the relative inefficiencies of those DMUs not on this frontier as compared to the optimal performing DMU. Mathematically, a DMU at the top or edge of the frontier will have an efficiency ratio of one, and those DMUs further away from the frontier will have a ratio less than one but not less than zero (Dilts, Zell, & Orwoll, 2015).
Incident Command System: A standardized approach to the command, control, and
coordination of emergency response providing a common hierarchy within which responders from multiple agencies can be effective (FEMA, 2008).
Material Safety Data Sheet: Also known as a Safety Data Sheet (SDS), it is a document
that includes information on the properties of a chemical; the physical, health, and environmental health hazards; protective measures; and safety precautions for handling, storing, and transporting the chemical (OSHA, 2018).
National Response Framework: A guide to how the United States responds to all types
of disasters and emergencies. It is built on scalable, flexible, and adaptable concepts identified in the National Incident Management System to align key roles and responsibilities across the Nation (DHS, 2016).
State Emergency Response Commissions: The Governor of each US state designates a
State Emergency Response Commission (SERC) that is responsible for implementing the Emergency Planning and Community Right-to-Know Act (EPCRA) provisions within its state (99th United States Congress, 1986).
Tribal Emergency Response Commissions: The Chief Executive Officer of each US tribe
designates a Tribal Emergency Response Commission (TERC) that is responsible for implementing the Emergency Planning and Community Right-to-Know Act (EPCRA) provisions within its tribe (99th United States Congress, 1986).
United Nations/North American Hazardous Materials Code: Four-digit numbers used
world-wide in international commerce and transportation to identify hazardous chemicals or classes of hazardous materials (United States Department of Transportation, 2016).
Virtual Table Top Exercise:A technology enabled tabletop exercise where team members
meet in an informal, classroom setting to discuss their roles during an emergency and their responses to a particular emergency situation. A facilitator guides participants through a discussion of one or more scenarios. The duration of a tabletop exercise depends on the audience, the topic being exercised and the exercise objectives. Many tabletop exercises can be conducted in a few hours, so they are cost-effective tools to
validate plans and capabilities.
Acronyms
ACUHO-I: Association of College and University Housing Officers International AEGLs: Acute Exposure Guideline Levels
ANOVA: Analysis of Variance
API: Application Programming Interface ATS: Applied Training Solutions, LLC C2: Command and Control
C3: Command, Control and Communication
CAMEO: Computer-Aided Management of Emergency Operations CEM: Certified Emergency Manager
CITI: Collaborative Institutional Training Initiative CMTS: Consequences Management Training System CRS: Constant Return to Scale
DEA: Data Envelopment Analysis DHS: Department of Homeland Security DMU: Decision-making Unit
EMGIS: Emergency Management Geospatial Information System EMI: Emergency Management Institute
EMS: Emergency Medical Service EPA: Environmental Protection Agency
GIS: Geospatial Information System HAZMAT: Hazardous Material
HAZUS: Hazard United States Software HCI: Human Computer Interaction
HSEEP: Homeland Security Exercise and Evaluation Program ICS: Incident Command System
IC: Incident Commander
IHE: Institution of Higher Education IRB: Institutional Review Board
LEPC: Local Emergency Planning Committees MANOVA: Multiple Analysis of Variance MLB: Major League Baseball
MSDS: Material Safety Data Sheet MSEL: Master Situational Events List NGO: Non-governmental Organization
NIMS: National Incident Management System
NOAA: National Oceanic and Atmospheric Administration NRF: National Response Framework
OA: Option Awareness SA: Situational Awareness
SAGAT: Situational Awareness Global Assessment Technique SART: Situational Awareness Rating Technique
TERC: Tribal Emergency Response Commissions
UNISDR: United Nations Office for Disaster Risk Reduction
UN/NA: United Nations/North American Hazardous Materials Code VTTX: Virtual Table Top Exercise
Organization of the Study
The background, problem statement, research goals, hypotheses and research questions are addressed in the current chapter. The research goal and research questions are further expanded in the following four chapters. Chapter 2 reviews the relevant literature in emergency management, geospatial information systems, situational awareness theory, decision theory and decision-making in emergency contexts. In Chapter 3, this synthesis is operationalized and applied in the mixed methods proposed research methodology in order to answer the research questions and test the research hypotheses. The research model is presented, along with the research plan,
instrumentation, measurements and conduct of the experiment. Chapter 4 presents the results of the analysis and chapter 5 provides conclusions, implications and
Chapter 2
Review of the Literature
To establish the research foundation, literature and practice is reviewed to 1) determine the appropriate cycle in disaster management for the implementation of an Emergency Management GIS (EMGIS), 2) investigate the known potential benefits and impediments to the use of an EMGIS in higher education crisis context, and 3)
understand the effect of inexperience in time critical crisis management as it relates to decision support. The related theoretical principles found in Situational Awareness (SA) theory are also reviewed as they relate to decision support.
Emergency Management
Operational and academic differences exist in the terms emergency, disaster, crisis and catastrophe. Distinctions are found largely in scope and are important in understanding how an EMGIS can be applied to each case. Emergencies are smallest in scope and are usually handled by local agencies such as emergency medical services (EMS), police, and fire (Haddow, Bullock, & Coppola, 2014). In the higher education context, an emergency may be handled by campus authorities such as campus police, campus based EMS, and/or Health Services with coordination of local authorities if required. EMGIS requirements for such events are fairly minimal as emergencies rarely play out over long periods of time and geospatial information includes only the
immediate vicinity in order to gain an awareness of the complete situation (Tomaszewski, 2015).
Disasters can be made up of several emergencies occurring at the same time, whether from the same root cause or different related causes. A disaster exceeds the
ability of local authorities to effectively respond and state level authorities are engaged to provide needed assistance. Sometimes, even national assets are required if the state emergency management capabilities are over taxed by a disaster (Haddow et al., 2014). In 2008, the Federal Emergency Management Agency (FEMA) created the National Response Framework (NRF) which “describes additional specific Federal roles and structures for incidents in which Federal resources are involved” (FEMA, 2008, p. 12). When disasters are declared at the national level, federal departments and agencies adhere to the roles and responsibilities defined in the NRF in support of the local
emergency management, non-governmental organizations (NGO’s) and the private sector which includes IHEs. Implementation of an EMGIS is more complex due to the scope of the situation, the data required for the GIS, and the interagency coordination necessary in such a large-scale event.
A crisis is generally referred to as a point in time event, perhaps within the context of a disaster, as events unfold and lead to a potential increase in a dangerous situation (Haddow et al., 2014). An example might be a critical care hospital whose back up generation is disabled due to water damage during a hurricane. The hurricane disaster risk is further exacerbated by the hospital crisis. A crisis is an excellent candidate for an EMGIS if the system is already employed in the management of the disaster as it
provides excellent information about the larger context that may impact the operational needs of the crisis.
Finally, there is much debate in the academic community over definitions, for the purposes of this research a catastrophe is a larger scale and more socially impactful disaster. Catastrophes may induce social conditions that are potentially different from
disaster environments including long term transportation disruption, health care issues, housing concerns, economic impacts and movement or relocation of affected people (Wachtendorf, Brown, & Holguin-Veras, 2013).
Managing, responding and reacting to emergencies, disasters, crises and
catastrophes are all considered part of the emergency management domain. Emergency management as a discipline can be defined quite simply as a “discipline that deals with risk and risk avoidance” (Haddow et al., 2014, p. 2). Early history in the discipline begins with the Flood Control Act of 1936 and the subsequent merger of the Federal Civil Defense Administration and the Office of Defense Mobilization into the Office of Civil Defense and Mobilization in 1958. The current federal organization, FEMA was established in 1978 under President Jimmy Carter. The 1993 World Trade Center
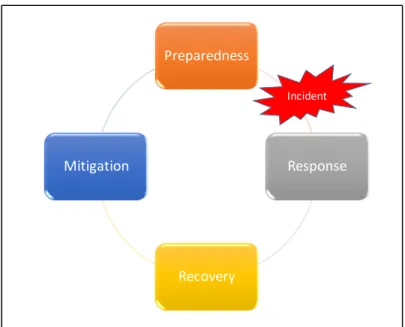
bombing in New York City and the Oklahoma City Federal Building bombing ushered in a new era of emergency management as terrorism became a national priority. FEMA published a new community-based approach called Project Impact: Building Disaster-Resistant Communities (Haddow et al., 2014). The project called for communities to establish partnerships across the community to include all stakeholders and private sector business entities and NGOs (FEMA, 1993) which includes both private and public IHEs. FEMA established a disaster management cycle consisting of preparedness, response, recovery and mitigation (see figure 2).
After the terrorist attacks of 9/11 on the World Trade Center and the Pentagon, the Department of Homeland Security (DHS) was created by executive order under the Homeland Security Act of 2002. Unification of many disparate agencies under an Incident Command System (ICS) proved successful during the attack on the Pentagon (Harrald, 2012). Creation of the DHS formalized the relationships bringing together 22 Federal agencies (107th Congress, 2002). Subsequently, a number of Presidential Policy Directives (PPD) were issued including PPD-5 which directed the formation of a
National Incident Management System (NIMS). The NIMS framework included the ICS (PPD-5, 2003). NIMS was designed to provide a common organizational structure to facilitate incident command, operations, planning, logistics, and finance regardless of what might be multiple internal organizational structures involved in an incident. As of 2004, all organizations in the United States were expected to use the ICS structure to guide response efforts regardless of the incident’s cause, size, or complexity (Jensen &
Preparedness
Response
Recovery Mitigation
Incident
Figure 2. FEMA Disaster Management Cycle adapted from “FEMA (1993). Building disaster-resistant communities: Project impact guide book.”
In 2003, FEMA, now under the DHS published a guidebook on building the disaster-resistant university. The guide extended the whole community approach to emergency management into the university setting. The guide underscored the millions of dollars in disaster assistance provided by FEMA to both private and public universities and colleges in the United States. It further solidifies national interest in protection of IHEs through the $15 billion dollar annual research grant investment by the federal government (FEMA, 2003). The guide provided a four-phased approach to developing a disaster resistant university:
1. organizing resources,
2. hazard identification and risk assessment, 3. developing the mitigation plan and 4. adoption and implementation.
Several of the phases rely on detailed campus wide and local community mapping technologies to inform related activities. GIS systems were recommended as an appropriate tool for creating detailed hazard profiles, predicting scope and extent of potential damage associated with a particular hazardous incident, as well as identifying potential vulnerabilities. The FEMA guide book specifically detailed the type of information needed in a GIS (2003):
The base map should extend beyond the campus boundaries to include campus-related facilities such as residential areas, local fire stations, transportation facilities, and fraternity and sorority buildings. Coordinate this activity closely with surrounding local officials. Placing this map on a geographic information system (GIS) will make it more useful as the project progresses and the data
become more complex. GIS can be used to store and access the mapping information, displaying the areas, systems, and functions that are at risk and graphically depicting potentially damaged areas and buildings, costs of repair, and concomitant threats to operations that will assist in setting mitigation priorities (p. 23).
GIS systems were recommended for use during remaining phases but have to be appropriately prepared with the necessary information and overlays in the hazard identification and risk assessment phase. FEMA provides Hazard United States
(HAZUS) software for free which uses GIS technology to estimate physical, economic, and social impacts of disasters. HAZUS graphically illustrates the limits of identified high-risk locations due to earthquake, hurricane and floods. Users can download state specific information to use within the GIS and enable visualization of the spatial
relationships between populations and other geographic elements for the type of incident being modeled (FEMA, n.d.). FEMA Publication 386-2: Understanding your risks - Identifying Hazards and Estimating Losses (2001) states, “maps produced with GIS can help to explain hazard events, predict outcomes, visualize scenarios, and plan strategies” (p. 6).
Geographic Information Systems in Emergency Management
Command and control have been of interest to the Human Computer Interaction (HCI) community for many years (Heath & Luff, 1992; Roth et al., 1998; Scott, Wan, Rico, Furusho, & Cummings, 2007) with special attention to the technologies designed to foster situational awareness and collaboration. More recent research has taken advantage of the technological advances in ubiquitous connectivity and readily available geospatial
information system application programming interfaces (API). These APIs provide standards based tools such as content object replication kit (CORK) and GeoTools for the development of research vehicles in geospatial systems and subsequent use in crisis management contexts (Wu et al., 2013). Through two iterative prototypes, a set of design guidelines for geo-collaboration supporting systems was developed. Following on this work, Ley et al. constructed an Inter-Organizational Situational Assessment Client (ISAC) paired with an Inter-Organizational Information Repository (IOIR) based on several Open Geospatial Consortium (OGC2) tools and Google Maps (2014). They
focused on the mechanism of improvisation at work in real world crisis management and their work encompasses inter-organizational crisis management as well as
geo-collaboration and expertise sharing. Cuevas et al. developed PinPointTM using similar
open source technologies to provide coverage planning, and response coordination with a shared annotated GIS basis for Red Cross Disaster Action Teams (Cuevas, Jones, & Mossey, 2011). Similar research in distributed synchronous collaboration for emergency response in extreme weather scenarios also capitalized on open source products.
Products included the Renaissance Computing Institutes (RENCI) open source
Geoanalytics System (RENCI, n.d.), MongoDB, Django and PostGIS in the development of BigBoard (Heard et al., 2014). BigBoard supports both mobile and desktop interfaces for collaboration over a shared map-based paradigm with situational annotations and overlays.
Prior research efforts have much in common, although slightly different in their approaches as well as the specific research questions. In practice, a map or GIS based display is an effective tool for fostering situational awareness (SA), confirming earlier
research into decentralized command and control environments. In a crisis, the novice will be more easily overwhelmed with information and this could hinder their ability to process relevant information and result in a decrease in decision performance (Perry et al., 2012).
Using a geospatial reference and augmenting familiar mapping constructs with annotations externalizing situational artifacts such as road blockages, flooded areas, weather related phenomena etc. provides a reduced burden on cognitive overhead needed to process such contextual information (Wu et al., 2013). Research to date has confirmed that SA is a critical and ongoing activity that informs decision-making and subsequent action in emergency response (Ley et al., 2014) and that a geospatial paradigm is an effective technology for SA in a distributed environment (Gorman, Cooke, & Winner, 2006; Wu et al., 2013). Recent studies lean quite heavily on Situational Awareness Theory.
Situational Awareness Theory
Situational awareness has long been a staple construct of the HCI community and codified in 1995 with a long standing theory by Endsley (1995) who recently defended it (Endsley, 2015a, 2015b). SA for an individual in an emergency management context is composed of three levels: perception, comprehension and projection. Perception, or Level 1 SA, involves attending to the important attributes and information in the affected emergency environment. Level 1 SA requires monitoring the situation, cue detection, and recognition of relevant situational elements and their current condition.
Comprehension, or Level 2 SA, of the situation is achieved through synthesis of the relevant elements recognized in Level 1 SA and an understanding of their significance in
light of the goals of the crisis manager. A novice crisis manager may not be able to extract the broader meaning of the Level 1 elements as well as a more experienced one. Finally, a crisis manager is able to project the future actions or states of the relevant elements recognized in Level 1 and operationalized in Level 2 in order to be actionable in the projection, or Level 3 SA (Endsley, 1995b, 2004; Kaber & Endsley, 2004). The crisis manager seeks necessary information and balances information seeking against the goal driven requirements of the crisis, protecting life, protecting property, adhering to time constraints, etc. Extreme situations are most often very time sensitive and characterized by significant uncertainty compounding the achievement of Level 3 SA for a novice. The theoretical framework for shared or team situational awareness is the largely the same as that for individuals with differing team members having responsibility for different Level 1-3 artifacts. The extent to which shared SA is gained is the extent to which members of the team have SA with respect to the elements of the situation for which they are
responsible and that are communicated effectively to the team (Endsley, 1995b, 2012). A more recent extension of situational awareness in decision-making is the idea of Option Awareness (OA). OA is a compliment to SA and is defined as the perception and comprehension of the relative desirability of the available options in a decision scenario. This comprehension extends to the underlying factors and trade-offs that explain that desirability (M Pfaff et al., 2013). Similar to SA, OA is described as a series of levels of deeper comprehension of options, their relationships and subsequent future projection for creative option generation. Level 1 is the perception of the relative robustness of
alternative options, Level 2 is deeper comprehension of relationships between factors underlying the option outcomes, and in Level 3 OA decision makers modify options or
creatively generate new options (G. L. Klein, Drury, Pfaff, & More, 2010). These three levels of perception, comprehension, and creative revision of options can be paralleled with the three levels of SA. SA, however, is concerned with awareness of elements in the situation space, OA is concerned with awareness of elements in the decision space. OA has been largely investigated with visualization tools to increase comprehension and has been applied to collaboration in emergency response operations and public health crisis management (Liu, Moon, & Pfaff, 2011; Mark Pfaff, 2015).
Decision-making in Emergency Management
Laakso and Palomäki define three simplified questions all emergency
management decision-makers face: “1. What has happened and what is happening? 2. What should be done now (and next)? and 3. How can we gather the necessary resources available to do that?” (p. 1712). In the early stages of a crisis or disaster, the first people on the scene are generally from the affected organization. Assuming the role of an incident commander, making appropriate decisions, acting as effectively as possible and communicating with those affected and emergency services is vital (2013).
The research into decision support for emergency management to date has largely been conducted using emergency management teams that have a fairly high level of experience. Perry et al. (2012) found that although inexperienced decision-makers can be guided to attend to the same information to which experienced decision-makers attend, the decision accuracy of less-experienced decision-makers does not necessarily improve. It is the lack of experience in the decision-maker that appears to be an important
limitation in decision performance (G. Klein, 1997; Lipshitz et al., 2001; Todd & Benbasat, 1992). To exacerbate the lack of experience, environmentally imposed time
pressure, as in a crisis situation, contributes negatively to decision performance
(Kahneman & Klein, 2009; G. Klein, 2008). Mishra et al. (2013) confirm prior research that suggests quite strongly that novices make decisions in entirely different ways than do experienced decision-makers. They conclude that it is imperative to study the
information practices of novice and experts separately when working under environments that are time constrained, complex and uncertain. Novices tend toward normative
decision-making strategies and experienced decision-makers tend toward more intuitive recognition primed models (G. Klein, 1997; Lipshitz et al., 2001; Todd & Benbasat, 1992). The models to which experts have access are developed over time as decision-makers. These models are born of exposure to a history of events and decision outcomes. Experts match the current scenario with scenarios that are similar in their history and select the model that most closely matches and may only need minor adjustments to apply to the current situation (G. Klein, 1989, 2008). Exacerbating the problems faced by a novice emergency manager is the difficulty in accepting the recommendations of an outside agency without the ability to comprehend at a Level 2 SA and therefore be unable to reach the Level 3 SA that calls for an action. They simply lack the appropriate
situational history available to a more experienced decision-maker to successfully operationalize the elements present and validate the recommendations. Additionally, decision-makers often discount the advice of more experienced decision-makers (Bonaccio & Dalal, 2006) often preferring their original decision choices above those recommended by experts (Dalal & Bonaccio, 2010; Fischer & Jungermann, 2014; Yaniv, 2004).
The area of emergency management information systems and emergency management decision support systems is a difficult one. In order to study the context adequately, field studies of real crisis management or reasonable simulations of scenarios are necessary. This type of research is either inaccessible or often cost prohibitive. In a recent review of 8,408 papers over two decades in the knowledge management domain there were only fifty-one (0.6%) papers that investigated applied-Knowledge
Management Systems for disaster/emergency management (Dorasamy, Raman, &
Kaliannan, 2013). Thankfully, crisis situations on even a medium scale do not occur with great frequency so the practical application of even the best research is limited by the nature of the problem. However, the incredibly high stakes and potential impact of a crisis situation on the loss of life and property should make the research stream a much more worthwhile pursuit in an applied context.
Chapter 3
Methodology
Overview
Investigating a potential solution to the lack of effective decision support and collaboration tools that facilitate decision-making and situational awareness faced by novice crisis managers in small IHEs suggests the following research methodology. It is hypothesized that a novice decision maker may benefit from geospatial, map-based tools to support decision-making and foster collaboration with outside agencies when
conditions prevent local emergency management teams from arriving on site in the early moments of a crisis.
A scripted simulation of an emergency event was conducted with one participant at a time. Although two participants were in the same simulation at the same time, they were unaware of the other and there was no interaction between them. Each of their actions and decisions were independent and in different rooms. From the participants’ perspective, they were conducting the study alone. At specified decision intervals in the scenario, computer automated dialogs appeared and the participant was instructed to choose the best decision based on the situational knowledge they had at that time in the scenario problem. The scenario continued on an automated timer until completion. Time required to make the decision was measured, the decision itself was recorded, and a post simulation instrument was administered immediately following the scenario conclusion to assess situational awareness. Two groups were formed by random assignment from the participant list for the experiment. The first group was the treatment group and was trained on and used an EMGIS during the simulation. The second group did not have an
EMGIS available for use. Instead, the second group had the 2016 Emergency Response Guidebook, paper maps of the scenario area, and an information binder about the
buildings and the incident site. Qualitative follow up in the form of structured interview questions were conducted for the treatment group.
Research Design
The research design was a mixed methods sequential explanatory design (Creswell, 2014a). Mixed method research designs have gained wide acceptance in social science research (Creswell, 2014a, 2014b; Johnson, Onwuegbuzie, & Turner, 2007; Onwuegbuzie & Wilson, 2003; Tashakkori & Creswell, 2007; Tashakkori & Teddlie, 2010). Neither a post-positivist philosophy leaning toward purely quantitative research methods (Phillips & Burbules, 2000) nor a constructivist philosophy leaning toward purely qualitative methods (Lincoln, Lynham, & Guba, 2011) are appropriate for the research questions articulated here. A pragmatic worldview was espoused not committed to any single philosophy, but focused on the research problem itself and open to whatever methods will best arrive at a solution or greater understanding (Tashakkori & Teddlie, 2010). The design was quantitative dominant as the research relied on a quantitative method for initial experimental data collection while concurrently recognizing that the addition of qualitative post experimental data collection and subsequent analysis to yield a greater depth of understanding of the research problem and potential solutions. The quantitative strand of research was concerned with the measurable impact of an EMGIS on decision time, decision accuracy and situational awareness. Comparison of treatment vs no-treatment groups may or may not yield statistical significance, hence the qualitative follow up. The qualitative strand was concerned with a richer explanation of the
interaction between the variables and the impact of the treatment in addition to the quantitative statistical result. The specific design for the quantitative research strand was quasi-experimental. The specific design for the qualitative research strand was a
combination of non-parametric statistical method in the form of Data Envelopment Analysis and phenomenological method using structured interviews. Data analysis was the point of mixture of the methods in order satisfy the quantitative and qualitative goals of the research (Creswell, 2013; Salkind, 2012; Tashakkori & Teddlie, 2010).
Approach
A simulation, more specifically, a computer based virtual table top exercise similar to those used for training at the FEMA Emergency Management Institute, was conducted with one participant at a time acting as the incident commander during the scenario based simulation (Parker et al., 2014). Simulation has been used quite effectively in the emergency management field for training and evaluation (Dugdale, Saoud, Pavard, & Pallamin, 2015). The crisis scenario was as realistic as possible for the participant as well as sufficiently specialized to require information seeking and good SA. Throughout the course of the simulation, a set number of decisions were required of the participant at specific and consistent times. The scenario required that decisions be made prior to moving on in the scenario although events continued to progress in order to realistically simulate decision time pressure (See Appendix A). No geospatial data were collected during the research. All field data points were simulated. Although
participants were told that weather conditions were automatically updated through the EMGIS connection to the National Oceanographic and Atmospheric Administration (NOAA), the connection was simulated. Additionally, participants were told that the
EMGIS was connected to the state GIS system and that the state would be updating incident locations and road closures, the connection was also simulated. For both groups, the non-emergency management GIS (nonEMGIS) group and the EMGIS group, the same information relevant to the decision scenarios was provided. The manner in which the information was provided was different for each group. The EMGIS group was able to select layers in the EMGIS using custom coded intuitive buttons to overlay
information on the GIS system and select informational attributes from the GIS artifacts (See Appendix B). The non-EMGIS group had the 2016 Emergency Response
Guidebook and aforementioned informational binders (See Appendix C). Each group had a period of training designed by the researcher, and conducted by previously trained undergraduate research assistants to familiarize them with the resources they had
available to them in the conduct of the simulation. The EMGIS group received training on the EMGIS. The non-EMGIS group received training on the use of the Guidebook, and an orientation of the other informational assets available to them. Training took approximately 15 minutes with the non-EMGIS participants usually taking slightly less time to complete the training. The training provided was specific to the operation of the EMGIS or use of the materials provided. Training did not include emergency
management nor crisis response training. The scenario from start to finish took between 23 and 30 minutes and five decision choices were required of the participant. No outside agency coordination was required as all events were simulated.
Research Questions
In order to test H1, that decision time is positively affected by an EMGIS, the time to make a decision was measured during the experiment. Decision time is a fairly
straightforward construct and is defined as the time required to reach a decision outcome (McGrath, 1990, 1991). A software based timing application was developed to allow research assistants to accurately collect decision time information for each of the five required decisions in the scenario. Time was started when the decision was required in the simulation and stopped when the decision was rendered. The decision time was recorded by the research assistant on a timing sheet.
In order to test H2, that decision accuracy is expected to increase through the use of EMGIS, the accuracy of each required decision during the scenario was measured. In the definition of decision accuracy, it is useful to understand the type of task in order to define the construct. Strauss (1999) suggest that the type of task has a significant effect on performance. McGrath (1984) proposed a task circumplex that has since been widely used. McGrath proposed that the majority of tasks conform to specific categories created around four fundamental processes: generate, choose, negotiate, and execute. Creative tasks found often in marketing, such as brainstorming, planning etc. involve processes of idea generation. Intellective or problem-solving tasks involve processes such as selecting correct answers, and judgment or decision-making tasks involve processes needed to reach consensus on a ranked answer. Conflict resolution involves processes around negotiation, and execute tasks actually require physical processes such as moving to a location or engaging environmental conditions. The research design is concerned with
choose tasks, which McGrath categorizes into intellective where a problem has a correct answer and judgment where there is no absolute correct answer and decision-makers settle on a preferred answer. As intellective tasks have a correct answer, the decision accuracy construct is defined as the difference between the decision-maker’s choice and
the prior choice determined from the answers of experts. As judgment tasks have no absolute correct answer, the decision accuracy construct is defined as the difference between the decision-maker’s ranking and the prior ranking determined from a panel of experts (Adams, 2005). There was always a best answer for each decision point. Prior expert rankings were used to rank order the four choices for each of the five decisions. A decision booklet was developed that contained the exact verbiage of the system-generated dialog for decision choices and participants simply circled their preferred answer in the booklet. Decision time stopped when an answer was selected, and decision accuracy was recorded as a numeric decision value on a scale of one to four with four being the best decision and one being the least optimal. Participants were not allowed to look ahead in the decision booklet prior to the request for rendering the next decision.
In order to test H3, that SA will increase through the use of an EMGIS, SA was measured using a standard rating scale. SA was measured using the Situational
Awareness Rating Technique (SART) (Taylor, 1990) administered post scenario (See Appendix D). The SART responses were calculated and score for each SA component (understanding, attentional demand, and attentional supply) as well as the single composite SART score were recorded for each participant.
In order to answer RQ1, what is known about novice decision-making in a higher education emergency management context a literature review was conducted and
presented in chapter 2.
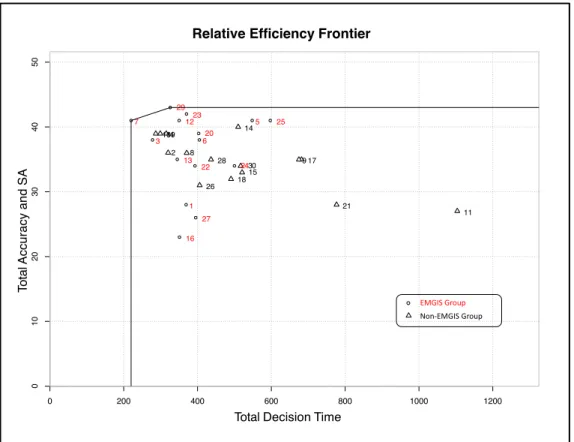
In order to answer RQ2, does the use of an EMGIS affect decision-making performance, as a function of time, accuracy and situational awareness, a Data Envelopment Analysis (DEA) was performed with the input of decision time and the
outputs of decision accuracy and situational awareness. A relative efficiency frontier was constructed from the efficiency scores for each participant. DEA is used to identify what are referred to as decision-making units (DMUs) in a data set that are optimal in using a single or a set of resources (inputs) in delivering a set of expected results (outcomes). DEA has been called balanced benchmarking and is supported by several software packages including benchmarking libraries in R as well as Microsoft ExcelTM. The heart
of DEA is nonparametric linear programing methods. DEA computes both the best practice or efficiency frontier, in the set of DMUs, and the relative inefficiencies of those DMUs not on this frontier as compared to the optimal performing DMU. Mathematically, a DMU at the top or edge of the frontier will have an efficiency ratio of one, and those DMUs further away from the frontier will have a ratio less than one but not less than zero (Dilts, Zell, & Orwoll, 2015). DEA has been used to determine between group effects of a restaurant chain’s use of an information system with others in the chain that did not use an information system (Banker, Kauffman, & Morey, 1990). Group comparisons were investigated around software programmer productivity for projects with and without a structured development methodologies (Banker & Kauffman, 1991). DEA has been used to compare operational efficiencies of bank branches with PIC (personal investment center) versus those without, national trading banks compared to regional banks, online shopping efficiencies under two different web site designs, comparison of different R&D programs, economic efficiencies of banks in Brazil with those in Europe and even the performance of the MLB (Major League Baseball) in regular season and post-season (Avikiran, 2000; Golany & Storberg, 1999; J. Hahn & Kauffman, 2002; Lee, Park, & Choi, 2009; Lewis, Lock, & Sexton, 2009). Much research has been published espousing
the use of DEA efficiency scores in a two-step analysis process where parametric measures are used with the DEA efficiency score (Banker, Zheng, & Natarajan, 2010). There is disagreement on the efficacy of such approaches and more research is required (Hirschauer & Musshoff, 2014; Sinuany-stern & Friedman, 2016). A DEA model based on a constant return to scale (CRS) was used as a non-parametric measure in answering research question two in recognition that decision time, decision accuracy and situational awareness are likely related in non-trivial ways.
In order to answer RQ3, and understand the perceived benefits and drawbacks of an Emergency Management GIS for the novice decision maker in a higher education context, a qualitative assessment of the use of an EMGIS was measured through structured interviews with EMGIS group participants immediately following the
conclusion of the simulation and the SART administration. Questions were structured in terms of evaluation of the overall impact, issues or concerns with EMGIS use in a higher education context, and positives and negatives with EMGIS. Thematic analysis was conducted through an open coding method followed by an axial coding method of the interviews (Creswell, 2013).
Procedures
IRB approval from both NOVA Southeastern University and Saint Anselm College (the site) was received (See Appendix E and F). A convenience population of Student Affairs and other College employees from the site who could potentially find themselves forced into service during a campus incident was compiled with the assistance of Student Affairs leadership (See Appendix G). Forty-nine invitations to participate were sent via email. The email contained a link to the qualification questionnaire that
collected relevant demographic data and experience assessment (See Appendix H). Thirty-two questionnaires were completed and screened to ensure that participants were novices in emergency management (65% response rate). Two respondents were screened out as unqualified leaving 30 qualified participants. Participants were assigned a
participant identification number from one to 30 and the identification numbers were randomly assigned to two experimental groups using an online program from GraphPad (GraphPad Software Inc., 2017). Participants were scheduled over a four-week period attempting to schedule two at a time where possible. Four undergraduate research assistants where chosen and subsequently CITI certified using the guidelines from the hosting institution and Nova Southeastern University IRB. Research assistants were provided scripts for training and the conduct of the experiment and several test runs were conducted with the research assistants.
The experiment employed two complete participant computer systems for the simulation and treatment located in different rooms. The rooms were sufficiently far away from one another to disallow sound and conversational bleed over but close enough to easily move between. Each computer system was outfitted with dual monitors, a single keyboard, mouse and audio speakers. Each participant was provided a notepad and pen for note taking if desired. Each system contained identical software to include a web based simulation using an automated Master Situational Events List (MSEL),
training video, and a pre-loaded operational EMGIS. The MSEL simulation and exercise control construct is a common software planning and execution tool for the conduct of emergency management, law enforcement and military command, control and
presented to the participant along with the necessary timing of the events. The MSEL software implementation, provided by a third-party company, uses a message-centered approach to present the scenario and the events that occur as the simulation moves forward in time. In the military and FEMA exercise domain, each message or piece of information provided to participants throughout the scenario is called an “inject”. Given a particular scenario, information critical to the participant is injected into the scenario at predetermined times or at predetermined situational event triggers. The inject list, verbiage and timings were developed and validated in advance. A short three-and-a-half-minute training video was developed using Camtasia that provided an overview of using the simulation software (TechSmith, 2017). Use of the software was very straightforward requiring only that the participant click on the messages as they arrived to read them.
Each computer system was also pre-loaded with an operational EMGIS. The EMGIS was a commercially available product, ESRI ArcMapTM version 10.5.1, that
lacked any of the emergency management features required. Software development was conducted using the provided Python language extensions for ArcMapTM (arcPy libraries)
and several Arc add-ins were created. The add-ins included a button to launch a chemical database, a chemical danger zone predictor, and a chemical danger zone layer toggle button. The buttons were aggregated into an EMGIS toolbar and installed on the main screen. The EMGIS was loaded with street, municipal and aerial imagery of the scenario target school, Saint Joseph’s College of Maine. This simulation location was chosen to ensure that all participants had roughly equal knowledge of the geography. Using the site as the simulation school could have unfairly advantaged participants who had spent many years at the site over relatively new personnel. Each building was overdrawn with a
polygon and color coded based on its usage. The GIS database was updated to carry attributes about each building accessible by the user with the ArcMapTM identify tool.
For the non-EMGIS group, binders were created with street level and aerial imagery from Google Maps of the target school with three different levels of zoom for a total of six maps. A Campus map from the school website was included with building names in the legend. Additionally, the same data provided in the ArcMapTM attribute
tables was included in the binder. A photograph of each building with the attribute data below was included in the binder. Two color printed and spiral bound copies of the 2016 Emergency Response Guidebook were also created. With two identically configured experimental workstations and two copies of all materials required for the experiment, random assignment to groups and scheduling of participants was facilitated. If a participant was in the non-treatment group (no EMGIS), one of the two monitors was simply turned off and the Guidebook and Binder were provided. As it was preferable, for expediency, to run two participants at the same time it didn’t matter what group the participant was in as the simulation and timings were the same and both experimental stations could handle either group.
Participants arrived at their scheduled time and were introduced to their research assistant. Consent forms were reviewed and signed by the participant and the research assistant began the experimental protocol. Participants were oriented to the environment and the materials they had available to them during the simulation. The training video for use of the simulation tool was played and any questions answered. Training on the use of the tools available, dependent on the group, was provided using a standard script