I
Cane Breeding
SELECTION INDICES FOR
HIGH
YIELD
IN
SUGARCANE
V.G. Dosado, R.E. Tapay and H.M. Miayo Philippine Sugar Commission
La Carlota City, Philippines I
I
I
ABSTRACT
Selection indices for high cane and sugar yields were determined
from ten experiments for three cropping seasons.
The zero order correlation coefficient and the coefficient of de-
termination indicated that high sugar yield was primarily due to ton-
Stalk weight and millable stalks per stool were closely associated
with high tons cane per hectare and explained most of the variance in
sugar yield among the tonnage yield components.
The most stable and desirable index for selection for high tons
cane and sugar yields was more millable stalks per stool.
l
NTRODUCTION
Sugar yield and other economic traitsare controlled by many genes. As quan- titative characters, they are easily influenced by changes in the' environment. For be exercised in picking out clones in the F1 popula- tion after hybridization so that selections are genetic rather than environmental
The expression of a plant character may also be influenced by other traits. Quantitative estimates of these relationships may provide information useful in
A more reliable selection criteria i s necessary. The selection indices should not be only closely associated with high yield but it should also be easily distin- guished visually, relatively stable among varieties and environmental conditions, and preferably pre-harvest characters. These selection indices could be obtained from my parent used in hybridization. According to Hebert4, stalk diameter, erectness of stalk, stalk per stool and brix of progeny could be predicted from the character- istics of the parents.
I
1105 CANE BREEDINGEmpig e t a1.3 reported regressjon as 9 means of determining stability. If B = 0, it means that the genotype has little or no response to changing environment. The most desirable genotype i s one with high mean and low "b" in tests in sevpral locations.
In this study, the association of some characters with tonnage and the magni- tude of their influence on sugar production were analyzed. The parameters of stabi- lity of these characters as tonnage and sugar yield components and the influence of other traits and varieties from ten experiments for three cropping seasons were evaluated.
MATERIALS AND METHODS
I
Widely grown varieties differing in yield components were used. Phil 56226, I high in picul sugar per ton cane (PS/TC) and medium in tonnage, and Phil 6007, I high in tons cane per hectare (TC/Ha) and medium in sugar quality were planted 331
cm in rows one meter apart. The varieties were distributed a t random in plots$ifSI
x1
five meters. The plots were fertilized wiih 200-100-350 kilograms per hectare pf nitrogen, phosphorous and potassium, respectively, a t planting.All data were taken at harvest. The stalks in the inner three rows and 4.3
1
of each plot were harvested for yield. Fifteen stalks selected a t random from eachI plot were used for juice analysis.
RESULTS AND DISCUSSION
The Relationship of Cane Yield and Sugar Quality with other Plant Characteristics
I
I
The varieties differed in their important sugar yield components. Phil 56226 was stable in sugar quality as indicated by low "b" and high mean. It produced, gg-
nificantly better PS/TC while Phil 6607 was outstanding in TC/Ha ( ~ a p l k '
1).
. TABLE 1. Means and regression values of some plant characters of two ra0&@mended sugarcane varieties
f;
1
, I
M E A N 1/ Regression Values 2/ C H A R A C T E R S
Phil 5 6 2 2 6 Phil 6 6 0 7 Phil 5 6 2 2 6 Phil 6 6 0 7
1. Stalk diameter (cm) 2 . 6 2 b 2 . 9 8 a 19.62" - 5 9 . 4 8 2. Stalk length (cm) 257.15 b 2 8 7 . 5 8 a 0.64" 10.57 3. Millable stalk/stool 3 . 0 5 a 3 . 3 0 a 21.48" 3 5 . 5 1 * * 4. Stalk weight (kg) 1.01 b 1.20 a 59.59 1 3 8 . 2 8 * * 5. Picul sugar per ton cane 1.92 a 1.75 b 8 7 . 2 0 115.53 6. Tons cane per hectare 8 7 . 2 0 b 115.53 a 46.30' * 74.8 1 * * 7. P icu Is sugar per hectare 1 6 0 . 0 0 b 2 0 3 . 6 0 a
I / Means with similar letters between varieties are not significant a t HSD 0.05
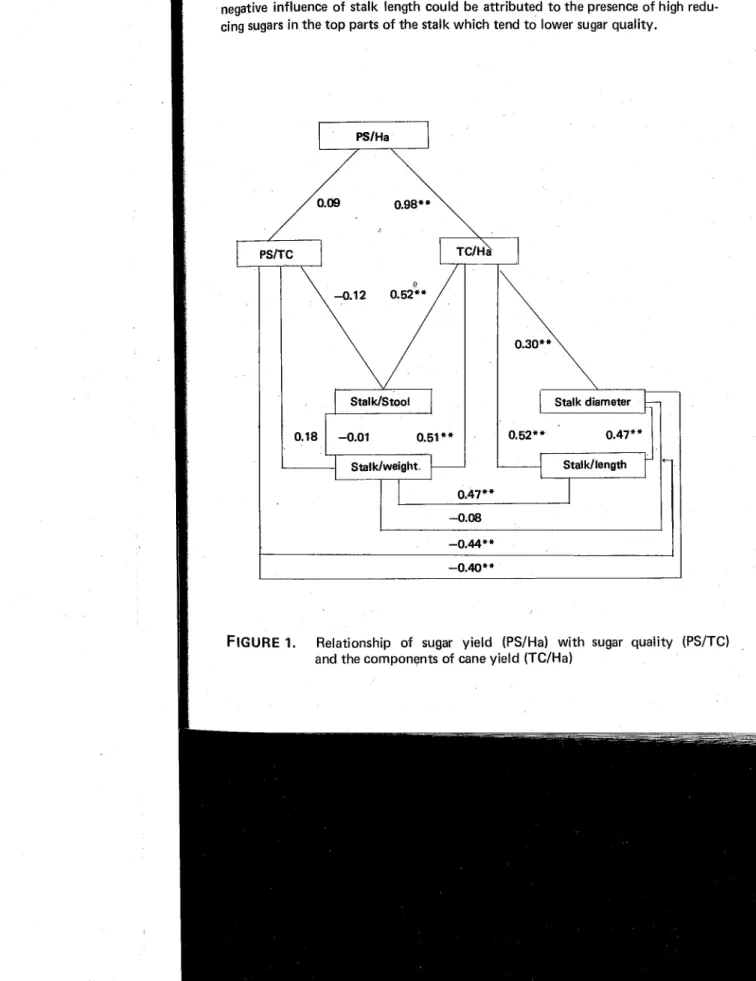
V. G. DOSADO, R. E. TAPAY AND H. M. M I A Y O 1106 High degree of interdependence existed between diameter, length, weight and number of millable stalks per stool with tons cane per hectare (Fig. 1). These were indicated by positive correlation coefficients, all significantly different from zero a t one per cent level. Stalk weight which i s a function of 'tonnage was more influenced by stalk length (0.47"") than by stalk diameter (-0.08).
Of these plant characters, stalk diameter (-0.40"") and stalk length (-0.44"") showed negative' and significant influence on sugar quality. The greater negative influence of stalk length could be attributed to the presence of high redu- cing sugars in the top parts of the stalk which tend to lower sugar quality.
PSlHa
-0.44** -0.401*
FIGURE
1. Relationship of sugar yield (PS/Ha) with sugar quality (PS/TC)stalk Coef. .59
*
.49
*
.80*
"29
V. G. DOSADO, R . E . TAPAY A N D H. M. M I A Y O
REFERENCES
1. Odsado, V.G., R.E. Tapay and H.M. Miayo (1978). Charac!ers associated with yield of sixteen sugarcane varieties. Paper read at the 26th Philsutech Annual Convention, PICC, Manila.
2. Empig, L.T. (1972). Sugarcane breeding philosophy for the Philippines. Proc. 20th Philsutech Annual Convention, Makati, Rizal. pp. 65-68.
3. Empig, L.T., E.L. Lapastora, L. Cosico and B. Magajes (1976). Factors affect- ing stability of performance of sugarcane varieties. Paper read at the 24th Philsutech Annual Convention, lloilo City, Philippines.
4. Hebert, L.P. (1965). A brief review of genetics of sugarcane. Proc. Interna- tional Society of Sugarcane Technologist. pp. 751-753.
5. Rosario, E.L. (1977). Some behavior of the sugarcane plant in increasing effi- ciency in sugar production. Paper read at the 25th Philsutech Annual Conven- tion, PICC, Manila, Philippines.
INDICES DE SELECCION PARA ALTOS RENDIMIENTOS
EN CARA DE AZUCAR
V.G. Dosado, R.E. Tapay y H.M. Miayo
RESUMEN
Ee determinaron indices de seleccion a partir de
10
experimentos
durante tres cosechas. El coefficiente de correlacion de orden car0 y
el coefficiente de deteminacion indicaron que 10s altos rendhnientos de
azucar se debieron primeramente a1 rendimiento agricola.
El peso de 10s tallos y 10s tallos molibles por planton estuvieron
asociados fuertemente con altas toneladas de caiia/hectarea y explica-
ron la mayor parte de la variacibn en re~ldimientos de aziicar entre las
toneladas de 10s co~nponentes
del rendimiento.
El indice mas deseable y lnas estable, para la seleccion de altos
rendimientos de azucar y de caAa fue tallos nlobible por planton.