Smoke and Fire Detection Base on Convolutional
Neural Network
ELVIRA SUKMA WAHYUNI, MUHAMMAD HENDRI Universitas Islam Indonesia
Email: [email protected]
Received 20 Maret 2019 | Revised 11 Mei 2019 | Accepted 4 Juli 2019
ABSTRAK
Deteksi api dan asap adalah langkah pertama sebagai deteksi dini kebakaran. Deteksi dini kebakaran berdasarkan pemrosesan gambar dianggap mampu memberikan hasil yang efektif. Pilihan metode deteksi adalah kunci penting. Metode ekstraksi fitur berdasarkan analisis statistik dan analisis dinamis kadang-kadang memberikan akurasi kurang akurat dalam mendeteksi asap dan api, terutama pada deteksi asap, hal ini disebabkan oleh karakteristik objek asap yang transparan dan bergerak. Dalam penelitian ini, metode Convolutional Neural Network (CNN) diterapkan untuk deteksi asap dan api. Dari penelitian ini, diketahui bahwa CNN memberikan kinerja yang baik dalam deteksi kebakaran dan asap. Akurasi deteksi tertinggi diperoleh dengan menggunakan 144 data pelatihan, 20.000 iterasi dengan dropout.
Kata kunci: Deteksi asap, deteksi kebakaran, Jaringan Syaraf Konvolusional ABSTRACT
Fire and smoke detection is the first step as early detection of fires. Early detection of fire based on image processing is considered capable of providing effective results. The choice of detection method is an important key. Feature extraction methods based on statistical analysis and dynamic analysis sometimes provide less accurate accuracy in detecting smoke and fire, especially on smoke detection, this is due to the characteristics of transparent and moving smoke objects. In this study, the Convolutional Neural Network (CNN) method was applied for smoke and fire detection. From this study, it is known that CNN provides good performance in fire and smoke detection. The highest detection accuracy is obtained by using 144 training data, 20,000 iterations and dropout is true.
1. INTRODUCTION
Based on Indonesian Directorate of Forest and Land Fire Control Monitoring System, for the last 3 years in June until October, forest fires in Indonesia have increased to 3000 hotspots
(Sipongi, 2018). It is known that in 2016 the highest number of hotspots was in August, 2200 hotspots. In 2017 the number of forest fires decreased, with the most fires being in September with 900 hotspots. The latest data in 2018 the number of hotspots increased by 3000 hotspots in August and resulted in approximately 4600 hectares of forest and land fires. Based on this data, forest fires become a problem that is quite worrying in Indonesia, especially in the long dry season. Besides causing financial losses, forest and land fires also cause severe air pollution.
Early detection of fires and hotspots is an effort to prevent widespread fires. Various ways are done to make a fire detection system including using smoke sensors. The use of smoke sensors as a fire detection is very limited by the area and most can only be used indoors, but for cases of fire in outdoor such as forest fires, the use of sensors will be difficult to apply. In addition, the use of sensors is also very risky damage, that affects the sensor's performance in detecting. To overcome some of these problems smoke detection using image processing was developed as an early fires detection. The advantage of fire detection using image processing is that it can be applied to detection in a wider area of case such as forest fires and not vulnerable to damage because it is not placed near the area to be monitored. Image processing is very helpful in detection systems and is safer for hazardous conditions. Several studies on fire detection use smoke images, among others.
Image-based smoke detection can be performed on still images and video. In (Dileep, et al., 2017) using a video-based detection system that focuses on smoke flow patterns, in this study smoke detection was carried out by extracting features based on spatial temporal energy, characteristics of smoke that tend to be transparent which causes the energy produced to decrease and cause inaccurate detection results. In (Sheng, et al., 2015) smoke detection based on condensed image. Smoke detection capability is based on statistical characteristics such as color and dynamic or characteristics such as smoke movement, the method is sometimes not optimal in detection, this is because there are several objects that will resemble the same characteristics even though it is not. For examples cigarette smoke, exhaust, movement of people etc. In (Turgay, et al., 2007) smoke detection based on images using color models method, this method will detect by recognizing the color pattern of each smoke object pixel, because each pixel and its neighbors will have the same color intensity. In
(Jasmin, et al., 2016) smoke detection on ship. In this study using statistical analysis and dynamic analysis method. Feature extraction method is the main key in the successful detection of smoke and fire as a fire detection system.
In this study applying the Convolutional Neural Network (CNN) method as a smoke and fire detection method. CNN is known to have good performance in detecting objects in image processing, in (Neha, et al., 2018) CNN can distinguish multiple objects from several different categories. CNN also has good capabilities in solving several problems such as visual recognition, speech recognition and natural language processing (Jiuxiang, et al., 2018).
2. METHODOLOGY 2.1 Convolutional Neural Network
One of the most popular deep learning algorithms to be tested by researchers is Convolutional Neural Network (CNN)(Jiuxiang, et al., 2018). Conceptually CNN is similar to multilayer
perceptron (MLP). Every single neuron in MLP has an activation function that will map the input and output weights. MLP will be a deep MLP when there are more than one hidden layer added to a network. CNN is an MLP that has a special structure.
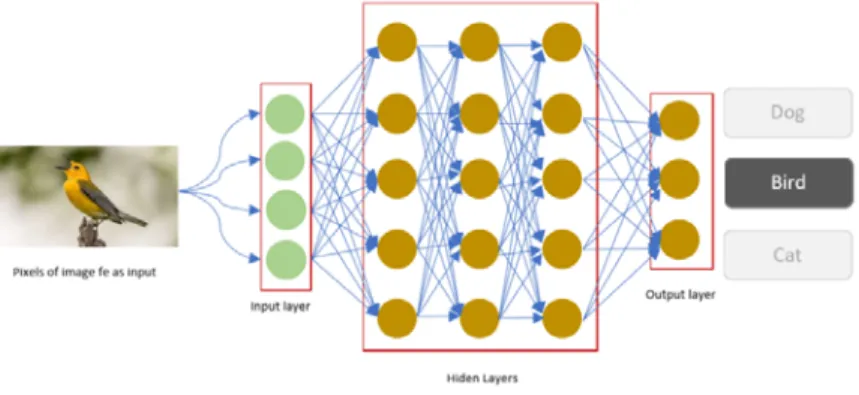
Figure 1. CNN Ilustration
There are 3 basic architectures on CNN namely convolutional layer, pooling layer, and fully-connected layer (Luyang, et al., 2017).
Figure 2. CNN component 2.2 Input Layer
The first layer of each CNN used is ‘input layer’ which takes images. Input layer accepts the pixels of the image as input in the form of arrays.
2.3 Convolutional Layer
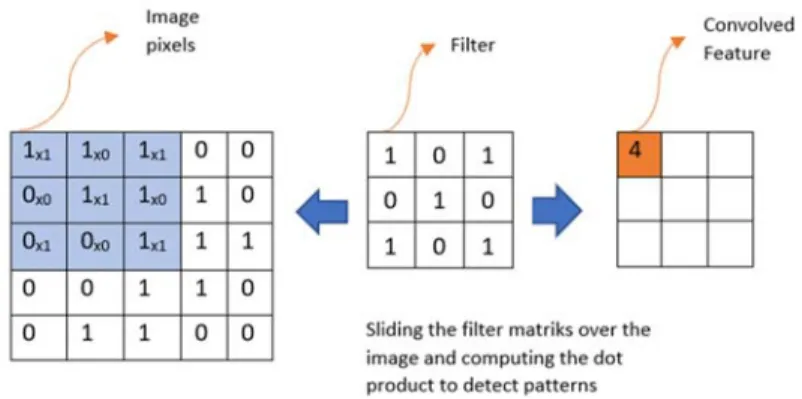
Convolution is the process of combining two different matrices to produce a new matrix value. The two matrices are input and filter while the third matrix is output. In the first matrix input is obtained based on the level of color in each pixel while the second matrix is adjusted by the filter used. Each input will be convoluted with the specified filter value. A filter is another block that has the same height and width and is used to determine what pattern is detected which is then convoluted or multiplied by the input matrix value. Figure 3 shows illustration of convolution.
Figure 3. Ilustration of Convolution Proccess
Basic operations in image processing are convolution operations. Convolution of 2 functions f(x) and g(x) are defined in (1):
ℎ 𝑥 𝑓 𝑥 ∗ 𝑔 𝑥 (1) In this case, the * sign denotes the convolution operator, g(x) is called the convolution kernel or filter kernel. The g(x) kernel is a window that is operated shifting in the input signal f(x), which in this case, the number of multiplications of the two functions at each point is the result of convolution expressed by output h(x). In this study, the number of f(x) matrices used is 300x300, according to the size of the image used. While the g(x) filter used is a 4x4 matrix.
2.4 Rectified Linear Unit Layer
The next step is the ReLU layer, at this stage it is done: perform element wise operation, sets all negative pixels to 0, introduces non-linearity to the network, and the output is a rectified feature map.
2.5 Pooling Layer
Pooling is a down-sampling operation that reduces the dimensinality of the feature map. This layer takes large images and shrink them down while preserving the most important information in them. It keeps the maximum value from each window, it preserves the best fits of each feature within the window. Figure 4 shows ilustration of pooling layer.
2.6 Flattening
Flattening is the process of converting all the resultant 2 dimensional arrays from pooled feature map into s single long continuous linear vector. Figure 5 shows ilustration of flattening.
Figure 5. Ilustration of Flattening 2.7 Fully Connected Layer
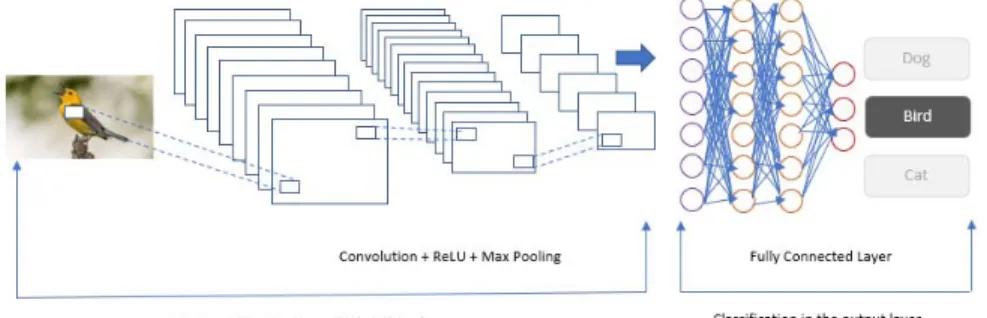
The final layer is the fully connected layers which takes the high-level filtered images and translate them into categories with labels. Figure 6 shows all proccess of CNN.
Figure 6. Ilustration of Fully Connected Layer 2.8 Data
The data used in this study are pictures of smoke and fire. total data is 160 pictures of smoke and fire we have taken randomly from the internet pictures of forest fires in Indonesia. Before entering the training phase, the data that has a different size is resized so that it has a uniform size, it is 300 x 300 pixels. Then the data is divided into two parts, there are training and testing data, Training data is used during CNN learning and testing data is used during testing. The sample data used is shown in figure 7.
The software used in this study is Python-3, Visual Studio 2015, Cuda-9 Nvdia. Visual studio is useful as a program editor, and Cuda functions to run programs using the Graphics Processing Unit (GPU) so that computing capabilities are faster than using the Central Processing Unit (CPU). In this study using a framework from Google, namely TensorFlow, where this framework is widely used for the purposes of deep learning, machine learning, and artificial intelligence.
In this study we modified the CNN model that has been provided, the program code can be downloaded at https://github.com/tensorflow/models. We modified several parts, among others, we increased running time by setting the batch size value, then we also used dropouts to improve the accuracy of CNN.
2.9 Training CNN
CNN training stages are carried out to get the best model which will then be used to recognize smoke and fire patterns. The training process in this study takes about 0.8 - 1.2 seconds per data. The length of training time is affected by the batch size value, larger image resolution enter, the greater batch size value, so that computing will take a large time too. In this study the batch size used is 2.
2.10 Testing
The testing phase is testing the CNN model in detecting new data (data testing), then evaluating whether the model is accurate in detecting.
2.11 Evaluation
To measure the success of CNN in detecting smoke and fire, accuracy is calculated. shown in equation 2.
(2)
3. RESULT AND ANALYSIS
Figure 8 shows the results of smoke and fire detection using the CNN model. It can be seen that CNN detected smoke with a similarity rate of 58% and two hotspots with each similarity level of 72% and 86%. Testing data used is containing fire and smoke objects, at the time of testing it will be seen how the accuracy of the CNN algorithm in detecting fire objects and smoke objects.
3.1 Experiment using A Different Amount of Training Data
At this stage CNN will be trained using different number of training data, 112, 128, and 144 smoke and fire data. Then the resulting CNN model will be tested on 20 testing data. Training with 112 training data
3.1.1 Training with 128 Training Data
Table 1 shows the results of smoke and fire detection using 112 training data.
Table 1. CNN Detection Results using 112 Training Data Test data 1 2 3 4 5 6 7 8 9 10 11 12 13 14 15 16 17 18 19 20 Smoke - Fire - - - - - - - - - Note: : object detected - : Undetected object : Error detection
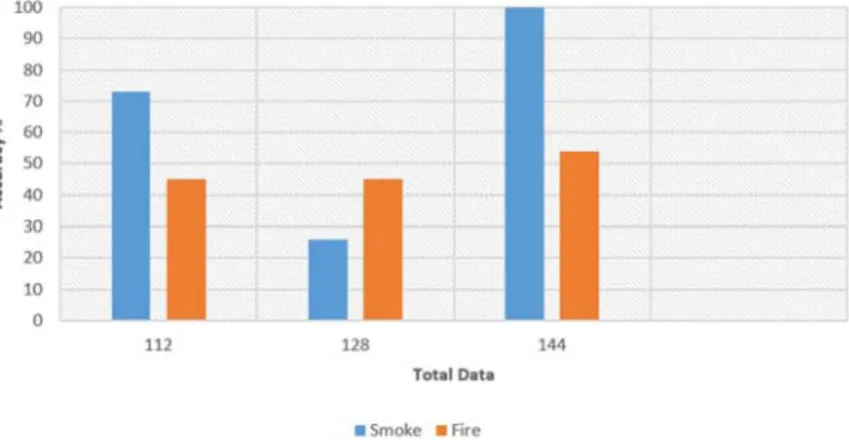
Table 1 showed that objects detected as smoke is 73% and objects detected as fire is 45%. It can be seen from the experiments results that CNN can recognize at least one smoke or fire object in the tested image, there is only one error detection in the 17th data where neither smoke and fire objects are detected at all.
3.1.2 Training with 128 Training Data
Table 2 shows the results of smoke and fire detection using 128 training data.
Table 2. CNN Detection Results using 128 Training Data Test data 1 2 3 4 5 6 7 8 9 10 11 12 13 14 15 16 17 18 19 20 Smoke - Fire - - - - - - - - - Note: : object detected - : Undetected object : Error detection
Table 2 showed that objects detected as smoke is 26% and objects detected as fire is 45%. It can be seen that the decrease in CNN recognition ability in the test data, more than 10 test data were not detected by both smoke objects and fire objects.
3.1.3 Training with 144 Training Data
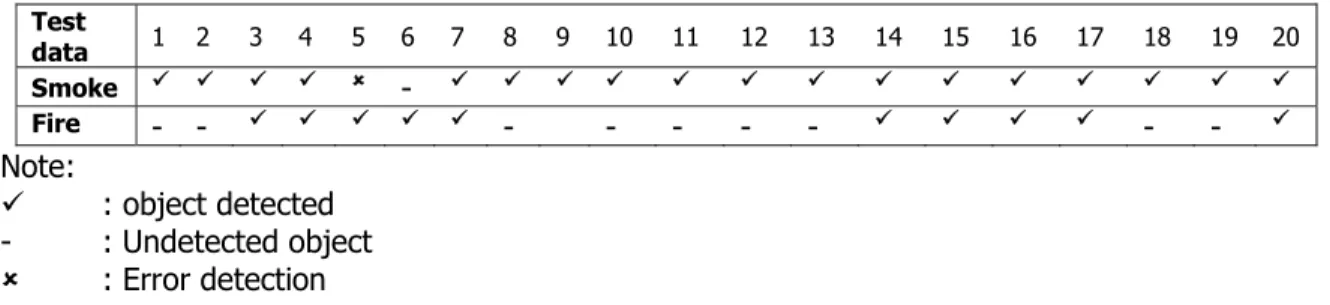
Table 3 shows the results of smoke and fire detection using 144 training data.
Table 3. CNN Detection Results using 144 Training Data
Test
data 1 2 3 4 5 6 7 8 9 10 11 12 13 14 15 16 17 18 19 20 Smoke - Fire - - - - - - - - -
Note:
: object detected - : Undetected object : Error detection
Table 3 showed that objects detected as smoke is 100% and objects detected as fire is 54%. By adding more training data can increase the CNN ability, from the test results it can be seen that the entire data can be recognized, even though in some data only one object can be recognized.
3.1.4 Comparison of Accuracy Gains using Different Training Data
Figure 9 shows a graph of CNN detection accuracy using a number of different training data. From the graph it is known that the more number of training data used, the more accurate the CNN model detects objects of smoke and fire.
Fig 9. CNN Detection Accuracy using A Number of Different Training Data 3.2 Experiment using Different Training Iterations
At this stage CNN will be trained using different iterations of 20,000, 60,000 and 100,000. then the resulting CNN model will be tested on 20 data.
3.2.1 Training with 20,000 Iterations
Table 4 shows the results of smoke and fire detection using training with 20,000 iterations.
Table 4. CNN Detection Results using 20,000 Iterations
Test data 1 2 3 4 5 6 7 8 9 10 11 12 13 14 15 16 17 18 19 20 Smoke - Fire - - - - - - - - - Note: : object detected - : Undetected object : Error detection
In Table 4, the results detected as smoke are 100% while the results detected as smoke are 54%.
3.2.2 Training with 60,000 Iterations
Table 4 shows the results of smoke and fire detection using training with 60,000 iterations.
Table 5. CNN Detection Results using 60,000 Iterations
Test data 1 2 3 4 5 6 7 8 9 10 11 12 13 14 15 16 17 18 19 20 Smoke - Fire - - - - - - - - - Note: : object detected - : Undetected object : Error detection
In Table 5, the results detected as smoke are 84% while the results detected as smoke are 45%.
3.2.3 Training with 100,000 Iterations
Table 6 shows the results of smoke and fire detection using training with 100,000 iterations.
Table 6. CNN Detection Results using 100,000 Iterations
Test data 1 2 3 4 5 6 7 8 9 10 11 12 13 14 15 16 17 18 19 20 Smoke - Fire - - - - - - - - - Note: : object detected - : Undetected object : Error detection
In Table 6, the results detected as smoke are 94% while the results detected as smoke are 72%.
3.2.4 Comparison of Accuracy Gains using Different Number of Iterations
Figure 10 shows a graph of obtaining CNN detection accuracy using different number of iterations. From the graph it is known that the number of 20,000 iterations has the highest accuracy.
3.2.5 Experiment using Dropout
At this stage CNN is trained with 144 training data and uses 20,000 iterations. the difference from the previous test was using a dropout. Dropout is a technique to reduce overfitting in CNN learning algorithms. Table 7 shows the results of smoke and fire detection using dropout.
Table 7. CNN Detection Results using Dropout
Test data 1 2 3 4 5 6 7 8 9 10 11 12 13 14 15 16 17 18 19 20 Smoke - Fire - - - - - - - - - Note: : object detected - : Undetected object : Error detection
Table 7 shows that the object detection results as smoke by 94% and object detection as a fire by 100%. This shows good performance with the addition of dropout variables.
From the whole study shows that CNN can recognize smoke and fire objects properly through several test data, although in some tests CNN can only recognize one object, but this does not become a significant obstacle because at least we need an object to detect forest fires.
4. CONCLUSION
This study used 160 smoke and fire data, smoke and fire images is an input into CNN, then the feature extraction process was carried out by convolutional layer, rectified linear unit layer and pooling layer process. The classification is then performed on the fully connected layer. The next stage is testing new data on the model that has been formed. The test results obtained the best accuracy 94% for smoke detection and 100% for fire detection, using 144 training data, 20 test data, 20,000 iterations and dropout is true.
REFERENCE
Dileep, K. A., Rashedul I., Sheraz, A. K., & Jong, M. K. (2017). A video-based smoke detection using smoke flow pattern and spatial-temporal energy analyses for alarm systems. Inf. Sci. (Ny)., 418–419(32), 91–101.
Jasmin, Ć., Miroslav, B., & Domagoj, K. (2016). Computer Vision Application for Early Stage Smoke Detection on Ships. Maritime & Transportation Science, 52(1), 63–80.
Jiuxiang, G., et al. (2018). Recent advances in convolutional neural networks. Pattern Recognit., 77(5), 354–377.
Luyang, J., Ming, Z., Pin L., & Xiaoqiang, X. (2017). A convolutional neural network based feature learning and fault diagnosis method for the condition monitoring of gearbox. Meas. J. Int. Meas. Confed., 111(18), 1–10.
Image Classification. Procedia Comput. Sci., 132(38), 377–384.
Sipongi. (2018). Data Matrik Titik Panas TERRA/AQUA (LAPAN) ≥ 80%. Retrieved from sipongi.menlhk.go.id.
Sheng, L., Changwei, Y., Kelu, W., & Jiangyu, Z. (2015). Smoke detection based on condensed image. Fire Saf. J., 75(5), 23–35.
Turgay, Ç., Huseyin, Ö., & Hasan, D. (2007). Fire and smoke detection without sensors. 15th European Signal Processing Conference, (pp. 1794–1798).