MARKUS PETERS
Machine Learning Algorithms
for Smart Electricity Markets
Essays on Autonomous Electricity Broker Design,
Probabilistic Preference Modeling, and Competitive
Benchmarking
M A R K U S P E T E R S - M a ch in e L e a rn in g A lg o rit h m s f o r S m a rt E le ct ric it y M a rk e tsERIM PhD Series
Research in Management
E
ra
sm
u
s
R
e
se
a
rc
h
I
n
st
it
u
te
o
f
M
a
n
a
g
e
m
e
n
t
-332 E R IM D e si g n & l a yo u t: B & T O n tw e rp e n a d vi e s ( w w w. b -e n -t .n l) P ri n t: H a ve k a ( w w w. h a ve k a .n l)
MACHINE LEARNING ALGORITHMS FOR SMART ELECTRICITY MARKETS ESSAYS ON AUTONOMOUS ELECTRICITY BROKER DESIGN, PROBABILISTIC PREFERENCE MODELING, AND COMPETITIVE BENCHMARKING
The shift towards sustainable power systems is one of the grand challenges of the twenty-first century. Decentralized production from renewable sources, electric mobility, and related advances are at odds with traditional power systems where central large-scale generation of electricity follows inelastic consumer demand. Smart Markets and intelligent Information Systems (IS) could alleviate these issues by providing new forms of coordina -tion that leverage real-time consump-tion informa-tion and prices to incentivize consumer behaviors that remain within the grid’s operational bounds. But the best design for these systems, and the societal implications of different design choices is largely unclear. This disser tation makes three contributions to the debate. First, we propose and evaluate a design theory for Brokers, a novel class of IS-based intermediaries in retail electricity markets that provide participants with additional information and fine-grained economic incentives. Second, we study in greater detail the Broker’s core problem of learning from past customer choices as basis for future decisions. We propose a probabilistic preference model that addresses important features of electricity markets, and we demonstrate the performance of this model on electricity tariff choice tasks. And third, we propose and study Competitive Benchmarking, a novel research method for effective IS artifact design in complex environments like power systems, where the social cost of failure is prohibitive. Our results provide guidance on IS design choices for sustainable electricity systems, and they contribute to the foundations for new Smart Grid business models.
The Erasmus Research Institute of Management (ERIM) is the Research School (Onder -zoek school) in the field of management of the Erasmus University Rotterdam. The founding participants of ERIM are the Rotterdam School of Management (RSM), and the Erasmus School of Econo mics (ESE). ERIM was founded in 1999 and is officially accre dited by the Royal Netherlands Academy of Arts and Sciences (KNAW). The research under taken by ERIM is focused on the management of the firm in its environment, its intra- and interfirm relations, and its busi ness processes in their interdependent connections.
The objective of ERIM is to carry out first rate research in manage ment, and to offer an ad vanced doctoral pro gramme in Research in Management. Within ERIM, over three hundred senior researchers and PhD candidates are active in the different research pro -grammes. From a variety of acade mic backgrounds and expertises, the ERIM commu nity is united in striving for excellence and working at the fore front of creating new business knowledge.
Erasmus Research Institute of Management - Rotterdam School of Management (RSM) Erasmus School of Economics (ESE) Erasmus University Rotterdam (EUR) P.O. Box 1738, 3000 DR Rotterdam, The Netherlands
Tel. +31 10 408 11 82 Fax +31 10 408 96 40 E-mail [email protected] Internet www.erim.eur.nl
If you have any questions concerning the ceremony feel free to contact either of my ‘paranimfen’: ARIANE WILLEMS +49 151 18450431 [email protected] CHRISTIAN PETERS +49 174 5997282 [email protected] Machine Learning Algorithms for Smart Electricity Markets
Essays on Autonomous Electricity Broker Design, Probabilistic Preference Modeling, and Competitive Benchmarking
by
Markus Peters
Friday, 13 February 2015 at 13:30 hrs
Senaatszaal
Erasmus Universiteit Rotterdam Burgemeester Oudlaan 50 3062 PA Rotterdam After the defense a reception will be held I would be delighted to see you!
MARKUS PETERS
+49 177 3804967 [email protected]
You are most kindly invited to attend the public defense of the dissertation
Invitation
E ra sm u s R e se a rc h I n st it u te o f M a n a g e m e n t - E R IMMachine Learning Algorithms for Smart
Electricity Markets
Essays on autonomous electricity broker design, probabilistic preference modeling, and competitive benchmarking
Machine Learning Algorithms for Smart Electricity Markets
Essays on autonomous electricity broker design, probabilistic preference modeling, and competitive benchmarking
Machine learning algoritmen voor slimme elektriciteitsmarkten
Essays over designs voor autonome elektriciteits brokers, preferentiemodellering, en competitive benchmarking
Thesis
to obtain the degree of Doctor from the Erasmus University Rotterdam
by the command of the rector magnificus Prof.dr. H.A.P. Pols
and in accordance with the decision of the Doctorate Board
The public defense shall be held on Friday 13 February 2015 at 13:30 hours
by Markus Peters born in Neuss, Germany
Other members: Prof.dr.ir. H.W.G.M. van Heck Prof.dr. T.M. Heskes
Dr. M. Saar-Tsechansky
Erasmus Research Institute of Management – ERIM
The joint research institute of the Rotterdam School of Management (RSM) and the Erasmus School of Economics (ESE) at the Erasmus University Rotterdam Internet:http://www.erim.eur.nl
ERIM Electronic Series Portal:http://hdl.handle.net/1765/1
ERIM PhD Series in Research in Management, 332
ERIM reference number: EPS-2014-332-LIS ISBN 978-90-5892-384-4
© 2014, Markus Peters
Design: B&T Ontwerp en advieswww.b-en-t.nl
This publication (cover and interior) is printed by haveka.nl on recycled paper, Revive®. The ink used is produced from renewable resources and alcohol free fountain solution.
Certifications for the paper and the printing production process: Recycle, EU Flower, FSC, ISO 14001. More info:http://www.haveka.nl/greening
All rights reserved. No part of this publication may be reproduced or transmitted in any form or by any means, electronic or mechanical, including photocopying, recording, or by any information storage and retrieval system, without permission in writing from the author.
Foreword
When I started my PhD trajectory in 2011, it was for the joy of contemplating questions that few have thought about before. What I had not expected was the additional joy that comes from exploring the hidden world of those who do science for a living. I have been fortunate to be guided by true experts in my explorations, and I gladly acknowledge their contributions to this dissertation.
I am grateful to my promotor Wolf Ketter for providing the vision upon which this work is built, for his enthusiasm in supervising it, and for becoming a good friend in the process. Wolf has a rare ability to see opportunities where others see risks, and he was among those who dared to believed in a thirty-three year old entering graduate student right from the start. His positive attitude is contagious, and his matchless ability to connect with people has opened doors for this work on more than one occasion. Wolf generates more ideas than a generation of doctoral students could possibly explore, but he also gives his students the liberty and the means to develop his ideas into something that excites them. Thank you!
Maytal Saar-Tsechansky was among those who guided my first ventures into academic research and publishing, and I was delighted about the opportunity to collaborate with her again on the final article of this dissertation. Maytal patiently helped me circumnavigate the pitfalls of scientific writing, and she never ran out of challenging questions to hone our arguments. The reader will find that Chapters 2 and 3 are significantly better for her contri-butions! I am particularly grateful for Maytal’s willingness, without a moment’s hesitation, to travel the long way from Austin to Rotterdam to serve on my doctoral committee.
John Collins co-authored two of the articles in this dissertation (Chapters 2 and 4), and he is one of the leaders of the Power TAC project that provides their greater context. John is an inexhaustible source of smart grid and software engineering knowledge, which he con-tributed to many interesting discussions throughout my time at Erasmus University. Re-markably, his recent retirement from the University of Minnesota has not lessened his zest for action in the least, and he continues to translate his vast experience into Power TAC in-novations whenever he is not converting his home into the most self-sufficient, sustainable
patch of Wisconsin. It has been a pleasure to with work with a scholar of John’s expertise and dedication.
Perry Groot and Tom Heskes guided me through the technically most difficult parts of this work, and they are co-authors of the article in Chapter 3. I am thankful for Perry’s efforts to keep me from despairing over the intricacies of efficient Bayesian inference. On more than one occasion, his uncanny ability to recall the appendix of just the right article has proven indispensable. I appreciate Tom’s feedback on this work, and his willingness to serve on my doctoral committee.
Eric van Heck, Patrick Groenen, and Oliver Kramer have been generous in their will-ingness to serve as members of my doctoral committee. In his capacities as head of the Business Information Management (BIM) group at the Rotterdam School of Management, and as secretary of the inner doctoral committee, Eric has additionally provided me with valuable guidance on positioning this dissertation in the Information Systems landscape.
Alok Gupta kindly provided strategic guidance on the Competitive Benchmarking article in Chapter 4. In many ways, this technically inconspicuous chapter proved the most difficult to write, and I am thankful for his perspectives on it.
Many other colleagues have influenced my thinking about the subjects presented in this dissertation or have indirectly contributed to the presented results. In particular, I would like to thank the members of the Learning Agents Research Group (LARGE), including Micha Kahlen, Yixin Lu, Laurens Rook, Tommi Tervonen, Konstantina Valogianni, Jan van Dalen, and Gertjan van den Burg for interesting presentations and discussions on topics in Machine Learning, Learning Agents, and Decision Analysis.
The empirical work in Chapter 4 would not have been possible without the contributions of numerous Power TAC participants worldwide. In particular, I would like to thank the Power TAC development team at Erasmus University, Govert Buijs, Jeroen Ruigrok van der Werven, and Tijn Witsenburg. In addition to their work on Power TAC, these colleagues have operated the computing infrastructure on which all of the experiments in this dissertation were conducted.
The Department of Technology & Operations Management at the Rotterdam School of Management is a great place to work, and more colleagues are to be commended for this than can possibly be named in a foreword. I would like to extend my thanks to my fellow doctoral students and to the department’s faculty for creating this uniquely positive atmosphere. In particular, I would like to thank Bas Giesbers, Morteza Pourakbar, Konstantina Valogianni, and Christina Wessels for being great roommates and neighbors, and Cheryl Blok-Eiting, Carmen Meesters-Mirasol, and Ingrid Waaijer for their tireless efforts in administering the department’s affairs.
Foreword iii
I am thankful for the comprehensive support I have received from the Erasmus Research Institute of Management (ERIM). Throughout my studies, I benefitted from a unique line of services ranging from course guidance, to conference funding, to grant writing, and to finally publishing this book. I especially appreciate the support of the colleagues who provide these services on a daily basis: Natalija Gersak, Kim Harte, Eliane Haseth, Miho Izuka, Tineke van der Vhee, Marisa van Iperen, and Veerle van Laere.
Finally, I am indebted to my family for their support. To my mom and dad for raising me curious, and for encouraging me to remain so; to Christian for volunteering to be my paranimf; and to Ariane for being my dearest scientist. Thank you!
Markus Peters Rotterdam, August 2014
Contents
Foreword i
Contents v
1 Introduction 1
1.1 Research Question and Main Contributions . . . 3
1.2 Smart Electricity Markets . . . 5
1.2.1 Transmission Systems . . . 6
1.2.2 Distribution Systems . . . 8
1.2.3 Challenges and Opportunities . . . 9
1.3 Machine Learning Algorithms . . . 11
1.3.1 Reinforcement Learning . . . 12
1.3.2 Supervised and Unsupervised Learning . . . 12
1.4 Outline . . . 14
2 Autonomous Decision-Making in Smart Electricity Markets 17 2.1 Introduction . . . 17
2.2 Smart Electricity Market Simulation . . . 19
2.3 RL and Strategies for High-Dimensional State Spaces . . . 26
2.3.1 Reinforcement Learning . . . 28
2.3.2 Function Approximation . . . 29
2.3.3 Feature Selection and Regularization . . . 30
2.4 Learning Strategies . . . 32
2.4.1 SELF . . . 33
2.4.2 Reference Strategies . . . 35
2.5 Experimental Evaluation . . . 36
2.5.2 Feature Selection . . . 38
2.5.3 Market Stability / Guarding against Overfitting . . . 41
2.5.4 Regularization . . . 46
2.5.5 Impact of customer characteristics . . . 46
2.5.6 Summary of Results . . . 50
2.6 Related Work . . . 51
2.7 Conclusions and Future Work . . . 52
3 A Preference Model for Autonomous Decision-Making 55 3.1 Introduction . . . 55
3.2 Background and Related Work . . . 58
3.2.1 Information Systems . . . 58
3.2.2 Computer Science . . . 59
3.2.3 Psychology . . . 60
3.2.4 Marketing and Econometrics . . . 60
3.3 Gaussian Process Trade-off Model (GTM) . . . 60
3.4 Fast Bayesian Inference in GTM . . . 69
3.4.1 Structured Gaussian Processes . . . 70
3.4.2 Learning Trade-off Evaluations . . . 71
3.4.3 Learning User Characteristics . . . 75
3.4.4 Learning Hyperparameters . . . 77
3.5 Empirical Evaluation . . . 78
3.5.1 Datasets and Benchmark Methods . . . 78
3.5.2 Model Scalability and Predictive Accuracy . . . 81
3.5.3 Dimensionality Characteristics . . . 84
3.5.4 Sparse Approximation Quality . . . 85
3.6 Discussion and Conclusions . . . 88
4 Competitive Benchmarking of Electricity Brokers 91 4.1 Introduction . . . 91
4.2 Information Systems Research for Societal Challenges . . . 94
4.3 Competitive Benchmarking . . . 99
4.3.1 Competitive Benchmarking ALIGNMENT . . . 100
4.3.2 Competitive Benchmarking PLATFORM . . . 103
4.3.3 Competitive Benchmarking PROCESS . . . 104
Contents vii
4.4 The Power TAC Case: Competitive Benchmarking for Sustainable Energy
Systems . . . 112
4.4.1 Power TAC ALIGNMENT. . . 112
4.4.2 The Power TAC PLATFORM . . . 114
4.4.3 The Power TAC PROCESS . . . 115
4.4.4 Case Study Evaluation . . . 117
4.4.5 Interim Balance . . . 124 4.5 Discussion . . . 124 4.5.1 Related Work . . . 124 4.5.2 Best Practices . . . 127 4.6 Conclusions . . . 129 5 Conclusions 133 5.1 Summary of Main Findings and Implications . . . 133
5.2 Limitations and Future Research . . . 138
Summary 141
Samenvatting 143
Bibliography 145
Chapter 1
Introduction
“Civilization advances by extending the number of important operations which we can perform without thinking about them.”
Alfred N. Whitehead, as quoted in Friedrich A. von Hayek,The Use of Knowledge in Society
Recent advances in information and communication technologies (ICT) have caused un-precedented changes in how firms and their customers transact business. Surely the most familiar face of these changes is the growing volume of business-to-consumer (B2C) trans-actions conducted electronically. Estimated at $4.2 trillion for the G20 states in 2016, these transactions stand for a growing share of economic activities worldwide. For example, in the United Kingdom more than 12% of GDP will be earned through electronic B2C transactions by 2016 (Dean et al., 2012). Less visible, but arguably more incisive, are similar devel-opments in the business-to-business (B2B) sphere, for which market studies in the United States estimate that it now has more than twice the size of its B2C counterpart (Hoar et al., 2012).
It is hardly surprising to find businesses harnessing straightforward advantages of elec-tronic commerce like lower transaction costs. But at the same time that businesses are using ICT to convert and transform individualbusiness models (Anderson, 2009), a fundamen-tal shift is taking place in how economic activity is coordinatedoverall. In many domains, smart markets – an emerging class of markets based on computational intelligence – are now replacing existing hierarchical forms of coordination (Bichler et al., 2010, Kambil and van Heck, 2002, McCabe et al., 1991).
elec-tricity markets, which have evolved out of a system of regional monopolistic elecelec-tricity providers. In North America1, vertically integrated monopolies dominated the generation, transport, and distribution of electricity until the late 1990s when the Federal Energy Regula-tory Commission (FERC) mandated that every generator was to be given equal grid access. Previously, the network-based electricity business had been perceived and regulated as a natural monopoly in its entirety. But suddenly ICT advances made the separation of trans-mission networks from users feasible, and policymakers were keen on unleashing market forces on the electricity business to the benefit of consumers (Kirschen and Strbac, 2005). Most present-day wholesale electricity markets fall into the smart markets category. For ex-ample, their clearing process usually involves a computational procedure known as security-constrained unit commitment (Stoft, 2002), which ensures that power is produced by the lowest-cost generators while respecting complex technical side-constraints such as genera-tors’ ramping times and system-wide security margins.
But while wholesale electricity markets have revolutionized the coordination of eco-nomic activity between large generators, transmission system operators, and electricity dis-tributors, other parts of the electricity business have remained largely unaffected. For in-stance, most American electricity is still generated in central power plants from fossil (68%) or nuclear (20%) fuels in response to inelastic consumer demand (US Energy Information Administration, 2013a). The average US power plant converts only one third of its primary fuel into usable electricity, while 6% of generated electricity is lost to the aging power lines that connect generators with consumers (US Department of Energy, 2003). Generation from renewable or decentralized sources could alleviate these problems, but they are difficult to integrate when consumers have little information about their electricity usage and few in-centives to invest in smart appliances that adapt to the changing availability of wind and sun. Technologies for mitigating these issues – real-time metering, bidirectional communication, home automation, etc. – are now commercially available. But intelligently coordinating
the intricate interplay between individual behaviors and tight physical constraints remains difficult in complex modern power systems with millions of self-interested participants.
Researchers have consequently advocated the implementation ofsmart retail electricity marketsas a way of providing this coordination (Ketter et al., 2014) based on an information layer (sometimes called “Internet of Energy”) residing on top of the physical infrastructure. Smart markets make use of this information layer, and they leverage ICT innovations to pro-vide consumers with additional information, and to economically incentivize behaviors that 1Below, North American examples will be used to illustrate key issues in power systems. While there are a
number of differences compared to, e.g., European power systems in terms of their physical structure, the structure of their supporting markets, and the strategic agenda that policy makers follow in developing them, these differences are inconsequential to the main argument, except where noted. See Coll-Mayor et al. (2007), for example, for a comparison between the European Union and the United States in this regard.
1.1. Research Question and Main Contributions 3
are aligned with overarching goals such as the integration of renewable sources. A criti-cal part of this vision are retail electricitybrokers2, Information Systems (IS) artifacts that intermediate in the smart markets connecting retail customers with large-scale generators, either autonomously or in support of a human decision-maker. Brokers serve in many of the same capacities as current electricity retailers, but their IS-based nature allows them to provide participants with real-time information and fine-grained economic incentives that are currently unfeasible. For example, brokers could offer electric vehicle owners in certain areas temporarily reduced charging rates in exchange for the option to use their batteries as local buffer against solar production drops when cloud covers are erratic. Through such targeted use of information, brokers encourage more efficient use of existing infrastructures, and they enable behaviorally driven change (Watson et al., 2010).
What is currently still unclear, is how brokers are best designed and evaluated. Here, de-sign refers to both, the dede-sign process (dede-sign as a verb) and the concrete dede-sign that follows from this process (design as a noun). This dissertation aims to contribute to answering this question. In the remainder of the introduction we proceed as follows. Section 1.1 contains the research question and a short summary of the main contributions. Section 1.2 provides an introduction to the electricity domain as background for the following chapters. Section 1.3 similarly introduces Machine Learning, the science of building computer programs that im-prove through experience (Mitchell, 1997), and the key reference discipline in our studies. And Section 1.4 provides an outline of the remainder of the dissertation.
1.1
Research Question and Main Contributions
The goal of this work is to advance the development of IS design theories for brokers, and its main research question is:
How should IS-based brokers for retail electricity markets be designed?
We aim to answer this question through a theory for design and action (IS theory type V; Gre-gor, 2006), and we follow a design science approach (Simon, 1996, Hevner et al., 2004, Gregor and Jones, 2007) to establish it. A theory for design and action is a prescriptive theory that informs the choices of artifact designers. As such, its principal components are constructs (e.g., brokers, markets, customers) and relationships between those constructs 2We use the shorter term brokers instead of retail electricity brokers henceforth. In the power systems literature,
Figure 1.1. Areas of contribution for the three studies that comprise the dissertation
that are prescriptive in nature, backed by causal explanations, and empirically testable. Our contribution is divided into three separate studies (see also Figure 1.1):
Chapter 2 – Broker Design: We propose and evaluate a new design theory for brokers based on ideas from Machine Learning. The unit of analysis in this study is the broker itself, and we derive one particular design theory. Our work improves over existing designs, e.g., (Reddy and Veloso, 2011b) through a more realistic problem setup, and through improved performance in spite of the additional challenges we consider. Chapter 3 – Preference Learning: We study in greater detail the broker’s core problem of
learning from past customer choices as the basis for future decisions. The unit of analysis in this study is the broker itself, and we derive one particular design theory. Specifically, we propose and evaluate a probabilistic model that addresses important peculiarities of preference learning in electricity markets, and we demonstrate the per-formance of this model on electricity tariff choice tasks.
Chapter 4 – Competitive Benchmarking: We propose and study a novel research method for accelerating progress on future broker designs and similar complex IS design tasks where the underlying real-world phenomena evolve rapidly, and where the social cost
1.2. Smart Electricity Markets 5
of failure is high. The unit of analysis in this study is the overall design task, and we use a case study approach to demonstrate the efficacy of Competitive Benchmarking for broker design. Our data furthermore allow us to provide preliminary insights into the societal consequences of deploying competing brokers in retail electricity markets. Scientifically, this work contributes to the implementation of smart markets in energy retail-ing, and to the nascent IS research stream on Energy Informatics (Watson et al., 2010). Its managerial and societal relevance lie in its contributions to the design and evaluation of bro-kers. Brokers incentivize consumers to act within the grid’s operational bounds, and thereby provide “an opportunity to create shared value – that is, a meaningful benefit for society that is also valuable to the business” (Porter and Kramer, 2006). This intelligent form of intermediation is one possible business model for utility companies in future Smart Grids.
1.2
Smart Electricity Markets
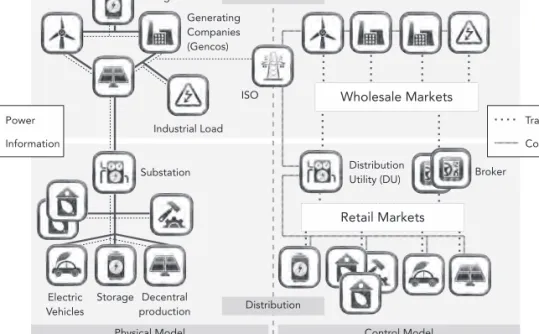
Figure 1.2. Physical and control structure of the electric grid (today). The
top half of the model shows the high-voltage transmission level, the bottom half the low-to-intermediate-voltage distribution level.
To better understand the business environment that brokers operate in, let us consider the structure of current power systems and some associated challenges. The model in Fig-ure 1.2 shows the physical and control structFig-ures resulting from the introduction of
whole-sale electricity markets.3 As is customary in power systems, the model is separated into a transmission systemwhere large-scale generators like coal and nuclear power plants feed high-voltage electricity into a transmission network, and a distribution system responsi-ble for regional electricity provisioning to commercial and residential end-customers. Some large industrial loads capable of operating at high voltage levels (e.g., blast furnaces) may be connected directly to transmission networks, but the bulk of loads in terms of volume and number are served through distribution systems. The two types of system vary widely in the number and sophistication of connected stakeholders, the sensing abilities built into the physical infrastructure, the current level of ICT deployment, and the dominant control paradigm. These differences are further characterized in Table 1.1.
1.2.1
Transmission Systems
Transmission systems are highly evolved in terms of sensory capabilities and ICT deploy-ment. The Independent System Operators (ISO) running these systems and other participants such as large industrial loads and generating companies have significant incentives for in-vesting in state-of-the art sensing, optimization, and decision-support capabilities due to the tremendous costs and benefits behind their capital-intensive businesses (including the cost of outages). A key difference between electricity provisioning and other businesses is the presence of two separate layers of control that participants engage in: economic and physical control.
Economic control at the transmission level is provided through the aforementioned wholesale markets where generating companies sell energy to aggregated distribution-level loads or large industrial users of electricity. Transactions in these markets are tied to a spe-cific delivery time and location, because electricity is currently not stored at scale. Ideally, forward markets would provide allocation ahead of time and spot markets would provide efficient real-time allocation of residual imbalances. But due to ramping and other physical constraints of power plants, generators can only sell their capacity forward, i.e., there is no conventional, competitive spot market for electricity. The upshot of all wholesale market transactions is a tentative schedule of production and consumption that does not yet account for real-time deviations from market participants’ forecasts (e.g., plant and line failures), 3The model is an idealized representation and significant regional differences exist. For example, not all parts
of the United States have introduced competitive wholesale markets, yet. The Independent System Operator (ISO) referenced in the model is a Regional Transmission Operator (RTO) in some parts of the US, and a Transmission System Operator (TSO) in most of Europe. In some markets, independent third parties take over parts of the ISO’s resposibilities, as in the case of Scheduling Coordinators (SC) in California (Cameron and Cramton, 1999). And, at the time of this writing, approximately half of the American states have tentatively introduced competitive elements at the retail level. While these differences are important for understanding concrete power systems and their respective performances, they are inconsequential to our argument.
1.2. Smart Electricity Markets 7
Attribute Transmission System Distribution System
Number of nodes and stakehold-ers Low- Approximately • 102large-scale generators • 103transmission lines • 104substations per system High- Approximately • 5×10⁴distribution feeders • 107customer meters • 5×10⁸appliances per system Stakeholder sophistica-tion
High- Commercial generators use
sophisticated forecasting and mization routines to compute opti-mal bids in wholesale markets; In-dependent System Operators (ISO) use advanced power flow analy-sis tools for operations and contin-gency planning
Low-to-Medium - Distribution
Utilities (DU) use relatively simple
forecasting schemes; Residential
customers make ad-hoc
consump-tion decisions and potentially
sporadic, manual tariff decisions; Commercial customers may exhibit some sophistication in tariff ne-gotiations and use of controllable capacities
Sensing ability
Medium-to-High - Mature
com-mercial sensing devices are avail-able and widely deployed; increas-ing deployment of Phasor Measure-ment Units (PMU) for wide-area monitoring
Low-to-Medium - Commercial
customer on-site sensing devices
available but questions remain
with respect to standards, optimal level of functionality, etc.; DUs are gradually installing feeder sensors ICT
deploy-ment
High- ISOs use sophisticated
En-ergy Management Systems (EMS), Supervisory Control and Data Ac-quisition (SCADA) systems, and Phasor Data Concentrators (PDCs)
Low-to-Medium - Customer-site
deployment efforts are still tenta-tive; uncertainty with respect to standards, regulatory framework, required functionality, and busi-ness cases; DUs use Distribution Management Systems (DMS) but proprietary technology makes them difficult to extend to new applica-tions
Control paradigm
Market-based / Direct -
Long-term matching of supply and de-mand, as well as ancillary services such as regulation, load-following, and various types of reserves; Real-time operation starts from previous market transaction, applies direct control to handle real-time devia-tions and contingencies
Direct - Predominantly passive
management to match supply to de-mand; some use of direct control for load shedding
Table 1.1.Summary of current transmission and distribution system
charac-teristics. Numeric examples for a typical U.S. system are taken from (Wider-gren et al., 2004)
physical network constraints, and some system-level considerations, such as reliability re-serves or contingency planning.
Based on the preliminary wholesale market allocation, the ISO manages the real-time operation of the grid (for which markets are too slow) including all remaining system-level considerations (for which markets do not account) throughphysical control. Physical con-trol is a highly involved, distributed process executing on multiple timescales that aims to optimize economic performance and power quality under physical constraints.4Parts of this process are, in turn, based on market mechanisms. For example, the ISO’s acquisition of reserves from generators is mediated through wholesale markets.
1.2.2
Distribution Systems
Distribution systems are comparatively less evolved due to to their smaller volumes of en-ergy supplied over wider areas, and due to the large number of unsophisticated participants connected to them. While equipment for real-time customer metering, and for sensing and automatically controlling distribution feeders is commercially available, incentives to invest in it remain low in many parts of the world. Residential and commercial customers have historically enjoyed an anytime supply of electricity and are wary of paying for new meter-ing equipment that will take years to amortize, and that has the potential to complicate their lives. Distribution Utilities (DU), the monopolistic retailers and operators of distribution net-works, are subject to strict economic regulation of their offerings and have little incentives for inducing behavioral changes among their customers, or to improve their service quality beyond mandated levels.
Consequently, most distribution networks follow a hierarchical control approach where customers subscribe to fixed or simple time-of-use tariffs, make consumption decisions in-dependently of the availability of electricity, and receive monthly bills based on sporadic meter readings. Little use is made of economic control through retail markets, and physical control is at most exercised over larger commercial customers who allow the DU to remotely control parts of their loads (curtailment). The DU forecasts the aggregate consumption of its customers based on historical data and procures offsetting generation commitments in the wholesale markets. These markets then invoke the right number of generators through security-constrained unit commitment.
While this simple approach to distribution system operation has worked well for decades, it has lately been criticized for several reasons. First, shielding customers from true electric-4Sub-activities include security-constrained economic dispatch, unit commitment, allocation and invocation of
several types of reserves, governor control, voltage control, automatic generation control (AGC), and controlled load reduction (load shedding). See Kirschen and Strbac (2005) for further details.
1.2. Smart Electricity Markets 9
ity prices leads toinefficient allocations(Watson et al., 2012). For example, customers have no incentives to shift their non-time-critical capacities to periods of high production from re-newable sources (demand response). Second, capacity planning within the grid is based on peak demand, with the consequence that 10% to 18% of American power systems’ capacity is currently utilized less than 1% of the time. Suchunder-utilized capacityis both environ-mentally harmful (e.g., excess line corridors) and costly (Kassakian and Schmalensee, 2011). Responsive customer demand has the potential to reduce peak demand by up to 20% until the end of the decade (Department of Energy, 2012). And third, unresponsive demand in combination with competitive wholesale markets leads to opportunities for exercising mar-ket poweron the side of highly reactive marginal generators. It is therefore important that at least some customers can react to electricity scarcity in real time to avoid market failures like the California energy crisis (Borenstein, 2002, Cramton, 2003).
1.2.3
Challenges and Opportunities
From an IS vantage point, the differences between transmission and distribution systems are unsurprising. Transmission networks with their comparatively small number of sophisticated participants and extensive real-time sensory and control capabilities are naturally amenable to central optimization and dispatch. The methods required to perform such optimizations are highly involved, to be sure. But the problem of transmission systems operations is es-sentially one of optimizing power flows among a small number of strategizing participants under physical side-constraints and it remains well within the realm of central optimization. In distribution systems, on the other hand, central optimization is impeded by a number of practical and conceptual issues:
• The DU as system operator has virtually no information about the dynamic electricity consumption of individual grid participants. Currently available data include sporadic meter readings and aggregate loads on distribution feeders, but the granularity of those data is insufficient for real-time control schemes. Much less than real-timevisibility
do distribution systems provide real-timecontrollabilityof customer capacities. Some commercial customers may have load curtailment arrangements in place, but this level of control remains elusive for the majority of electricity customers without dedicated data connections and smart appliances.
• Customers have few incentives to adapt their behavior. While it seems unlikely that customers would be willing to monitor, for example, electricity prices in real time, there is significant untapped potential for smart appliances that optimize their
electric-Figure 1.3.Physical and Control Structure of the Electric Grid (Smart Grid)
ity usage profile while respecting their users’ preferences.5
• Even if more granular datawasavailable, a centralized control scheme would likely not scale to the point of making optimal decisions involving tens of millions of cus-tomers and hundreds of millions of appliances in real time.
Alleviation for these issues could come in the form ofSmart Grids(see Figure 1.3), with among other features (Massoud Amin and Wollenberg, 2005):
Sensing and Control Capabilities at the network level and among customers through the large-scale deployment of advanced metering capabilities.
Renewables and Decentralized Generation which could reduce the environmental impact of electricity production.
Electricity Storage which can increase asset utilization, match the non-dispatchable power flows from renewable sources with demand, and enable new grid topologies like Smart Energy Neighborhoods (Ibrahim et al., 2008, Sioshansi et al., 2009).
5A 2010 market research report by a commercial consulting firm concludes that “the U.S. smart appliance
market will expand from $1.42 billion in 2011 to $5.46 billion in 2015, representing a nearly 40 percent growth rate. Clothes washers and dryers are expected to make up 36 percent of the market while refrigerators and freezers are forecast to comprise 24 percent of the market. Further, Whirlpool expects to make all appliances smart grid capable by 2015.” (EPRI - Electric Power Research Institute, 2011)
1.2. Smart Electricity Markets 11
Retail Competition which provides the institutional foundation for new approaches to dis-tribution system control. Retail competition decouples economic control (through tariffs or forward contracts between independent retailers and customers) from the real-time operation of the distribution grid, and it provides retailers with incentives for offering customers competitive, innovative electricity services.
These Smart Grid features can facilitate a market-based alternative to current distribution system control schemes by increasing visibility and controllability. For example, real-time sensing capabilities in feeders and households could be used for allocating infrastructure costs based on peakusage (the true cost driver), notoverallusage (the information that is currently available). Decentralized generation could satisfy electricity demand with small ramping times and without the need for costly long-range transmission. And electricity storage in batteries or electric vehicles could provide highly responsive ancillary services that otherwise require the idle operation of large generators.
If there was no mention of transmission system innovations in the previous paragraph, it is because the greatest remaining opportunities for smart markets lie at the distribution level. Transmission systems hold a great number of important challenges, to be sure,6but the
no-tion of making systems smarter to make them better is inherently limited at the transmission level (Joskow, 2012). Transmission systems are a balancing mechanism of last resort, and coordination should be established locally before delegating it to the transmission level. Sig-nificant smartness and flexibility must therefore reside at the edges of the grid. This insight is mirrored by industry estimates that 70% of required Smart Grid investments will accrue at the distribution level (EPRI - Electric Power Research Institute, 2011). High-impact oppor-tunities for smart retail electricity markets also arise from the closeness between distribution systems and customers. Given the relative ease of influencing a customer appliance com-pared to building new power plants, more effective use should be made of the human factor instead of treating it as a disturbance term, as is current practice in power systems engineer-ing (Palensky and Dietrich, 2011).
6The 2003 Northeast Blackout, for example, was at least partially caused by a lack of human and
techni-cal communication between neighboring systems operators (Fox-Penner, 2005, Joskow, 2012). How precisely transmission-level Energy Management Systems (EMS) should be designed to optimally support users in compli-cated, real-time decision-making tasks therefore is an important question worthy of scientific study. Furthermore, “the impact of ... ICT systems on controllability and observability [of the Smart Transmission Grid] is poorly un-derstood ... [and] the exact relationship between critical ICT components and the power system needs improved methods for analysis.” (Vanfretti et al., 2011)
1.3
Machine Learning Algorithms
A question that immediately follows from the preceding discussion is how the increased vis-ibility and controllability afforded by Smart Grids can be turned into practical, new control mechanisms. The scale and complexity of electric grids cast doubts on the prospects for manual control, but IS-based mechanisms are equally unlikely to be effective if built from a limited set of fixed, predefined rules cast into computer algorithms. While it might be possible to formulategoalsfor the behavior of such algorithms, it is entirely unclear which of the myriad possible actions (sensing, changing prices, acquiring small-scale generation capacities, etc.) should be effected at what time toachievethose goals.
A promising alternative to predefining behaviors is the use ofMachine Learning, a collection of techniques for the “[construction of] computer programs that automatically im-prove with experience.” (Mitchell, 1997) By observing activities in their environment, often labeled as more or less desirable, these techniques learn to recognize and react to regularities without an explicit set of rules fixed at design time. Machine learning techniques have been applied successfully in complex, dynamic settings ranging from autonomous game-playing to self-driving cars (Kober et al., 2013).
A comprehensive introduction to Machine Learning is beyond the scope of this introduc-tion. Instead, we give an outline of the major task categories, and refer the reader to Bishop (2006) and Murphy (2012) for further details.
1.3.1
Reinforcement Learning
Reinforcement Learning(RL) deals with control tasks where the goal is to maximize long-term rewards by repeatedly taking actions in a stochastic environment (Sutton and Barto, 1998). A Reinforcement Learning algorithm observes the state of the environment, chooses an action, and is subsequently rewarded or penalized. Then the environment progresses to the next state and the process repeats itself. In general, both the rewards and the state transitions made by the system can be stochastic, which means the algorithm has to learn about them. In particular, reward maximization could entail foregoing immediate rewards to instead explore the environment and to obtain higher rewards in the future.
Our main research question asks for a design theory for brokers in an environment with stochastic reactions from customers and other wholesale market participants. In Chapter 2, we will show how the RL framework can be applied to this challenge.
1.3. Machine Learning Algorithms 13
1.3.2
Supervised and Unsupervised Learning
InSupervised Learning, pairs of dataD={(xi,yi)},i=1,...,Nare given, where thexiare
the values of one or more input variables, and theyiare the values of an associated output
variable. Often, thexiare real-valued feature vectors and theyi are categorical
(classifica-tion) or continuous (regression). But in general, bothxiandyican be vectors or more richly
structured objects. The goal in supervised learning is to discover the mapping between thexi
and theyiso that the outputs for previously unobserved inputs{xnew}can be predicted
accu-rately.Unsupervised Learningdiffers from supervised learning in that only unlabeled data
D={xi}are given, and the goal is to characterize these data, or to find patterns of interest in
them. It is therefore also referred to aspattern recognitionorknowledge discovery(Webb, 2003, Bishop, 2006).
While little use is made of unsupervised learning in this dissertation, Chapter 3 presents a novel method for learning customer preferences in a supervised fashion. In the study, a learner observes customer choices and generalizes from these observations to improve future decisions involving customer preferences.
1.4
Outline
We now describe the setup we use to answer the main research question “How should IS-based brokers for retail electricity markets be designed?” (see also Figure 1.1)
Chapter 2 – Broker Design7
Our first step is to develop and evaluate a high-level design for brokers in retail electric-ity environments. An important insight from autonomous systems design is that endowing brokers with all possible successful behaviors at design time is futile, because these be-haviors are impossible to enumerate and will quickly become obsolete. Instead, we aim to design brokers thatlearneffective behaviors by observing their environment, taking actions, monitoring the long-run consequences that these actions entail, and updating their behavior accordingly. This is essentially a problem in optimal control, and Reinforcement Learning (RL, see Section 1.3.1) offers a suitable framework for addressing it.
In retail electricity markets, brokers publish electricity tariffs to customers, who sub-scribe to them based on latent preferences. Different tariff terms incentivize different kinds of customer behaviors, and the resulting consumption and production add up to a portfo-lio of obligations that the broker seeks to cover by trading in the wholesale market. Both markets are competitive, and any net imbalances remaining after these trades are handled by the operator of the distribution grid, the Distribution Utility, at typically higher costs to the broker.
While RL has previously been used to learn electricity wholesale trading strategies (Nan-duri and Das, 2007, Ramavajjala and Elkan, 2012), retail electricity trading has received considerably less attention. Reddy and Veloso (2011b) were the first to note that RL offers an appropriate broker design framework. The design we propose and evaluate in Chapter 2 improves over their work in that it requires significantly less manual tuning, better accom-modates the rich data available in smart market environments, and better incorporates new types of information as market conditions change. We identify the most effective design con-ditional on prevailing market conditions. Because of the high dimensionality of a broker’s observations, we show how feature selection and regularization techniques can be leveraged for better performance under these conditions.
Our simulation-based evaluations of these designs use SEMS, a data-driven Smart Elec-tricity Market Simulation, developed specifically for this study. SEMS is built on data from 7This work was published as: Markus Peters, Wolfgang Ketter, Maytal Saar-Tsechansky, and John E. Collins, A
reinforcement learning approach to autonomous decision-making in smart electricity markets.Machine Learning, 92:539, 2013. Preliminary versions of this work appeared in, or were presented at: Peters (2012), Peters et al. (2012a,b,c,d).
1.4. Outline 15
the Ontario wholesale market, a complete micro-level model of appliance usage in private households (Gottwalt et al., 2011), and several benchmark designs for brokers proposed in the literature (Reddy and Veloso, 2011b).
Chapter 3 – Preference Learning8
A particular challenge for brokers are the idiosyncratic preferences (Lichtenstein and Slovic, 2006) of their (prospective) customers. To incentivize favorable behaviors, brokers must be capable of reasoning about customer responses to changes in tariff terms. But the prior experiences they can draw from to this end are limited, because each current customer makes only few choices, even though the sum of choices observed across all customers is large. Furthermore, the observed choices are usually subject to behavioral inconsistencies, such as inertia.
A broker must respect these inconsistencies, because the uncertainty arising from them is a crucial ingredient for autonomous decision-making: brokers should only make high-value decisions autonomously if past evidence suggests that they will be correct with high probability, and prompt their users for additional information otherwise. However, brokers cannot demand their human operators’ attention too frequently and a preference model must therefore begin to make accurate predictions from limited training data.
To address these requirements, we propose a Bayesian preference model based on Gaus-sian processes (Rasmussen and Williams, 2006) in Chapter 3 that learns from limited data by pooling the data of similar users. Our model quantifies the certainty of its predictions as input to the broker’s autonomous decision-making task, and it infers probabilistic user segments based on observed choices in the process. Probabilistic inference in nonparametric Bayesian models is often computationally expensive, but by combining properties of the bro-ker’s task with advances in sparse (Quinonero-Candela et al., 2007) and structured (Saatci, 2011) Gaussian processes we are able to reduce the costs of inference substantially. We eval-uate our model on several real-world choice datasets used in an earlier study (Houlsby et al., 2012), and on electricity tariff choice data that we collected specifically for the purposes of this study on a commercial crowdsourcing platform.
8This work has been submitted for publication as: Markus Peters, Perry Groot, Wolfgang Ketter, Maytal
Saar-Tsechansky, Tom Heskes: A Scalable Preference Model for Autonomous Decision-Making Involving Consumer Choices. Preliminary versions of this work appeared in, or were presented at: Peters and Ketter (2012, 2013a,b,c, 2014).
Chapter 4 – Competitive Benchmarking9
In the last study, we shift our focus fromone particularbroker design to a method for accel-erating the overall progress on broker design theories made by a community of competing researchers. With this study we aim to address the growing concern that challenges like sustainable electricity provisioning progress quicker than researchers’ ability to counteract them (Hey et al., 2009). Design science studies like the first two studies of this dissertation are well-suited for initially identifying and studying promising designs, but their homoge-neous setup limits their ability to quickly detect promising alternatives and possible social negatives. Agent-Based Modeling (ABM; Axelrod, 2006) and Agent-Based Computational Economics (ACE; Tesfatsion 2006) have previously been used to shed light on social nega-tives, but real-world brokers will inevitably evolve under competitive pressure, and neither of these methods account for this competitive co-evolution.
We propose to address this limitation through Competitive Benchmarking (CB), a novel method for IS artifact design in high-complexity environments. CB is rooted in the com-petitive research approach pioneered by the Trading Agents community (Ketter and Syme-onidis, 2012) which challenges researchers to devise software agents for complex, uncertain environments like supply chains (Arunachalam and Sadeh, 2005) and advertisement auc-tions (Jordan and Wellman, 2010).
The first instantiation of CB as we define it here is the Power Trading Agent Competi-tion (Power TAC, Ketter et al. 2014), in which more than a dozen research groups from four different continents now jointly devise, benchmark, and improve broker designs. The Power TAC platform models a competitive retail power market in a medium-sized city, in which consumers and small-scale producers may choose from among a set of alternative electric-ity providers, represented by competing brokers. These brokers are built by individual re-search groups with expertise in Artificial Intelligence, Electrical Engineering, Information Systems, Machine Learning, and other areas, and their heterogeneous design approaches have contributed to a rich repository of design ideas and executable broker artifacts.
Cornerstones of Power TAC’s CB process are annual championships, and pilots that provide additional informal benchmarking opportunities. To date, pilots have been held at IJCAI 2011 in Barcelona, at AAMAS 2012 in Valencia, and at IEEE SG-TEP 2012 in Nuremberg. The first two official Power TAC championship were held at AAAI 2013 in Bellevue, WA, and at AAMAS 2014 in Paris.10 Using fine-grained records of the Power 9This work has been submitted for publication as: Wolfgang Ketter, Markus Peters, John E. Collins, Alok Gupta,
Competitive Benchmarking: An Information Systems Research Method for Societal Challenges. A related research note is under review as: Wolfgang Ketter, Markus Peters, John E. Collins, Alok Gupta, Power TAC: Competitive IS Research on Sustainable Electricity Systems. Preliminary versions of this work appeared in, or were presented at: Ketter et al. (2013c), Peters et al. (2013a,b).
1.4. Outline 17
TAC community’s results, we quantify performance differences between alternative broker designs, and between subsequent iterations of the same designs to give preliminary empirical evidence of CB’s efficacy as a research method.
Chapter 5 – Conclusions
The final chapter of this dissertation concludes with a discussion of the impact and limita-tions of the three studies, and with direclimita-tions for future work.
Conference on Autonomous Agents and Multiagent Systems; IJCAI = International Joint Conference on Artificial Intelligence; SG-TEP = IEEE Conference on Smart Grid Technology, Economics, and Policies.
Chapter 2
A Reinforcement Learning
Approach to Autonomous
Decision-Making in Smart
Electricity Markets
2.1
Introduction
Liberalization efforts in electricity markets and the advent of decentralized power generation technologies are challenging the traditional ways of producing, distributing, and consuming electricity. The Smart Grid “aims to address these challenges by intelligently integrating the actions of all users connected to it . . . to efficiently deliver sustainable, economic and secure electricity supplies” (ETPSG, 2010). This ambitious vision requires substantial advances in intelligent decentralized control mechanisms that increase economic efficiency, while keep-ing the physical properties of the network within tight permissible bounds (Werbos, 2009).
A fundamental objective of the Smart Grid is to maintain a tight balance of supply and de-mand in real-time. Presently, the task of balancing the output of large-scale power plants with customer demand is handled via centralized control mechanisms. The increasing penetration of small-scale production from renewable sources like solar and wind, however, introduces inherently intermittent, variable, and geographically dispersed supply, and renders real-time balancing significantly more challenging. In addition, proposals for Demand-side Manage-ment (DSM) and for tariffs with time-of-use or dynamic pricing complicate the prediction of
consumption patterns. Existing centralized control mechanisms are unable to accommodate this combination of intermittent and variable supply, a grid of staggering scale including vast numbers of small-scale producers, and dynamic changes in demand in response to price variations.
A promising approach to effective balancing in the Smart Grid is the introduction of electricity brokers(Ketter et al., 2012b), intermediaries between retail customers and large-scale producers of electricity. Brokers offer a distributed alternative to the centralized sys-tem of today’s grid, facilitate localized markets that reduce inefficiencies from wide-area transmission, and attain socially desirable market outcomes in response to appropriate eco-nomic incentives. Because brokers serve as intermediaries, they must also trade in multiple interrelated (e.g., retail and wholesale) markets simultaneously – a structure that Bichler et al. (2010) refer to asSmart Markets. Smart Markets constitute a novel class of complex, fast-paced, data-intensive markets, in which participants ought to employ (semi-)autonomous trading agents in order to attain good trading results.
It is imperative that the design of an electricity broker agent can adapt to a wide vari-ety of market structures and conditions. This is because there is considerable variability in the structure that a future Smart Electricity Market might have, and also because such flex-ibility is generally beneficial for high performance in dynamic environments. We present several important innovations beyond the class of autonomous electricity brokers for retail electricity trading that we presented in (Peters et al., 2012a). Our brokers can accommodate arbitrary economic signals from their environments, and they learn efficiently over the large state spaces resulting from these signals. Existing approaches (Reddy and Veloso, 2011a,b) are limited in the state space size they can accommodate, and are thus constrained in terms of the economic environments they can be deployed into. These works have also not con-sidered customers’ variable daily load profiles (instead, assuming fixed consumption), or the broker’s wholesale trading – both core challenges for real-world electricity brokers. Our design alleviates these limitations.
The research we report here extends our previous work (Peters et al., 2012a) by explor-ing alternatives for the data-driven identification of particularly informative signals from the broker’s data-rich Smart Electricity Market environment. We explore the role that feature selection and regularization techniques play in the broker’s adaptation process. Specifically, we explore the benefits of two different feature selection procedures based on Genetic Al-gorithms and greedy forward selection, and compare them to L1-regularized online learning techniques over the full state space. We find that the inexpensive regularization approach yields satisfactory results under some market conditions; however, the more extensive fea-ture selection techniques can be highly effective across different market regimes (Ketter
2.2. Smart Electricity Market Simulation 21
et al., 2012a) if adequate precautions are taken against environmental overfitting. Based on our empirical results, in this paper we also provide guidance on how such overfitting can be alleviated, as well as discuss approaches which are specialized to the Smart Grid challenge we study here. Our empirical evaluations are based on real-world electricity market data from the Ontario Wholesale Market and a revised model of individual customers’ consump-tion decisions. The customer model we employ captures intra-day variability in demand and has been shown to yield realistic aggregate load curves, rendering our empirical results sig-nificantly more meaningful as compared to earlier studies, including our own work (Peters et al., 2012a). Our empirical results demonstrate that our broker design is highly effective and that it consistently outperforms prior approaches despite the additional challenges we consider.
More generally, research on autonomous electricity brokers for the Smart Grid consti-tutes a nascent, emerging field, in which most of the challenges are largely unexplored. Improving our understanding of methods that address these challenges has far-reaching im-plications to society at large. For example, our broker design contributes to current research on economic mechanism design for the Smart Grid by providing effective strategies against which such mechanisms can be validated, e.g. (de Weerdt et al., 2011). Our extensive evalu-ation of feature selection techniques raises new and interesting questions about connections between overfitting and market stability in the presence of autonomous trading strategies. We also offer an example of how Machine Learning research can inform important develop-ments in the future Smart Grid in Section 2.5.5. In addition to the development of a novel broker agent design, important objectives of this paper are to contribute to our understanding of key design decisions that enable broker agents to operate effectively in the Smart Grid, and to inform future work of challenges and promising research directions.
The paper is organized as follows. In Section 2.2 we give an overview of our Smart Electricity Market Simulation (SEMS). Section 2.3 describes foundations in Reinforcement Learning, feature selection, and regularization that our approach builds on. Section 2.4 intro-duces SELF, our class of Smart Electricity Market Learners with Function Approximation. A thorough empirical evaluation of our learners in comparison to strategies proposed in the literature follows in Section 2.5. In Section 2.6 we review relevant literature. Finally, we conclude with directions for future research.
2.2
Smart Electricity Market Simulation
Smart Electricity Markets aim to intelligently integrate the actions of customers, generating companies, and the Distribution Utility, cf. Figure 2.1. We developed SEMS, a data-driven
Figure 2.1.Smart Electricity Market structure
SmartElectricityMarketSimulation, based on wholesale prices from a real-world electricity market1and a complete, micro-level model of appliance usage in private households. An important property of our simulation, with implications for the broker we design to operate in this environment, is to relax the assumption in previous work that consumers exhibit fixed demand (Reddy and Veloso, 2011a,b). Fixed demand simplifies the broker’s task, however the resultant brokers may not offer an adequate response to the realities of electricity markets. In particular, a key challenge for real-world brokers is to effectively deal withpatternsin consumer demand. This is important for effective grid balancing, as some patterns, such as high consumption during midday peak-hours, are significantly more costly for the broker to offset in the wholesale market (cf. Figure 2.2).
Below we outline the key elements of a Smart Grid, along with the models that represent them in our simulation.
• Customers C={Cj}are small-to-medium-size consumers or producers of
electric-ity, such as private households and small firms. EachCj denotes a group of one or
more customers with similar characteristics and a joint, aggregate consumption pro-file. Customers buy and sell electricity through thetariff market, where they subscribe to standardized tariff offerings, including fixed-rate, time-of-use (ToU), and variable-rate tariffs. We describe our customer model in more detail below. Presently, only a small proportion of electricity is produced decentrally, and central production will 1For this study we used data from Ontario’s Independent System Operator,http://www.ieso.ca, which has
2.2. Smart Electricity Market Simulation 23
continue to play a significant role in the near future. As a liberal upper bound consider that, of the 592 TWh of electricity produced in Germany in 2009, merely 75 TWh were produced decentrally under the country’s Renewable Energy Act (12.6%) (Euro-stat, 2011). Accordingly, the customers in our model act exclusively as consumers of electricity.
• Generating Companies(GenCos) are large-scale producers of energy, such as oper-ators of fossil-fueled power plants and wind parks. GenCos are wholesalers of elec-tricity production commitments. Because changes in power plant production levels have significant lead times, wholesale electricity is tradedforwardfrom several hours to several months in advance.
• TheDistribution Utility (DU) is responsible for operating the electric grid in real-time. In particular, the DU manages imbalances between the total energy consumption and the total outstanding production commitments at any given time. To this end, the DU provides or absorbs energy on short notice and charges the responsible broker imbalance penalties. In SEMS, the DU charges balancing fees that are roughly twice as high as the long-term average cost of electricity in the wholesale market, and thus provides brokers a strong incentive to build easily predictable portfolios of subscribers. • Electricity Brokers B={Bi}are profit-seeking intermediaries, trading for their own
account.2 Brokers are retailers of electricity in the tariff market, and they offset the net consumption of their tariff subscribers by acquiring production commitments in either the tariff (small-scale producers) or wholesale market (GenCos). Theportfolio of contractual arrangements that brokers obtain in this way is executed in real-time by the DU. Brokers aim to compile a portfolio of high-volume, high-margin tariff subscriptions with predictable consumption patterns, that can be offset with production commitments at a low cost. In SEMS, brokers publish one fixed-rate tariff at any given time. This design reflects the fact that fixed rates are currently still the dominant tariff model, mainly due to the absence of advanced metering capabilities among electricity customers. We are interested in the performance of methods for autonomousretail electricity trading. To this end, we endow both, our own strategies and our benchmark strategies, with a fixed wholesale trading algorithm based on Neural Network load forecasting, and brokers learn to develop a profitable retail trading strategy against this backdrop. Our choice of Neural Networks is mainly due to their good out-of-the-box performance in timeseries forecasting tasks. Alternatives, e.g. based on ARIMA 2Electricity Brokers are sometimes also referred to asLoad Serving Entities(LSEs) orAggregatorsin the
models (Conejo et al., 2005), exist but we do not consider them further as they would impact the performance of all examined strategies in the same way.
TheSEMS Simulation Environmentis responsible for coordinating brokers, customers, and the DU. It manages the tariff market, and provides a wholesale market based on actual market data from Ontario’s Independent System Operator. The wholesale market in SEMS determines prices by randomly selecting a window of sufficient size for the simulation run from almost ten years of real-world wholesale market pricing data. Figure 2.2 shows the long-term daily price distribution as well as daily price curves for 10 randomly selected days from that dataset. Once these prices have been determined, broker orders have no impact on them. Modeling brokers as price-takers is reflective of liberalized retail electricity markets, where an increasing number of small brokers compete against each other. For 2008, for example, the European Commission reported close to 940 non-main electricity retailers in Germany that shared 50% of the German market (Eurostat, 2011).
1 2 3 4 5 6 7 8 9 10 11 12 13 14 15 16 17 18 19 20 21 22 23 24 0
50 100 150
Hour of the Day
Price [Money per MWh]
(a) 1 2 3 4 5 6 7 8 9 10 11 12 13 14 15 16 17 18 19 20 21 22 23 24 0 5 10 15
Hour of the Day
Price [Money per MWh]
(b)
Figure 2.2. (a) Price distribution (mean±one standard deviation) for 10
years of price data from the Ontario wholesale market; (b) Price curves for 10 randomly selected sample days
A SEMS simulation runs overN timeslots 1,...,n,...,N which are structured as de-scribed in Figure 2.3.
2.2. Smart Electricity Market Simulation 25
Figure 2.3.Sequence diagram for one simulation timeslot
wholesale pricesW1,...,Wn−1, the tariffs offered by all brokers at the end of the last
timeslotTn−1={τB1,...,τB|B|}, and its current cash account balance. 3
2. Each broker indicates the volume of energy ˆVc
n that it wishes to procure in the current
timeslot. Note, that the broker has no previous knowledge of its customers’ actual con-sumption nor of the wholesale prices for the current timeslot. There is no acquisition uncertainty; the indicated volume ˆVc
n is always filled by the simulation.
3. Each customerCj decides the volume of electricityVnc(Cj)to consume given its
cur-rent tariff, and announces this volume to the simulation. The volume consumed,
Vnc(Cj), is derived from the corresponding customer’s consumption model, which we
describe below.
4. Based on the consumption decisions of its customers, its current tariff, and its acqui-sition in the wholesale market, each broker’s cash account is credited (debited) with a trading profit (loss)τc(Vnc)−Vˆc
n·Wn, whereτc(Vnc)denotes the cost of consuming
Vnc under the current tariffτcto the customers (i.e., the revenue of the broker), and
ˆ
Vc
n·Wndenotes the cost of procuring ˆVnc units of energy at the prevailing wholesale
priceWn. Any imbalance between the broker’s forecast, and the actual amount of
energy consumed by its customers is made up for by the Distribution Utility. An im-balance penalty ofIper unit of mismatch, or|Vc
n−Vˆnc| ·Iin total, is debited from the
cash account of the broker for this service.
5. Each broker receives ex-post information on the actual aggregate consumption volume 3We summarize the mathematical notation used here and below in Table 2.1.
of its customers in the current timeslotVc
n, its trading profit, its imbalance penalty, and