The case of Belgium
Isabelle Loris
Ghent University, Faculty of Civil Engineering, Centre for Mobility and Spatial Planning, Vrijdagmarkt 10/301, 9000 Ghent, Belgium
e-mail: [email protected]
Pascal De Decker
KU Leuven, Faculty of Architecture, HaUS, Paleizenstraat 65-67, 1030 Brussels, Belgium e-mail: [email protected]
Abstract
This paper analyses the demand and supply in the housing market of Belgium through several indices. On the basis of this analysis, housing market dynamics can be mapped in a spatial context. This mapping is based on a typology of municipalities. The different types of municipalities are compared and maps of spatial housing dynamics are conceived. These patterns are then set out to the desired spatial structure of Belgium. This gives insight in the contrast between the actual spatial dynamics and desired spatial dynamics by policy plans. Are we developing the housing market on the places where the market is the most dynamic or not?
Keywords: housing market dynamics, spatial planning, pressure, Belgium.
Introduction
One of the main drivers of spatial development and transformation, besides employment and mobility, is housing. Understanding housing market dynamics is thus essential to comprehend spatial patterns and developments. Understanding these developments is, in turn, important for policy making at steering the housing market. Such steering may for example consist in increasing supply of building plots to tame the housing pressure, or in revitalization of neighborhoods by local governments.
This article aims to map current housing market dynamics, using local data. To explore the spatial patterns, the case of Belgium, is put forward. Belgium, especially the northern part, is very densely populated and characterized by many small towns and urban sprawl (Figure 1). The total number of inhabitants in Belgium is approximately 11 million. The housing market is characterized by a large proportion of owners (>70%). Compared to other European countries, there is a limited willingness of the Belgians to move to a more suitable home. Meeus and De Decker (2015) note that “to facilitate residential mobility, the European Commission and the OECD repeatedly advised the Belgian government to lower the taxation of housing transactions to stimulate residential mobility from low work areas to areas with a lot of jobs”.
The framework we propose is based upon the notion of Jones, Leishman, and Watkins (2001) that the local housing market areas are composed of a system of spatially defined housing submarkets. Dimensions of housing submarkets are determined by both structural and spatial factors. While the housing market should be approached as a local market (Jones et al., 2001) and through sub-markets (Jones, 2002; Watkins, 2001), local data are necessary to analyze housing market dynamics. Until recently, the finest available data is often data on the level of municipalities. These data give an insight in the local housing markets. Nevertheless, they may
also mark interesting patterns at the neighborhood level. For instance in larger cities, this can sprout neighborhoods where investors are active and the speed of sale is high, or neighborhoods where there are a lot of long term vacant residential buildings and private market investments are low. To surpass the municipal borders and analyze data on a more micro-scale or on a more aggregate scale, data on the level of the individual property is needed. Being able to explore such micro data is an advantage. First, you get the original dataset on all listings for the whole of the country with historical data. This prevents extensive and technically complex searches to be carried out via web scraping of the Internet. Second, to have a dialogue with the private partner can provide interesting and first hand insights regarding the functioning of the housing market. Third, data on the level of single listings give a range of potential opportunities to analyze spatial patters and dynamics as from regional to local levels as to neighborhoods. The paper is organized as follows. In the next section, we describe the data and methodological framework with definitions of the used indices that guide our empirical investigation. The third section describes the empirical investigation, describing results for Belgium. To our knowledge, this is the first study to give insight in the Belgian housing market by mapping current dynamics. Our concluding remarks appear in the last section.
Data and methodological framework
Data
Two sets of data are used to conduct analyses. First, data used for analyses of the Belgian housing market are these from Belgian Statistics (www.statbel.fgov.be, www.plan.be and www.census2011.be), providing information on the number of dwellings per municipality, the number of transactions and providing forecasts of the population and housing prices. Secondly, analyses is conducted with data from a real estate portal website (www.Zimmo.be); this consists of Internet-data. The listings (3.85 million records) include variables over a period of 10 years (2005-2015) such as address, xy coordinates, type of housing (e.g. house, apartment, building plot, garage, commercial property), subtype of housing (e.g. penthouse, farm, studio, villa, bel-étage, bungalow, house, duplex, semi-detached, detached, …), if the listing is for sale, sold or for rent, listing price, year of construction, presence of a energy certificate, m² living space, type of environment (e.g. city, village, suburb, urban fringe, …), condition of the property (good, to renovate, new, …), services in the neighborhood (e.g. school, shopping, public transport, …), orientation (S, W, E, N), and the start and stop date of the listing on the internet. The data gives insight in what’s for sale (supply) and not what has actual been sold.
Not all variables are available for each record in the database. The original database contained some faults, probably due to export settings. Nonetheless, the greatest challenge is to overcome doubles, to filter out housing types that are not relevant (e.g. student homes, holiday homes, ‘other’, …), relisting, blanc fields etc.
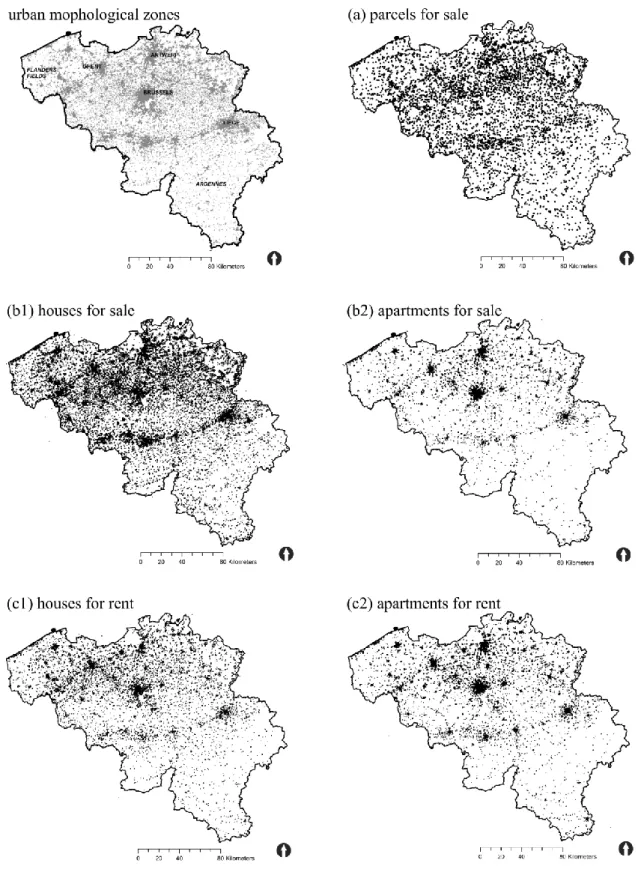
To do so, we cleaned up the dataset of the case study using Qlikview-software. First we made a selection for Belgium for the year 2014. This is the most complete year of the dataset and is used further on in the analyses. We subdivided it in five subsets to make it more manageable (Figure 1):
- Parcels for sale, which resulted in a set of 21.063 records, - Houses for sale (133.238 records),
- Apartments for sale (80.018 records), - Houses for rent (34.858 records), and - Apartments for rent (100.434 records).
As we want to study houses and apartments for sale and for rent and buildings plots, commercial buildings and garages were left out. Also student rooms, holiday houses and ‘other’
were left out,
Figure 1: Basic real estate data for the segmented housing market in 2014 ((a) parcels, (b1-2) buyers’ market and (c1-2) rental market). Source: real estate data obtained by Zimmo (2015); Urban morphological zones: EEA (2006)
resulting in a total of 369.611 records. Secondly we cleaned up the data skipping unrealistic or blank values for some key variables such as listing price, date first for sale. Addresses were also not always correctly spelled or more than ones registered in the database.
The main analyses are done with a geographical information system (GIS). Through the technique of spatial join the single listings and their characteristics (Figure 1) are allocated to municipalities, neighborhoods or other geographical designated areas. In our analyses, we use data and results on the level of municipalities and for the year 2014. This for the reason we could compare the results with the Belgian Statistics data.
Methodological framework
The framework recognizes that the dimensions of housing submarkets are determined by both structural and spatial factors simultaneously. Therefore more understanding is needed about the drivers of the housing market dynamics. Our empirical goals are twofold. First, we explore data on listings in Belgium to calculate different indices on the housing market. This paper examines the vacancy rate, the housing pressure and the speed of sale. These are put together with the average selling price and the population forecasts. Second, we map the housing market dynamics in Belgium.
Vacancy rate
The vacancy rate is the share of housing units that are unoccupied (for sale of for rent) and changes in time. The vacancy rate can be measured for the rental market as well as for the buyers’ market and both for houses and apartments.
A vacant building is, as Huuhka (2015) states, a building in transition. “It can act as reserve for current and future needs. It is a potential usable building that contributes to resilience.” Relationship with other variables such as demographic change or size of the building stock can increase understanding about the dynamics of this building stock. In this study, a vacant building does not always mean that the building is unoccupied; people can still live in it while it is for sale or for rent. They just have to move in time when it is sold or rented to someone else. A frictional vacancy is always considered as necessary to allow residential mobility. In Belgium, this is commonly estimated between 2,5 and 3,5 % (Ministerie van de Vlaamse Gemeenschap, 2004). The percentage varies across urban and rural areas. Since vacancies act as a market correction mechanism (Zabel, 2014) cyclic vacancy occurs if there is an oversupply of housing.
In this paper, we will calculate the actual frictional vacancy for Belgium, its local markets and submarkets, as these percentages seem low in comparison to other European countries (see e.g. Huuhka (2015): table 2). These results will be compared to demographic changes. In this context, Glaeser et al (2006) state that in principle, “if either the vacancy rate or household size is sufficiently flexible, then the stock of housing might not be so tightly linked with the size of the population.” Their examination of the distribution of vacancy rates across metropolitan areas “reveals that changes in vacancies are not likely to be a dominant explanation of changes in population growth.”
Housing pressure
There are several indices indicating pressure on the housing market. E.g. Kaklauskas (2015) elaborated on a ‘crisis thermometer’. In their research on supply elasticity, Helgers and Buyst (2014) suggest four manners to calculate changes in supply: the number of permits1 divided by the number of families, the number of permits dived by the number of dwellings, the number of
1
dwellings divided by the number of families and finally, the growth of the number of dwellings per annum. The second may be an indication of future changes. One step ahead of this process, listings can provide insight into the number of sales and any rebuilding afterwards. We will use the number of transactions per dwelling as an indicator of pressure on the housing market and define housing pressure as the percentage of transactions per dwelling and per municipality in Belgium.
Speed of sale
The speed of sale indicator is defined as the duration that houses are listed for sale on the market (‘time-on-market’), with the time that a listing is online as a proxy:
𝑇𝑂𝑀 = Tstop − Tstart TOM: time on market
Tstop: date upon the listing is no longer online Tstart: date upon the listing comes online
This index reflects an economic component of the housing market. For example, a lack of supply comes with a high price and a quick sale is an attractive housing market for sellers. Filippova and Fu (2011) offer an empirical investigation of the impact of marketing time on house sale price in New Zealand. They found that properties in a booming market sold more quickly than properties sold in a declining market. In addition, the relationship between time-on-market (speed of sale) and price show that prolonged time-time-on-market reduces sale price. This aspect couldn’t be investigated on in detail for our case study because lack of reliable information on altering price setting through time.
This interaction between speed of sale and house price is confirmed in two independent reviews of studies (Clauretie & Thistle, 2007; Johnson, Benefield, & al., 2007). Some empirical studies found a significant positive relationship, others found a significant negative relationship, while several studies conclude that speed of sale does not influence house price (see also Filippova and Fu (2011)). Miller and Sklarz (1987) and Knight (2002) and Koch and Maier (2015) confirmed that a greater degree of overpricing (listing price relative to value) results in longer marketing time and lower selling price.
In our study, we use a proxy for the time on market, i.c. the time on internet (TOI). Home buyers and tenants increasingly rely indeed on the Internet (Koch & Maier, 2015). We use data on real estate offers of apartments, homes and building plots in Belgium, which are published in the second largest real estate platform of Belgium (www.zimmo.be). To give an idea of the amount of listings ‘sold’ quickly, the share of listings that are a short time on internet, is calculated:
𝑇𝑂𝐼𝑟𝑖 =∑(𝑇𝑂𝐼𝑖 < 3𝑚𝑜𝑛𝑡ℎ𝑠) Tli
TOIri: share of listings that are for a short time listed in area i
∑TOIi<3 months: number of listings that are less than 3 months online in area i Tli: total amount of listings in area i
Relationship between the different indices and the importance for spatial planning
Space efficient strategies in planning should not only focus on urban densification through the development of new housing on urban greenfields, but also through the intensification of the existing housing stock. Flexibility of the housing stock can influence attractiveness of neighborhoods, population dynamics due to migration or changing household size, renovation areas, gentrification, changing demands and wishes concerning the type of house, etc., without the need for new housing developments on greenfields.
Yet, any ‘spatial efficiency’ strategy focusing on housing requires more quantitative and qualitative insights in the local dynamics of the housing market, with specific attention for price signals and imbalances between supply and demand. As stated by Gallent (2009), current and
future housing requirements reflect changing ambitions, expectations, values and wishes. To ensure a sustainable reuse of the existing housing stock, the housing market needs to be sufficiently flexible to attune demand and supply. There must be a sufficient number and diversity of houses on the market to enable moves and to fit housing ideals in terms of housing type, location, style etc. to the supply.
So, the housing market must be sufficiently large, flexible, transparent and accessible for buyers. The supply of properties must be adequately large and tailored to the housing needs and wishes. Also, it must be able to respond to residential demands of buyers and tenants at a specific time and a specific location: the geographical distribution of the supply must align with the geographic dispersion of residential demand, both in time and by housing type (e.g. detached house or flat). This is rarely the case, often resulting in residential pressure and rising housing prices.
Figure 2 illustrates the theoretical framework of housing market dynamics. The attentive reader will notice that this model lacks a number of facets (e.g. spatial planning and housing policy). This model is intended, therefore, only to illustrate a number of mechanisms that are employed to investigate a housing pressure indicator.
Three main situations are illustrated: (1) an oversupply due to a low demand, low price setting and a high vacancy rate, (2) a market under pressure due to high demand, high price setting, high speed of sale and a low vacancy rate, and (3) a tame market as a result of a low demand, low price setting, low speed of sale and a low vacancy rate. We will map the indices of price setting, speed of sale and vacancy rate to enlighten spatial dynamics on the housing market in Belgium.
Figure 2: Theoretical framework of dynamics on the housing market measured by some indicators and their interrelationships
While research provides some answers on the housing market dynamics, there are still some often noticed features in housing market dynamics that are not carefully investigated (Goa, 2009). It is often recognized that housing market dynamics vary across housing markets (Aalbers, 2003). Abraham and Hendershott (1996) and Zandi and Chen (2006) simply group housing markets by geographic location when studying housing market dynamics. However, such grouping may not necessarily cluster markets with similar dynamic properties. For better analysis of housing market dynamics, similar dynamic properties is needed. As previous stated temporal aspects, location, demographic variables (age cohort), and listing price are important to map spatial dynamics. Speed of sale is closely related to the listing price. Also context variables determine housing market dynamics (e.g. state of the building, energy performance, size). Capozza et al. (2004), on the one hand, recognize that house price dynamics vary significantly across local markets and across geographic areas.
It is generally believed that there exists a equilibrium house price in each local market. More often than not, the actual house price deviates from the equilibrium, but will eventually revert to the equilibrium. Since the speed of sale is linked with the listing price, e.g. when the speed of sale is very fast maybe the listing price was too low for the current market and visa versa. There is, however, a difference between the expected (listing price) and realized price. Moreover, the pricing difference tends to be consistent and exhibits serial correlation. It is believed that the serial correlation is due to the high transaction cost of real estate rather than bubbles or irrational behavior (Meese and Wallace, 1994). Nevertheless, we do not focus on this in detail.
Housing prices, but especially land prices are more expensive in Flanders and Brussels than in Wallonia (Figure 3). There exists a positive correlation between the average selling prices of houses, apartment and building plots (Table 1). The higher the prices, the lower the share of transactions on the real estate market, but the higher the vacancy rates on the rental and on the buyers’ market. The share of listings that are for a short time on the market decreases as the prices sweep up. In relation to the research question, the variables ‘housing pressure’ and ‘housing dynamics’ are in our focus.
Figure 3. Housing prices (€) and building plots prices (€/m²) in Belgium per municipality in 2014. Source: Statbel.be (2016).
Table 1: Correlation between the main indices.
correlation ave rage s el li ng pr ic e hous es ave rage s el li ng pr ic e bui ldi ng pl o ts ave rage s el li ng pr ic e apa rt m ent s housi ng pr es sur e vac an cy r at e on t he r ent al m ar ket vac an cy r at e on t he bu yer s’ m ar ket sha re hous es and a p ar tm ent s tha t ar e f o r a shor t ti m e li st ed
average selling price houses 1 0,371 0,552 -0,182 0,305 0,100 -0,259 average selling price building
plots
1 0,586 -0,018 0,247 0,155 -0,257 average selling price
apartments
1 -0,114 0,174 0,082 -0,169
housing pressure 1 -0,080 0,182 0,124
vacancy rate on the rental market
vacancy rate on the buyers’ market
1 -0,198
share houses and apartments that are for a short time listed
1
Results and discussion
This section gives the overview of the results of the investigated indices of housing pressure, vacancy rates, speed of sale, trends in building permits, the housing market dynamics and the comparison with existing migration patterns, leading to the map of spatial housing market dynamics in Belgium.
Housing pressure
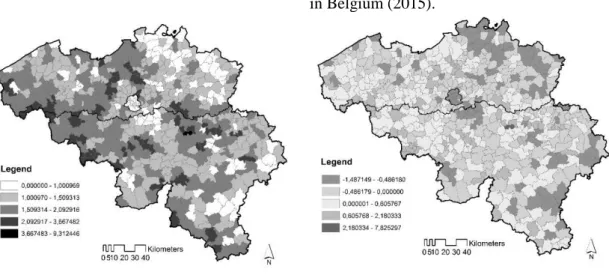
A limited negative correlation can be observed between the prices, both of apartments, houses and land, and the housing pressure. This indicates that the higher the price, the lower the share of transactions. This is particularly the case in the more expensive regions such as the Brussels Capital Region, and the suburban residential areas around Brussels (Lasne, La Hulpe ...), Antwerp (Schoten, Brasschaat, ...) and Ghent (St.-Martens-Latem, ...) and Bree (province of Limburg). Also the region of Bastogne in Wallonia stands out (Figure 4).
Figure 4. Index ‘housing pressure’. Source: processed data from Statbel.be (2015)
Figure 5. Deviation of the mean of transactions per dwelling and per municipality in Belgium (2015).
Short-term vacancy rate
The vacancy rate is calculated for each submarket: rental, buyers and newly built (parcels). The latter only for Flanders as we don’t have data on available plots in the Brussels Capital Region and in Wallonia.
There is –on the one hand- a negative correlation between the rental market and the buyers’ market: the more there is for rent, the longer houses and apartments are for sale (Table 1). On the other hand, the amount of rental properties correlates with the amount of houses and apartments that are for sale. It can be assumed that a shortage in one market (e.g. rental market) will therefore have a shortage in the other market segments (e.g. buyers’ market).
The overall pattern of vacancy rates, especially on the rental market, is one of urban areas. The vacancy rate is higher in cities than elsewhere (Figure 6). This pattern is less distinct for the
buyers’ market (Figure 7). The availability of building plots shows less or more a different pattern. More rural areas tend to have a greater vacancy rate than the cities (Figure 8).
Figure 6: Vacancy rate on the rental market (houses and apartments) in 2014
Figure 7: Vacancy rate on the buyers’ market (houses and apartments) in 2014
Figure 8: Vacancy rate on the building plots market (only data available for Flanders) in 2014
Speed of sale (time-on-internet)
On the one hand, apart from the coastal zone and the cities of Antwerp and Brussels, where the proportion of properties that are for a short time for sale, there seems to be no distinct pattern that can be observed for Belgium (Figure 9). On the other hand, if we examine the proportion of listings of apartments and homes that are for a short time on internet (<3 months), then we perceive a pattern that covers mostly rural areas (Figure 10). So it looks like properties are sold quicker in the rural areas than in the cities. This pattern is not consistent with the distribution of the to be expected growth in households (Figure 11). At least not for Flanders.
Figure 9. Share of listings of apartments and homes that are for a short time (less than 3 months) listed per municipality in Belgium in 2014.
Figure 10. Above or below average share of listings of apartments and homes that are for a short time (less than 3 months) listed per municipality in Belgium in 2014.
Population and household projections
Figure 11: Forecasts of the population (a) and households (b) over the period 2015-2060 per district.
a b
Trends in building permits
The overall pattern of the number of building permits for new homes follows the pattern of urbanization and population density (Figure 12). Most new homes are built in Flanders, the Brussels Capital Region and the industrial belt in Wallonia. The past ten years (2000-2014) we see a general view of an increasing amount of building permits all over the country, excepted for in Flanders Fields, the Famenne region, the Hautes Fagnes (eastern part of Wallonia) and parts of the Campines (northeastern part of Flanders).
Figure 12: Number (a) and increase (b) of permits for new homes in 2014. Source: Stabel.be (2015)
a) b)
Housing market dynamics
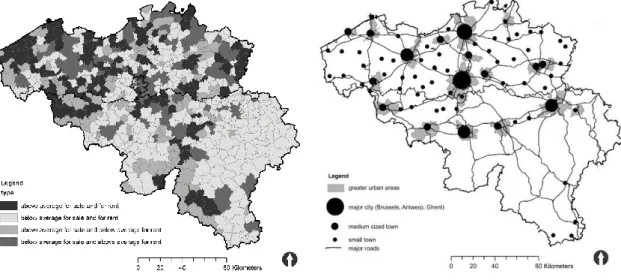
When looking into the vacancy rates in detail (Figure 13), one can see that –in general- the rates are above average for rent as for sale in the more urbanized areas (Figure 14). This is especially the case in Flanders.
Figure 13: Summary map of the housing dynamics in Belgium: vacancy rates above or below average (2014).
Figure 14: geography of the major cities and roads in Belgium
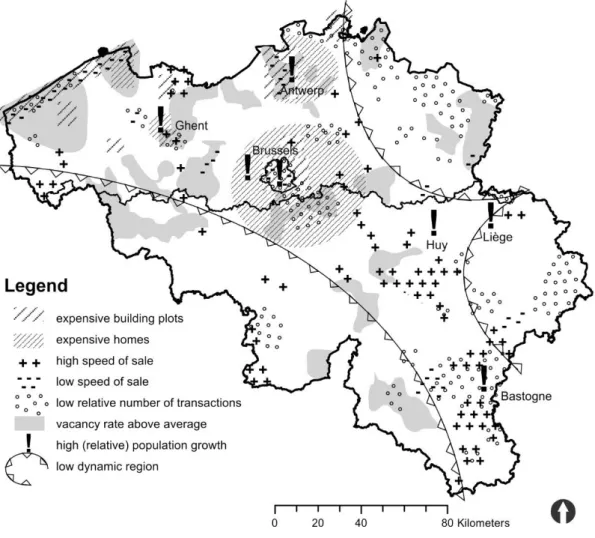
When we combine previous maps we distinguish different cases in Belgium regarding housing market dynamics (Figure 15). First, the big cities of Antwerp, Brussels and Ghent with their expensive suburban fringes. The city centers are characterized by expensive building plots and an vacancy rate of houses above average. The population growth is high. The residential areas in the south of Ghent, the east of Antwerp and the east of Brussels (with a lot of expats), are typical expensive areas, where the rich live. Secondly, the coastal area. Building plots are expensive and there is a relative low number of transactions. Apparently apartments sell arduously because the speed of sale is low. This is related to the phenomenon of holiday homes
at the coast. Thirdly, the area near Bastogne. Little properties are sold and if they are sold, they sell quickly. The proximity of the Grand Duchy of Luxembourg plays a role.
Besides these cases, the most western part of Wallonia and the most eastern part of Wallonia and of Flanders know a very tame market. In between, there are some particular cases, e.g. the region around Huy which is characterized by a high expected population growth and a high speed of sale. The region of the Dender valley on the contrary is characterized by a vacancy above average and a low speed of sale. The vacancy rate is also above average around the area of Thournai and Saint-Hubert.
Figure 15: Schematic map of housing market dynamics in Belgium (2014)
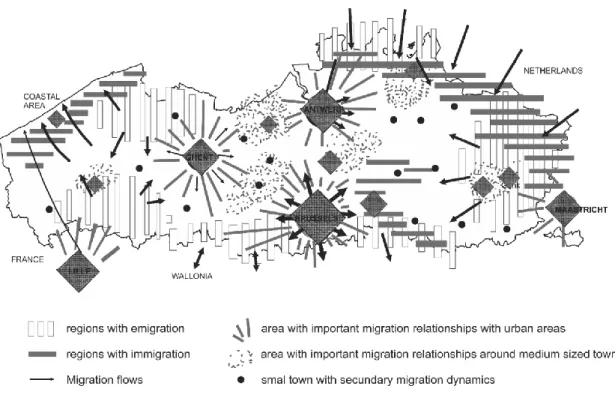
Comparing this map to the map with the migration patterns (in Flanders), some similarities can be noticed (Figure 16). The big cities know all the phenomenon of suburbanization which put pressure on the housing markets in the suburbs of these cities. A similar effect can be seen on the coastal area. The crossborder migration from the Netherlands to Flanders in the east of Belgium is less noticeable on the housing market dynamics map. This is probably due to the timelaps between both maps. The migration patterns date from 2006 as where the map of the spatial dynamics is more recent (2014). There must be a shift in the intensity of migration between 2006 and 2014, taking away pressure on the housing market in these border regions.
Figure 16: Existing migration patterns in Flanders (northern part of Belgium) in 2006. Source: Loris (2011)
Conclusion
Our empirical goals were twofold. First, we explored data on listings in Belgium to calculate different indices on the housing market. Second, we mapped the housing market dynamics in Belgium and compared this with migration patterns. This map reveals several varieties regarding spatial dynamics. First, the big cities with their expensive suburban fringes. The city centers are characterized by expensive building plots and a vacancy rate of houses above average. The population growth is high. Secondly, the coastal area; an expensive area with a low relative number of transactions and a low speed of sale. Thirdly, the area near Bastogne. Little properties are sold and if they are sold, they sell quickly. The proximity of the Grand Duchy of Luxembourg plays a role. Besides these cases, the most western part of Wallonia and the most eastern part of Wallonia and of Flanders know a very tame market.
We considered how a better understanding of linkages between indices of the housing market in Belgium might help planners to gain insight in spatial housing market dynamics so they can steer upon pressure areas. A confrontation with the desired policy hereby could give direction to the steering. The links between the local housing markets and the regional planning system will enable to reveal regional spatial patterns in housing. This large-scale approach can mask important intra-urban cleavages in the market as housing demand can be neighborhood specific (Jones et al., 2001). This intra urban scale has still to be analyzed in the Belgian context.
The explorative nature of the research stems from the data used in this study. In contrast to other studies, this study is based on Internet-data. The uniqueness of the used data is that its covers mostly all individual listings as on the Internet for the past ten years. These data were not available for research in Belgium until now. It allows a detailed analyses of the housing market. The disadvantage of the data is that they only contain listings that Zimmo can scrape from other real estate websites. Unbrokered sales, for example for sale by the owner, are not included. It’s unclear what this proportion may be. Nonetheless, one may assume that the market becomes more and more professional and the proportion of private sales diminishes. Indeed, selling a
property takes time and money and sellers assess carefully whether their effort pays off. Nonetheless, combination with additional census-data can provide extra insights in the dynamics of the housing market in Belgium. Further research can be done on the degree of overpricing (DOP), the calculated ratio between the actual selling price and the listing price. The closer the listing price is to the selling price, the shorter the property stays on the market (Koch & Maier, 2015). The relationship between these variables can be measured on the scale of municipalities.
Another aspect that needs further investigation is temporal dynamics. How do spatial patterns of housing dynamics shift over time? Our results apply only to the time and location for which data were available. Additional, the housing needs can be compared to the listings of houses, apartment and building plots. Thus demand and supply have to be attuned. This aspect, in turn, can be linked to migration patterns.
Acknowledgements
The authors thank Zimmo for providing data on listings in Belgium. The authors gratefully acknowledge the helpful suggestions of Luuk Boelens and Ann Pisman.