Computing, Information and Control ICIC International c⃝2011 ISSN 1349-4198
Volume7, Number1, January2011 pp.253–268
APPLICATION OF QUALITY FUNCTION DEPLOYMENT TO IMPROVE THE QUALITY OF INTERNET SHOPPING WEBSITE
INTERFACE DESIGN
Hui-Ming Kuo1 and Cheng-Wu Chen2,∗ 1Department of Logistics Management
Shu-Te University
Yen Chau, Kaohsiung County, 82445, Taiwan 2Institute of Maritime Information and Technology
National Kaohsiung Marine University Kaohsiung 80543, Taiwan
∗Corresponding Author: [email protected] Received August 2009; revised December 2009
Abstract. The popularization and rapid development of the Internet has fostered the growth of online shopping leading it to become an important new channel for consumers to make purchases. However, the Internet users’ rate of satisfaction has declined since online shopping has become an important consumer option. In order to improve customer satisfaction and to enhance the shopping experience, it is very important, first of all, to understand the customer quality needs particular to the Internet shopping website, then to meet these needs through suitable website interface design. A B2C shopping website is used as an example in this study. Quality function deployment (QFD) is utilized to attain an understanding of customer quality needs, quality elements, and the relationship between them. Suggestions for improving the quality of website design are proposed based on the case study and the major performance indices discussed. Conclusions can be used as reference for online shopping website operators wishing to enhance the competitiveness of their websites in the highly competitive online shopping market.
Keywords: Online shopping, Shopping website, Quality function deployment (QFD), Quality need, Quality element
1. Introduction. The Internet can be characterized as being fast, convenient and distan-ce-free. This means that there are no times or geographic limitations. Operating expenses and rent are less for online shopping stores. The growth in the number of online shopping sites has been rapid. Data from the Institute for Information Industry (III) [1,2] confirm e-commerce to be a growing trend in Taiwan. Internet user transactions and the revenue generated by online shopping companies are estimated to be about 145.2 billion NT dollars, 93.5 billion NT dollars from the online shopping market. In 2007, the online shopping market reached 185.5 billion NT dollars. The predicted growth rate in 2008 is 36% [3].
Although online shopping has become a growing new trend and an important purchasing channel, consumers are still not very satisfied with the current design and operation of the shopping websites [4]. According to an analysis from the Eastern Integrated Consumer Profile (E-ICP) [5], the quality of the website design is a very important factor affecting the consumer’s online shopping behavior. In order to increase market share in the face of fierce competition, every aspect of the services offered on websites must be improved. Attention must be paid to consumer needs to improve customer satisfaction. The goal is
to make customers want to come back to make more purchases as well as to prevent the possibility of being eliminated through competition.
The factors that affect consumer purchase behaviors include the characteristics of the customers, the characteristics of the products sold, the design of the online store’s website, the characteristics of the Internet, and the like [6,7]. Of these, the website design is the easiest to improve. Chang [8] reported that a yearly survey of retail consumers disclosed that although the major driving force behind online consumption is price, the ease-of-use of the website interface is the key factor that decides whether consumers will go on to the enquiry stage or not. Palmer [9] found that as long as retail companies provide reasonable prices (not necessarily the lowest prices), an easy-to-use website user interface and good customer service, customers will choose to return to the same website to purchase more
items, in other words, because of the satisfying online experience. Furthermore, the
website user interface, which has a big influence on the visitors’ first impressions, is the key factor that determines whether consumers will continue shopping [10]. A well-designed website can not only strengthen the consumer’s intention to purchase, but also draw attention to it from the wide variety of other options available. Clearly, the quality of the website design is very important to the online store.
To improve customer satisfaction and provide a better shopping experience, it is im-portant to understand and meet the customer’s needs, for which website design is very important. This study should help designers to understand customer needs which are categorized using quality function deployment (QFD) to find the quality elements. The correlation matrix is used to plot the degree of relationship between customer needs and quality elements. Our conclusions can be used as reference for website designers and owners. Hopefully, important items can be improved to ameliorate problems with website quality, customer satisfaction can be increased, and the competitiveness of the shopping website can be strengthened.
2. Literature Review. In this section, literature related to online shopping, customer satisfaction, QFD, etc. is reviewed.
2.1. Online shopping and satisfaction. The growing number of computer users and the popularization of the Internet have caused the Internet population in Taiwan to swell, reaching ten million in September, 2007. This popularity has meant that the Internet environment in Taiwan has come to maturity. Following the trend of increased Internet use, all kinds of Internet applications have been developed. Online shopping is one ex-ample (Institute for Information Industry (III), 2007) [11-13]. According to III statistics, in 1999, the size of the online shopping market was only 1.63 billion NT dollars, not even 0.1% the size of the traditional retail market. However, in recent years, the cost of Inter-net bandwidth and hardware has been decreasing, broadband is becoming more popular, and users are gradually developing the habit of online consumption. The online shopping market is once again being noticed. Service providers keep on improving practical opera-tions and related support systems are becoming more and more complete. Many business models are becoming mature. In 2005, the online shopping market reached 59.8 billion NT dollars, having expanded 36 times in only six years. In 2007, the market size reached 185.5 billion NT dollars, and is expected to reach 253 billion in 2008. This is a growth of 150 times in only 10 years [12].
In the United States, 60% of the Internet population shop online. The size of the American online shopping market is 136.6 billion US dollars. That market has experienced 31% growth since 2003. In 2005, e-commerce transactions reached 172.4 billion US dollars, which is 7.7% that of physical retailers. It is expected to reach 328.6 million US dollars in
2010, which is 13.8% the transaction amount of physical retailers. The compound annual growth rate from 2005 to 2010 is 13% [1]. The Internet population in Western Europe has also been growing as more and more people are interested in shopping online. In 2004, the online shopping market reached 41.1 billion Euros, and is expected to reach 78.6 billion Euros in 2007. This means that the compound annual growth rate from 2004 to 2007 could be as high as 24% [2]. According to III, American online sales make up the largest share of the retail market, 9.4%; Europe has 7.3%; but Taiwan has only 3.6%. In terms of market size, in 2007, the online shopping market in Taiwan was only 3.3 billion US dollars, but in Europe and the United States it was 130 billion US dollars and 230 billion US dollars, respectively. Compared with the markets in Europe and the United States, there is still large space for improvement and great potential for development.
Despite the rapid growth of online shopping, the level of user satisfaction has dropped, from 79% in 2001 to 60% in 2005 [11]. This is because consumers now attach more importance to online shopping and their expectations are getting higher. There are many reasons why consumers feel unsatisfied. In addition to transaction security, unknown product quality, and unclear shopping procedures, dissatisfaction is also directly related to the inability to provide the same level of information as in physical shopping where one can actually touch the products. If a website could provide sufficient information to consumers it should be able to encourage people to shop online [5]. In terms of providing sufficient information, giving customers the chance for a more direct experience should be much more effective than simply bragging. According to one analysis of Internet shopping behavior in the UK, many UK consumers feel that online information can be used as reference before making purchase decisions. In other words, even those who do not do purchase anything online still look at products on the Internet. This shows the importance of online references [14-17].
Lee [18] pointed out that there are three important factors that affect consumers’ re-peat purchase behavior. Customer satisfaction is one of them which he suggests affects consumer confidence and this leads to repeat purchase behavior. The quality of website service is also an important factor that affects the consumers’ desire to consume and their loyalty [19]. The quality of website service is related to product promotion, an efficient and rewarding shopping experience, and reliable product or service delivery. The quality of the website service is defined by the consumers’ feelings about the level of service while browsing the website, placing an order, making a payment, or otherwise interacting with the online store [20].
Operators of online shopping websites should not focus only on pricing strategies to enhance competitiveness. It is more important to maintain a high level of quality. Besides the search engine, a good website user interface should provide other functions which would not only draw consumer attention but simplify the purchasing process. Improving the quality of website services to meet customer needs has always been the key to success when it comes to operating shopping websites. However, if the quality needs of Internet consumers cannot be understood, it is impossible to actually improve website quality. 2.2. Quality function deployment. Generally speaking, QFD is a research tool, a systematic method that can be used to provide the information needed to help modify products to meet customers’ expectations. It can help to transform customer needs into design quality, to deploy the functions forming quality, and to deploy methods for achiev-ing the design quality into subsystems and component parts, and ultimately to specific elements of the manufacturing process. QFD is used to find the quality elements and engineering management measures that have the greatest influence on customer needs. This is done through importance evaluation analysis and the deployment of a relationship
matrix formed by the relationships between customer needs, product quality elements, and engineering management measures. Enterprises can use engineering management in key places to satisfy their customers and get real benefits in return [21].
In addition to being used for product design and in the manufacturing industries, QFD has also been widely used in recent years in other areas such as for business process reengineering, medical treatment, quality improvement in the service industry, education, and so on. As shown in Table 1, although QFD has been used in a wide range of appli-cations, it has rarely been applied in studies related to online shopping even though the development of online shopping has been rapid and has great potential. However, QFD can be applied as a first step to improve the quality of internet shopping websites, which will definitely boost their competitiveness.
The House of Quality (HOQ) is used as an interface tool in these types of applications. The HOQ includes six major parts:
(1) Customer needs: Description of customer quality needs and expectations. Information on customer quality needs to be retrieved by means of survey questionnaires and interviews. A complete understanding of customers must be made before applying QFD. Since most customers are usually vague about their primary needs, these must be expanded to secondary needs, sometimes even tertiary needs.
(2) Quality elements: Customer needs are transformed into strategies which enterprises are able to apply.
(3) Relationship matrix: Reveals the relationships between each quality element and cus-tomer needs. Comparison is made of the relationship between each cuscus-tomer need item and each quality element item. Each vector of quality elements must be or-thogonal to each vector of customer needs. A matrix is formed where the complex relationships between quality elements and customer needs are displayed with signs or weights.
(4) Correlation matrix: Reveals the correlations between solutions.
(5) Competition analysis: Compares major competitors with this enterprise to find advan-tages and disadvanadvan-tages. A weight evaluation table is created according to customer needs and quality elements.
(6) Prioritize: Finally, customer needs can be prioritized based on the HOQ results and solutions executed in order of importance.
3. Research Methodology. It is very important to come up with better website designs to satisfy customer quality needs, however, one first needs to understand these needs. The purpose of this study is to identify customer quality needs, to find quality elements with QFD, and then to ascertain the relationship between customer needs and quality elements. Finally, last but not least, to give an indication of the key direction for practical improvement of an Internet shopping website, in order to improve its competitiveness. The process is discussed in detailed below.
3.1. Identify customer quality needs. First expert interviews were conducted to ob-tain an initial understanding of customer quality needs. Subjects interviewed were con-sumers who often shop online. Before the interviews, questionnaires were designed based on the literature review. The interviews and questionnaires were used to retrieve in-formation related to customer quality needs for shopping websites. The need-related information obtained from the interviews was then thoroughly analyzed and interpreted, and transformed into customer quality needs for shopping websites.
The KJ method was then used to categorize customer quality needs. Linguistic or textual data on unknown problems, newly-encountered problems, opinions, and ideas were
Table 1. Application of QFD in different domains in recent years
Authors
Brief description Application domain
Empirical and the Year of study the Study Wu,
Simplify “house of quality” matrix; Pareto analysis is
Integration of quality applied after simplification in order to review the role
analysis tools – 1995
QFD plays in total quality management from the
simplification, diagnosis, No aspect of design; examination and integration with
and flexible use of QDF. Taguchi’s quality engineering concepts.
Lee,
QFD is used to complete to complete the following:
Education – Improvement 1. House of quality of students’ quality needs for
school support 1998
2. House of quality of students’ quality needs for
of teaching quality Yes teaching programs
3. House of quality of enterprises’ quality needs for schools’ supports for teaching programs
Wang,
Use QFD to help enterprises find the best strategy to
Service quality of
Yes improve service quality; provide a set of objective
convenience store chains 1998 evaluation methods to more tightly combine customer
needs with technology for quality improvement.
Hwang,
Find the weights of the degree of associations between Improvement of quality
No quality needs on the left side of house of quality under analysis tools – influence
consideration; analyze the association between required of the association between items with the fuzzy number method; then consider the integrated quality analysis 1998 results with the original weights to explore its influence tools’ qualities of
on QFD. integration on quality
elements Wang QFD is used as a tool to systematically improve service
Yes et al., quality of the rapid transit system, including three Service quality of Taipei
2000 major contents: quality deployment, technology Rapid Transit System deployment and service positioning.
Hwang Consumer-needs-oriented. To transform consumers’
Quality needs of
ready-Yes and quality needs into measurable quality characteristics;
made clothing designs Tang, explore the main factors which affect the design of
2003 ready-made clothes and product qualities.
Lin,
Discuss important consumer hot-spring hotel service
Service quality of
Yes needs; combine QFD’s house of quality to put customer
care needs into internal process design of services to find
hot-spring hotels key operational technology for management in response
2006
to important items of quality needs worthy of high priorities, in order to make sure the services provided meet customers needs and to shorten the distance between customers and service providers.
Ben Clegg, To show how QFD can be used as part of a structured Micro-sized enterprise –
No Boon Tan, planning and analysis framework for micro-sized framework integrating
2007 enterprises to build-up their e-business capabilities. the balanced scorecard, value chain and QFD. Sangeeta Based on literature, use QFD to outline the results General online retailing
Yes Sahney, and identify the critical factors for success in online – application of QFD and
2008 retailing. interpretive structure
modeling.
collected and the relationships between them charted. In this way thoughts on complex appearances can be organized, the essence of the problem perceived, and solutions found. The KJ method is one of the most popularly used management tools these days. It can be applied to help clarify the content and structure of a problem, regardless of whether the problem encountered is simple or complex, thereby making it easier to control (Japan Management Association, 1988) [22]. The questionnaire designed based on categorized
needs was utilized to retrieve information about customer satisfaction and importance of needs. The questionnaire comprised three major sections: customer profile, quality need satisfaction, and quality need importance. The 5-point Likert scale was used for scoring satisfaction and importance.
3.2. Quality function deployment.
(1) Extraction of quality elements from customer needs: A quality element is extracted for every customer need, based on the basic principles of website design as obtained through expert interviews and the literature review.
(2) Categorization of the quality elements extracted.
(3) Creation of a QFD table with the categorized quality elements.
3.3. Relationship between customer needs and quality elements. Five experts fa-miliar with online shopping, who are regular online shoppers, were interviewed. A matrix diagram is created from the customer needs table and the QFD table. The relation-ships between customer needs and quality elements are identified. 5 points are given for “strongly related” relationships, 3 for “neutrally related” relationships, and 1 for “weakly related” relationships. This category is left empty if no relationship exists. The data are analyzed with statistical methods to obtain the degree of relationship between customer needs and quality elements.
3.4. Case study of a quality plan for an online store. A popular B2C website known as “unimall” was chosen for the case study. The advantages and disadvantages of this website case were found through competition analysis. The key principles to enhance the website’s competitiveness in the market were found through QFD planning.
4. Analysis of Results.
4.1. Customer quality needs.
4.1.1. Quality need deployment. Information on customer quality needs was garnered from
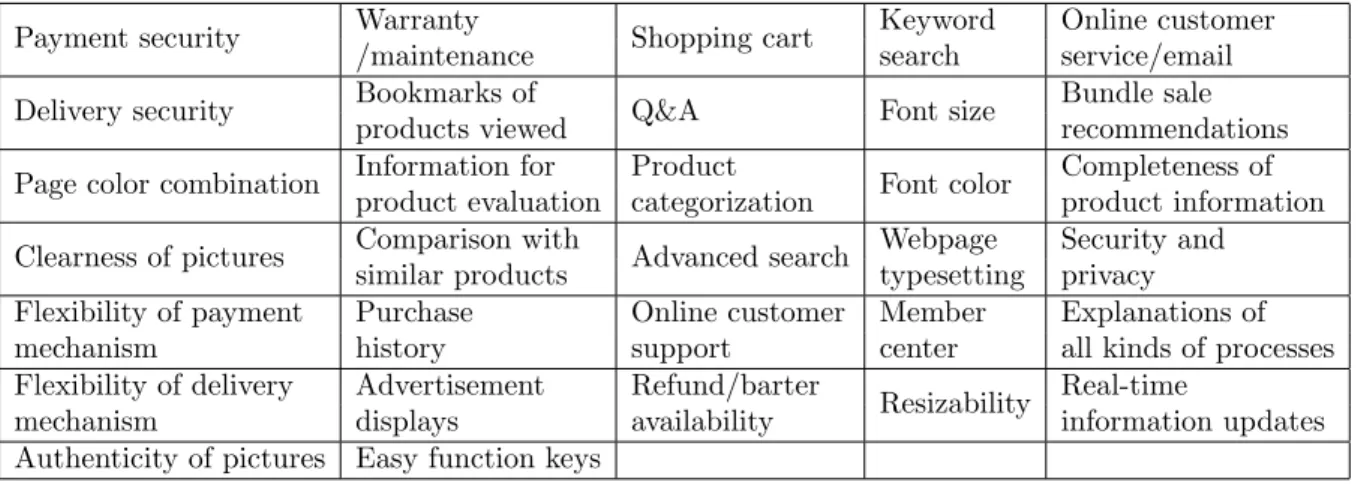
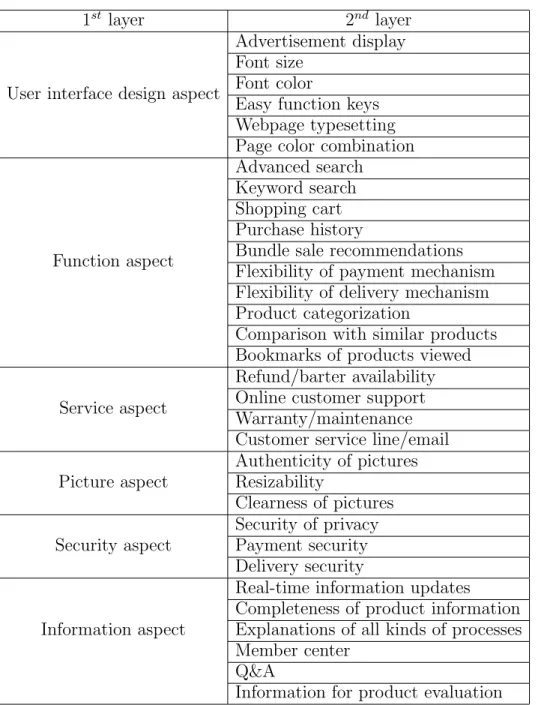
interviews with eight frequent online shoppers. The 32 customer needs are seen in Table 2. The KJ method was used to group the needs with similar contents or characteristics together, to form the customer needs table seen in Table 3. In Table 3, the 32 quality need items are categorized into 6 groups, including User interface design, Function, Service, Picture, Security and
Table 2. Quality needs of internet consumers
Payment security Warranty Shopping cart Keyword Online customer
/maintenance search service/email
Delivery security Bookmarks of Q&A Font size Bundle sale
products viewed recommendations
Page color combination Information for Product Font color Completeness of product evaluation categorization product information Clearness of pictures Comparison with Advanced search Webpage Security and
similar products typesetting privacy
Flexibility of payment Purchase Online customer Member Explanations of
mechanism history support center all kinds of processes
Flexibility of delivery Advertisement Refund/barter
Resizability Real-time
mechanism displays availability information updates
Table 3. Customer quality needs
1st layer 2nd layer
User interface design aspect
Advertisement display Font size
Font color
Easy function keys Webpage typesetting Page color combination
Function aspect
Advanced search Keyword search Shopping cart Purchase history
Bundle sale recommendations Flexibility of payment mechanism Flexibility of delivery mechanism Product categorization
Comparison with similar products Bookmarks of products viewed
Service aspect
Refund/barter availability Online customer support Warranty/maintenance Customer service line/email Authenticity of pictures
Picture aspect Resizability
Clearness of pictures Security of privacy
Security aspect Payment security
Delivery security
Real-time information updates
Completeness of product information
Information aspect Explanations of all kinds of processes
Member center Q&A
Information for product evaluation
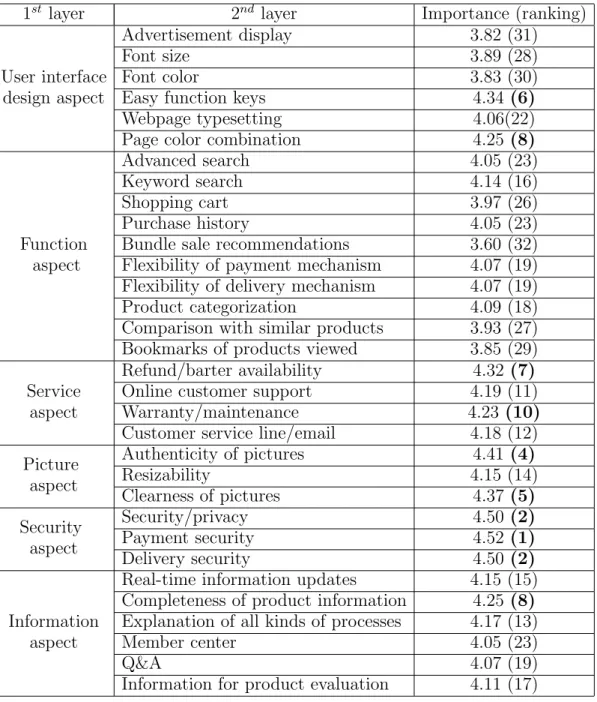
4.1.2. Importance of customer quality needs. To evaluate the importance of each quality
need for the customer, we randomly surveyed visitors to the Youth website. Participation was encouraged by giving away free points. The subjects were consumers with previous
online shopping experience. 210 questionnaires were issued with 150 remaining after
discarding incomplete or otherwise invalid ones. The response rate was 71.4%. The 5-point Likert scale was used in the questionnaire. The results of statistical analysis are listed in Table 4. The top five quality needs, to which customers attach the most importance are: payment security (4.52), security and privacy (4.50), delivery security (4.50), authenticity of pictures (4.41), and clearness of pictures (4.37). The results show that customers care most about security and pictures.
4.2. Quality element deployment. The quality elements were extracted from
cus-tomer quality needs. This was done by organizing and categorizing the information
results are listed in the quality element deployment table below (Table 5). Table 5 shows
that after deployment, eight 1st layer groups were formed (Basic design, Esthetic
edit-ing, System upgrade, Attitude, Categorization, Standardization, Frequency, Alliance with different industries), with each of them containing many quality elements.
Table 4. Importance and ranking of customer quality needs
1st layer 2nd layer Importance (ranking)
Advertisement display 3.82 (31)
Font size 3.89 (28)
User interface Font color 3.83 (30)
design aspect Easy function keys 4.34 (6)
Webpage typesetting 4.06(22)
Page color combination 4.25 (8)
Advanced search 4.05 (23)
Keyword search 4.14 (16)
Shopping cart 3.97 (26)
Purchase history 4.05 (23)
Function Bundle sale recommendations 3.60 (32)
aspect Flexibility of payment mechanism 4.07 (19)
Flexibility of delivery mechanism 4.07 (19)
Product categorization 4.09 (18)
Comparison with similar products 3.93 (27)
Bookmarks of products viewed 3.85 (29)
Refund/barter availability 4.32 (7)
Service Online customer support 4.19 (11)
aspect Warranty/maintenance 4.23 (10)
Customer service line/email 4.18 (12)
Picture Authenticity of pictures 4.41 (4)
aspect Resizability 4.15 (14)
Clearness of pictures 4.37 (5)
Security Security/privacy 4.50 (2)
aspect Payment security 4.52 (1)
Delivery security 4.50 (2)
Real-time information updates 4.15 (15)
Completeness of product information 4.25 (8)
Information Explanation of all kinds of processes 4.17 (13)
aspect Member center 4.05 (23)
Q&A 4.07 (19)
Information for product evaluation 4.11 (17)
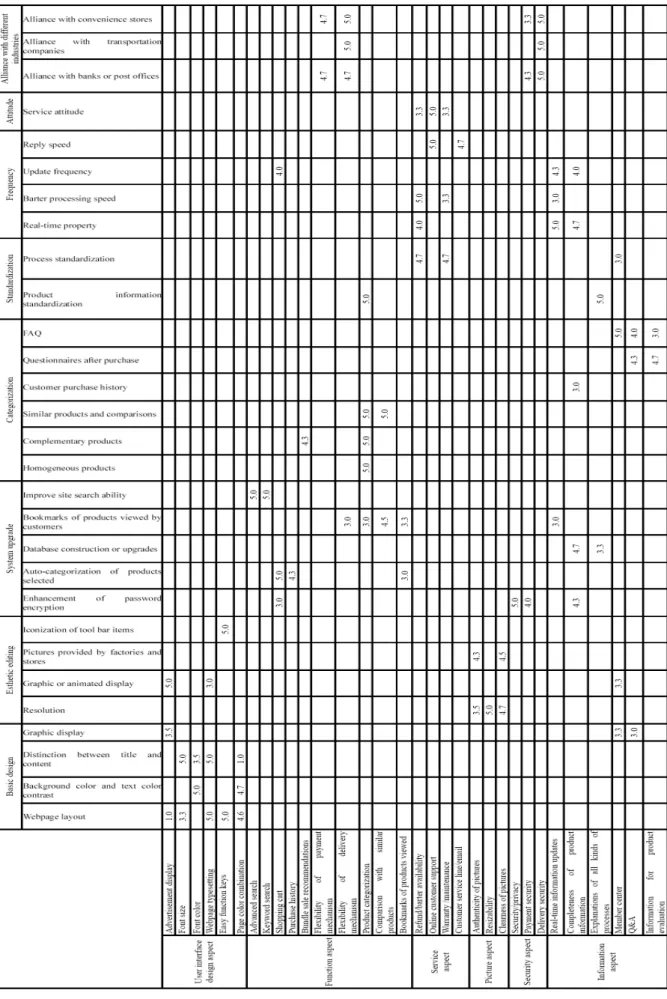
4.3. Relationship between customer quality needs and quality elements. Expert interviews were conducted with five experts experienced with Internet store webpage designing. The relationships between customer quality needs and quality elements are identified with a matrix diagram. 5 points are given for “strongly related” relationships, 3 for “neutrally related” relationships, 1 for “weakly related” relationships and the category is left empty if no relationship exists. The relationship averages are calculated for the data obtained. Values less than 1 are not displayed. The relationship diagram is shown as Figure 1.
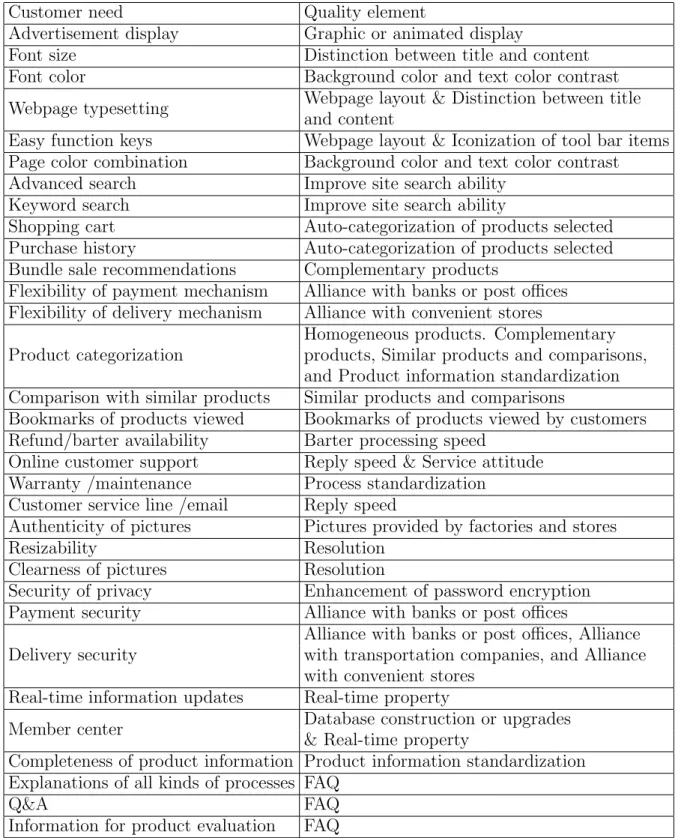
The relationship between customer quality needs and quality elements can be seen in Figure 1. The relationship between an item from quality needs and a quality element is higher when the corresponding value shown in Figure 1 is closer to 5. For example, “Ad-vertisement display” from the “User interface design aspect” has the strongest relationship with “Graphic or animated display”, with a corresponding value of 5. “Font size” has the strongest relationship with “Distinction between title and content”, with a corresponding value of 5. “Font color” has the strongest relationship with “Background color and text color contrast”, with a corresponding value is 5. “Webpage typesetting” has the strongest relationship with “Webpage layout” and “Distinction between title and content”, both with corresponding values of 5. “Easy function keys” has the strongest relationship with “Webpage layout” and “Iconization of tool bar items”, both with corresponding values of 5. “Page color combination” has the strongest relationship with “Background color and text color contrast”, with a corresponding value of 4.7.
Table 5. Quality element deployment
1st layer 2nd layer 1st layer 2nd layer
Webpage layout Homogeneous products
Background color and Complementary
Basic text color contrast products
design Distinction between Similar products and
title and content Categorization comparisons
Graphic display Customer purchase history
Resolution Questionnaires
Graphic or after purchase
Esthetic animated display FAQ
editing Pictures provided Product information
by factories and stores
Standardization standardization
Iconization of
Process standardization tool bar items
Enhancement of
Real-time property password encryption
Auto-categorization
Barter processing speed
System of products selected Frequency
upgrade Database construction Update frequency
or upgrades
Bookmarks of products
Reply speed viewed by customers
Improve site Alliance with banks
search ability
Alliance with or post offices
Attitude Service attitude
different Alliance with
industries transportation companies
Alliance with convenient stores
4.4. Case study: Quality planning for online stores.
4.4.1. Website and competitor satisfaction analysis. The B2C “unimall” website was
shopping websites, PChome and Yahoo were included in the computer analysis. Satis-faction surveys were conducted for each site. SatisSatis-faction analysis of the collected data related to the three shopping websites was performed through satisfaction surveys by five experts. The results of analysis are shown in Figure 2.
In this figure it can be seen that the “unimall” shopping website score for “Clearness of pictures” was 3.8 and 4.6 for “Payment security”. The rating for these two categories was better than for the other two websites. It scored 3.4 for “Advertisement display”, 3.8 for “Font size”, 3.6 for “Font color”, 3.2 for “Webpage typesetting”, 3.2 for “Easy function keys”, 3.6 for “Page color combination”, 3.2 for “Keyword search”, 3.2 for “Shopping cart”, 4 for “Purchase history”, 3.4 for “Bundle sale recommendations”, 2.6 for “Flexibil-ity of payment mechanism”, 3.6 for “Flexibil“Flexibil-ity of delivery mechanism”, 3.8 for “Product categorization”, 3.6 for “Comparison with similar products”, 3.4 for “Bookmarks of prod-ucts viewed”, 2.8 for “Refund/barter availability”, 3.8 for “Online customer support”, 3.6 for “Warranty/maintenance”, 3.4 for “Customer service line/email”, 3.6 for “Authenticity of pictures”, 3.8 for “Resizability”, 3.8 for “Security/privacy”, 4.6 for “Real-time informa-tion updates”, 3.2 for “member center”, 3.2 for “Completeness of product informainforma-tion”, 3.2 for “Explanations of all kinds of processes”, and 3.6 for “Q&A”. The satisfaction scores given for these 27 needs were all lower than those given for the other two representative shopping websites.
4.4.2. Satisfaction and important goals. The advantages and disadvantages of a shopping
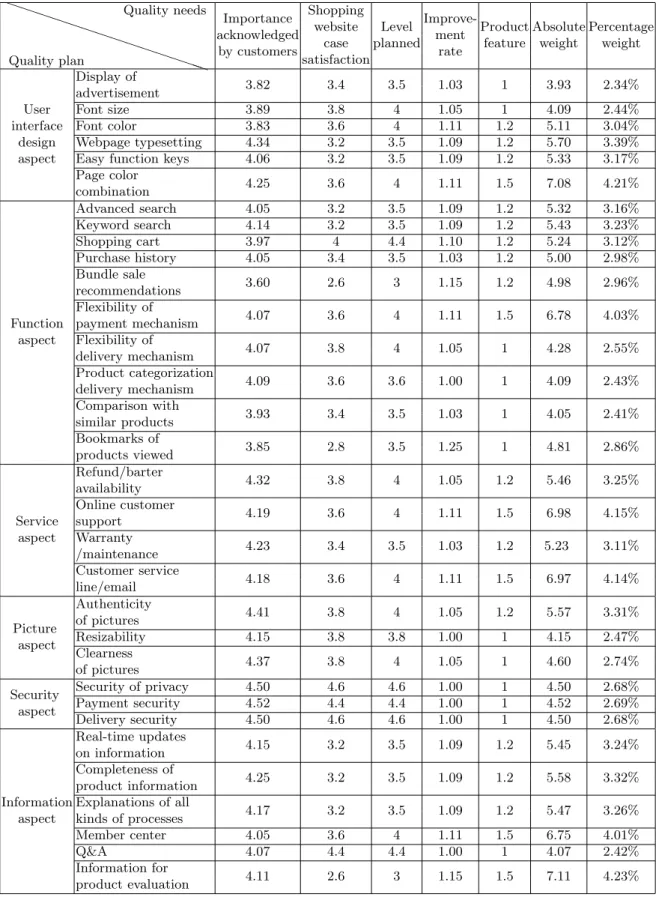
website case can be found through competitor analysis. In order to enhance their compet-itiveness in the market, the shopping website needs to assure that the level of quality is suited to meet customer needs. The quality plan for the shopping website in the case study is listed in table 6. A “Product feature” value of 1.5 means “important”, 1.2 represents “neutral”, and 1 represents “unimportant”.
The needs with high percentages in the quality plan are: “Information for product eval-uation” (4.23%), “Page color combination” (4.21%), “Online customer support” (4.15%), “Customer service line/email” (4.14%), “Flexibility of payment mechanism” (4.03%), and “Explanations of all kinds of processes” (4.01%). These six customer needs should be con-sidered as important indices and focus should be placed upon improving them to improve customer satisfaction. This is from the point of view of practical application. In other words, consumers value these needs. For example, there could be additional information provided for product evaluation for consumer reference; the color choices of the overall interface layout could be modified to make it easier for consumers to browse the website; online customer service or a customer service email address could be provided to deal with transaction-related problems; more flexible payment mechanisms could be offered considering consumer convenience. With all these improvements, the competitiveness of this website will definitely be greatly enhanced.
4.4.3. Importance of quality elements. It can be seen that the quality elements with the
top five percentages of importance are: “Alliance with banks or post offices” (5.84%), “Webpage layout” (5.70%), “Alliance with convenience stores” (5.60%), “Enhancement of password encryption” (5.15%), and “Bookmarks of products viewed by the customer” (4.90%). In other words, these are the key items that should be included when designing or improving websites.
5. Conclusions. This study focused on examination of the online shopping website. QFD techniques were applied in order to determine customer quality needs, deploy quality elements, identify the relationships between them, and make a plan for an online shopping
XXXXX
XXXXX
XXXXX
XXXXXXXX
Competitor analysis
Customer needs Shopping website
competitor satisfaction case PChome yahoo User Display of advertisement 3.4 4.2 3.8 interface Font size 3.8 4.2 4 design Font color 3.6 4.4 4 aspect Webpage typesetting 3.2 4.6 4.2
Easy function keys 3.2 4.4 3.8
Page color combination 3.6 4.4 4.4
Function
Searching 3.2 4.2 4.2
Shopping cart 3.2 4.2 4.8
Purchase history 4 4.4 4.4
Bundle sale recommendations 3.4 4.2 4.2
aspect
Flexibility of payment mechanism 2.6 4 3.6
Flexibility of delivery mechanism 3.6 4.6 4.4
Product categorization 3.8 4.8 4.6
Comparison with similar products 3.6 4.6 3.6
Bookmarks of products viewed 3.4 3.6 3.6
Service
Refund/barter availability 2.8 3.2 3.2
Online customer support 3.8 4.6 4.4
aspect Warranty/maintenance 3.6 4.2 4.4
Customer service line/email 3.4 4.2 4
Picture Authenticity of pictures 3.6 4.6 4.4
aspect Resizability 3.8 4.2 4.2
Clearness of pictures 3.8 3.2 3.8
Security Security of privacy 3.8 3.6 4.2
aspect Payment security 4.6 4.2 4.4
Delivery security 4.4 4.4 4.4
Information
Real-time updates on information 4.6 4.6 4.8
Completeness of product information 3.2 4 3.8
aspect
Explanations of all kinds of processes 3.2 3.8 4.4
Member center 3.2 3.8 4
Q&A 3.6 4 4.6
Information for product evaluation 4.4 4 4
Competitor analysis graph
• represents the case, N represents YAHOO and represents PCHOME
Table 6. Quality planning for the website case study PPPPPP PPPPPP PP Quality plan Quality needs Importance Shopping
Level Improve-Product Absolute Percentage
acknowledged website ment
by customers case planned rate feature weight weight satisfaction
Display of
3.82 3.4 3.5 1.03 1 3.93 2.34%
advertisement
User Font size 3.89 3.8 4 1.05 1 4.09 2.44%
interface Font color 3.83 3.6 4 1.11 1.2 5.11 3.04%
design Webpage typesetting 4.34 3.2 3.5 1.09 1.2 5.70 3.39%
aspect Easy function keys 4.06 3.2 3.5 1.09 1.2 5.33 3.17%
Page color 4.25 3.6 4 1.11 1.5 7.08 4.21% combination Advanced search 4.05 3.2 3.5 1.09 1.2 5.32 3.16% Keyword search 4.14 3.2 3.5 1.09 1.2 5.43 3.23% Shopping cart 3.97 4 4.4 1.10 1.2 5.24 3.12% Purchase history 4.05 3.4 3.5 1.03 1.2 5.00 2.98% Bundle sale 3.60 2.6 3 1.15 1.2 4.98 2.96% recommendations Flexibility of 4.07 3.6 4 1.11 1.5 6.78 4.03%
Function payment mechanism aspect Flexibility of 4.07 3.8 4 1.05 1 4.28 2.55% delivery mechanism Product categorization 4.09 3.6 3.6 1.00 1 4.09 2.43% delivery mechanism Comparison with 3.93 3.4 3.5 1.03 1 4.05 2.41% similar products Bookmarks of 3.85 2.8 3.5 1.25 1 4.81 2.86% products viewed Refund/barter 4.32 3.8 4 1.05 1.2 5.46 3.25% availability Online customer 4.19 3.6 4 1.11 1.5 6.98 4.15% Service support aspect Warranty 4.23 3.4 3.5 1.03 1.2 5.23 3.11% /maintenance Customer service 4.18 3.6 4 1.11 1.5 6.97 4.14% line/email Picture Authenticity 4.41 3.8 4 1.05 1.2 5.57 3.31% of pictures aspect Resizability 4.15 3.8 3.8 1.00 1 4.15 2.47% Clearness 4.37 3.8 4 1.05 1 4.60 2.74% of pictures
Security Security of privacy 4.50 4.6 4.6 1.00 1 4.50 2.68%
aspect Payment security 4.52 4.4 4.4 1.00 1 4.52 2.69%
Delivery security 4.50 4.6 4.6 1.00 1 4.50 2.68% Real-time updates 4.15 3.2 3.5 1.09 1.2 5.45 3.24% on information Completeness of 4.25 3.2 3.5 1.09 1.2 5.58 3.32% product information Information Explanations of all
4.17 3.2 3.5 1.09 1.2 5.47 3.26%
aspect kinds of processes
Member center 4.05 3.6 4 1.11 1.5 6.75 4.01%
Q&A 4.07 4.4 4.4 1.00 1 4.07 2.42%
Information for
4.11 2.6 3 1.15 1.5 7.11 4.23%
product evaluation
website. A case study was carried out. Through QFD, the key performance indices for the chosen online shopping website case were obtained.
(1) Customer need indices: The market survey shows that the top five customer needs (most important as determined by customers) are: “Payment security”, “Security of
Table 7. Quality element indexes corresponding to customer needs
Customer need Quality element
Advertisement display Graphic or animated display
Font size Distinction between title and content
Font color Background color and text color contrast
Webpage typesetting Webpage layout & Distinction between title
and content
Easy function keys Webpage layout & Iconization of tool bar items
Page color combination Background color and text color contrast
Advanced search Improve site search ability
Keyword search Improve site search ability
Shopping cart Auto-categorization of products selected
Purchase history Auto-categorization of products selected
Bundle sale recommendations Complementary products
Flexibility of payment mechanism Alliance with banks or post offices
Flexibility of delivery mechanism Alliance with convenient stores
Product categorization
Homogeneous products. Complementary products, Similar products and comparisons, and Product information standardization
Comparison with similar products Similar products and comparisons
Bookmarks of products viewed Bookmarks of products viewed by customers
Refund/barter availability Barter processing speed
Online customer support Reply speed & Service attitude
Warranty /maintenance Process standardization
Customer service line /email Reply speed
Authenticity of pictures Pictures provided by factories and stores
Resizability Resolution
Clearness of pictures Resolution
Security of privacy Enhancement of password encryption
Payment security Alliance with banks or post offices
Delivery security
Alliance with banks or post offices, Alliance with transportation companies, and Alliance with convenient stores
Real-time information updates Real-time property
Member center Database construction or upgrades
& Real-time property
Completeness of product information Product information standardization Explanations of all kinds of processes FAQ
Q&A FAQ
Information for product evaluation FAQ
privacy”, “Delivery security”, “Authenticity of pictures” and “Webpage typesetting”. These five needs should be taken into account to set up the planned target levels for the shopping website.
(2) Quality element indices: QFD data analysis shows that the five most important ele-ments are: “Alliance with banks or post offices”, “Webpage layout”, “Alliance with
convenience stores”, “Enhancement of password encryption” and “Bookmarks of prod-ucts viewed by customers”. These are the five elements that should be improved in order to achieve the planned target levels.
(3) Quality element indices corresponding to customer needs: The degrees of relation-ship between the 32 customer needs and the 29 quality elements were found through interviews with five website designers. The quality elements having the strongest relationships with customer needs are the important indices, listed in Table 7. (4) Indices for shopping website quality planning: Competitor satisfaction analysis shows
that the shopping website case beat its competitors in terms of satisfaction for “Clear-ness of pictures” and “Payment security”. Therefore, these two services provide ad-vantages for the shopping website. The other two representative shopping websites did better in terms of “Flexibility of payment mechanism”. Therefore, the shopping website should consider this as a key improvement in future plans. It is believed that the proposed shopping model can provide academics and online marketers a reference for management. Moreover, the advanced study on web site design can be referred in [23-26].
Acknowledgment. The authors would like to thank the National Science Council for their financial support of this research under Contract Nos. NSC 98-2221-E-366-003 and NSC 98-2221-E-366-006-MY2. The authors are also most grateful for the kind assistance of Prof. Yan Shi, Executive Editor of IJICIC, and for the constructive suggestions from the anonymous reviewers, all of which has led to the making of several corrections and have greatly aided us to improve the presentation of this paper.
REFERENCES
[1] H. Y. Chen, Development Trends of the US Internet Shopping Market, Institute for Information Industry, Market Intelligence Center, 2005.
[2] H. Y. Chen, Development Trends of the Western Europe Internet Shopping Market, Institute for Information Industry, Market Intelligence Center, 2005.
[3] W. Q. Chou, Analysis on the Development of the Taiwan Internet Shopping Market in 2006-2007, Institute for Information Industry, Market Intelligence Center, 2007.
[4] H. M. Kuo, Discussion of the interfering factors for internet shopping, 2006 Conference on Theories and Practices in International Business, Chang Jung Christian University, pp.52, 2006.
[5] Easter Online, Factors Influencing the Behavior of Electronic Shopping, E-ICP Eastern Integrated Consumer Profile, http://www.bnext.com.tw/StoreView 568, 2008.
[6] Y. L. Yu, Y. F. Chung and T. S. Chen, Electronic signatures for long-term storage purpose in elec-tronic anamnesis,International Journal of Innovative Computing, Information and Control, vol.4, no.11, pp.3047-3058, 2008.
[7] D. B. Bracewell, J. Yan and F. Ren, Single document keyword extraction for Internet news articles,
International Journal of Innovative Computing, Information and Control, vol.4, no.4, pp.905-913, 2008.
[8] P. Y. Chang, III predicted the growth rate of internet shopping in 2008 would stand at 36%,Electronic Commerce Times, http://www.ectimes.org.tw/shownews.aspx?id=9875.
[9] J. W. Palmer, Website usability, design, and performance metrics, Information Systems Research, vol.13, no.2, pp.151-167, 2002.
[10] Y. H. Wu, How shopping websites retain their customers,Electronic Commerce Times, http://www. ectimes.org.tw/, 2006.
[11] H. Y. Chen and S. L. Chou, 2005 Analysis on Taiwan Internet User Behavior, Institute for Infor-mation Industry, Market Intelligence Center, 2005.
[12] W. Q. Chou, The State and Trend of B2C Consumer Behavior in Taiwan in 2006, Institute for Information Industry, Market Intelligence Center, 2007.
[13] A Survey on 2007 B2C e-Store Operatin, 2007 Legal Construction of E-commerce and Infrastructure Construction Plan, Institute for Information Industry, 2007.
[14] C. Y. Zhan and W. Q. Chou,Analysis on the Internet Shopping Behavior of Internet Users in UK, Institute for Information Industry, Market Intelligence Center, 2008.
[15] L. Zhao, M. Liu and L. Qu, Disruption coordination of closed-loop supply chain network (II) – Analysis and simulations,International Journal of Innovative Computing, Information and Control, vol.5, no.2, pp.511-520, 2009.
[16] H. Hama, T. T. Zin and P. Tin, A hybrid ranking of link and popularity for novel search engine,
International Journal of Innovative Computing, Information and Control, vol.5, no.11, pp.4041-4049, 2009.
[17] B. Li and C. Yang, Production logistics system based on a hybrid push/pull control strategy in make-to-order environments, International Journal of Innovative Computing, Information and Control, vol.5, no.5, pp.1343-1350, 2009.
[18] M. K. O. Lee,A Comprehensive Model of Internet Consumer Satisfaction, City University of Hong Kong, unpublished working paper, 1999.
[19] S. J. Hsieh and Y. F. Huang, A study for the effect of service quality and trust perception to customer’s loyalty on on-line auction, Journal of Information Management, vol.7, no.2, pp.91-112, 2005.
[20] X. F. Lin and S. M. Lin, The impact of website quality dimensions on customer satisfaction,Journal of ST. John’s & ST. Mary’s Institute of Technology, no.23, 2006.
[21] H. X. Wang, Z. Du and P. J. Tsai, Using quality function deployment in the study of service quality of taipei rapid transit system,Conference on Technology and Applications of Quality and Management for Twenty-First Century, 2000.
[22] Japan Management Association, KJ Method – Application and Practice, 3rd Edition, Tsing Hua Management Science Book Series, Taipei, 1988.
[23] H. M. Lee, C. W. Wang and J. S. Su, Applying self-organization map to prevent the shill bidding in online auctions,International Journal of Innovative Computing, Information and Control, vol.6, no.3, pp.1141-1150, 2010.
[24] H. M. Kuo, C. W. Chen and C. W. Chen, A behavioral model of the elderly internet consumer: A case study, International Journal of Innovative Computing, Information and Control, vol.6, no.8, pp.3507-3518, 2010.
[25] K. H. Chung, C. S. Ko, Y. M. Hwang, et al., Network design for strategic alliance in express courier services: A fuzzy set approach, International Journal of Innovative Computing, Information and Control, vol.6, no.1, pp.349-359, 2010.
[26] S. M. H. Motlagh, M. M. Sepehri, J. Ignatius, et al., Optimizing trade in transportation procure-ment: Is combinatorial double auction approach truly better?, International Journal of Innovative Computing, Information and Control, vol.6, no.6, pp.2537-2550, 2010.