A Guide to
Integrated Management of
Productivity Activities (IMPACT)
Published by SPRING Singapore 1 Fusionopolis Walk, #01-02 South Tower, Solaris Singapore 138628 Tel : +65 6278 6666 Fax : +65 6278 6667 www.spring.gov.sg © SPRING Singapore 2011 All rights reserved.
No part of this publication should be reproduced, stored in a retrieval system, or transmitted, in any form or by any means, electronic, mechanical, photocopying or otherwise, without prior permission of the copyright holders.
Whilst every effort has been made to ensure that the information contained herein is comprehensive and accurate, SPRING Singapore will not accept any liability for omissions or errors.
CONTENTS
1. INTRODUCTION
2. BASIC PRODUCTIVITY CONCEPTS
3. THE IMPACT FRAMEWORK
4. CONCLUSION
ANNEX A
Scope of Work of a
Productivity Manager
ANNEX B
Key Productivity Indicators
ANNEX C
IMPACT Assessment
3 4 8 19 20 22 24
Productivity management is a
maze of confusion to those who
embark on it haphazardly.
But it is a grid with boundless
possibilities to those who engage
INTRODUCTION
Productivity plays an important role in the generation of Singapore’s wealth by ensuring effective and efficient use of resources. In the light of globalisation, limited resources and increasing competition from emerging economies, it is important that Singapore sustains its economic growth through productivity gains.
The same applies to organisations. Successful productivity management is key to their survival in today’s highly competitive environment. An organisation’s productivity can be effectively raised only if it is managed in a holistic manner. Productivity management is a journey of continuous improvements involving employees at all levels.
This guide aims to help you manage your organisation’s productivity systematically through an Integrated Management of Productivity Activities (IMPACT) framework. The IMPACT framework includes the key productivity levers to address when you embark on productivity improvement initiatives. It can be used by everyone involved in the productivity management process – senior management, productivity managers, and line managers in specific functions such as human resource development and quality control.
The IMPACT framework can help to increase your organisation’s productivity performance in the long run.
What is Productivity?
Productivity is defined as the relationship between the quantity of output and the quantity of input used to generate that output:
PRODUCTIVITY =
Productivity is not just about doing things more efficiently by “doing things right”, it is also about achieving maximum effectiveness by “doing the right things”.
PRODUCTIVITY =
Thus, higher productivity can be achieved through efficient and effective use of resources such as labour, capital and materials in the production of various goods and services.
Productivity Indicators
Productivity can be measured across various levels (e.g. national, industry, organisation and operational) and different sectors (e.g. manufacturing and services).
Figure 2.1 shows the common productivity indicators used at the various levels.
BASIC PRODUCTIVITY CONCEPTS
DOING THE RIGHT THINGS DOING THINGS RIGHT + + EFFECTIVENESS OUTPUT INPUT EFFICIENCY
Figure 2.1 : Common Productivity Indicators
National Level
Operational Level Industry / Organisation Level
Gross Domestic Product (GDP) per worker Value added per worker
Physical indicators
(e.g. number of customers served per worker)
Output
At the operational level, where goods or services are homogeneous, output is measured in physical units (e.g. number of goods produced).
At the industry and organisation levels, output is commonly measured by value added. At the national level, output is measured by GDP, which is the total value added for the economy.
Input
Inputs are the resources used to produce output. The most common inputs are labour and capital.
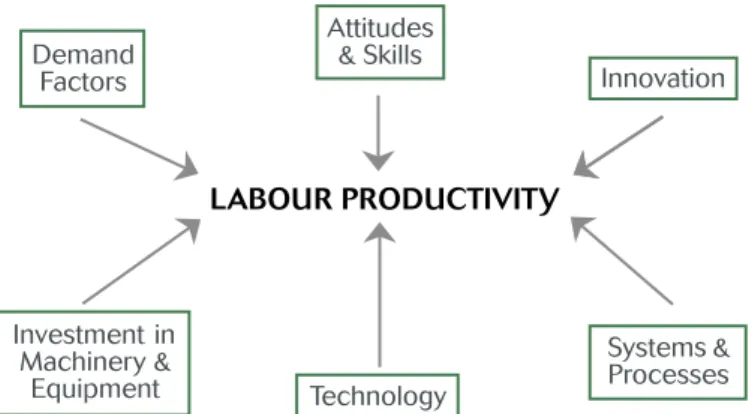
Labour Productivity
Labour productivity, defined as value added per worker, is the most common measure of productivity. This measure reflects the efficiency and effectiveness of labour in the production and sale of the output. It is determined by the attitudes and skills of workers, and other factors that affect both output and input (see Figure 2.2).
BASIC PRODUCTIVITY CONCEPTS
Value added per worker
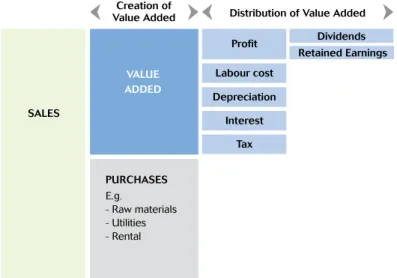
Concept of Value Added
Value added is commonly used in measures of an organisation’s productivity, as it represents the wealth created through its production process or provision of services. It measures the difference between sales and the cost of materials and services incurred to generate the sales:
Subtraction Method
VALUE ADDED = SALES - COST OF PURCHASED GOODS & SERVICES
Since the wealth is generated by the combined efforts of those who work in the organisation (employees) and those who provide the capital (employers and investors), it must therefore be distributed among them.
Value added is thus distributed as wages to employees, depreciation for reinvestment in machinery and equipment, interest to lenders of money, dividends to investors, and profits to the organisation:
Addition Method
VALUE ADDED =LABOUR COST + DEPRECIATION + INTEREST + PROFIT + OTHER DISTRIBUTED COSTS (e.g. TAX)
From the diagram, you will see that value added can be computed easily from your organisation’s profit and loss statement. A separate data collection system for the computation of value added is therefore not necessary.
SALES
VALUE ADDED
Profit Creation of
Value Added Distribution of Value Added Dividends Retained Earnings Labour cost Depreciation Interest Tax PURCHASES E.g. - Raw materials - Utilities - Rental
Figure 2.3: Creation and Distribution of Value Added
2 Basic Productivity Concepts
Figure 2.3 shows that the creation of value added and its distribution are two sides of the same equation. It also emphasises the point that the computation of value added using either the Subtraction Method or the Addition Method will give the same result.
THE IMPACT FRAMEWORK
Overview
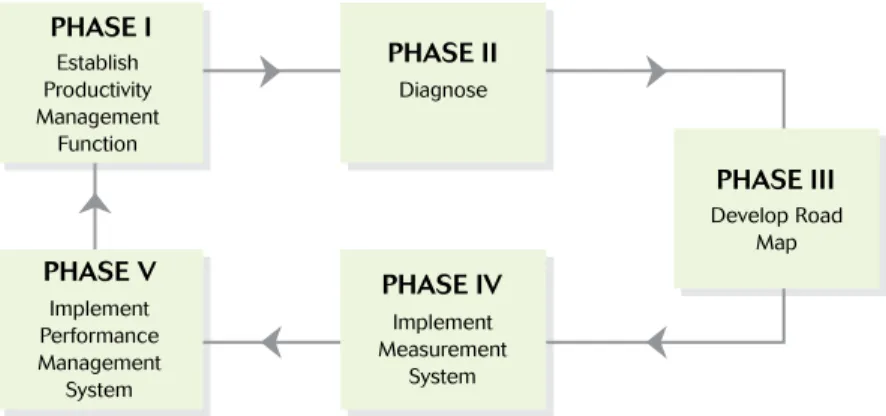
The Integrated Management of Productivity Activities (IMPACT) framework is designed to help you manage your organisation’s productivity in a systematic manner. It includes the key productivity levers to address as you embark on productivity improvement initiatives. Figure 3.1 shows an overview of the IMPACT framework and the critical actions within the framework. Some of the actions could take place simultaneously.
Figure 3.1: IMPACT Framework
Implement Measurement System Implement Performance Management System Establish Productivity Management Function PHASE I PHASE II PHASE III PHASE V PHASE IV Diagnose Develop Road Map
3
Phase I – Establish Productivity Management Function
Step 1 Establish A Productivity Management Structure
Good management of productivity requires commitment and focus from top management. A dedicated organisational structure must be set up to facilitate the productivity improvement effort. Depending on your organisation’s needs, size and characteristics, this structure may take the form of:
a productivity management unit, headed by a Productivity Manager who reports directly to senior management; or
a cross-functional team comprising productivity coordinators appointed from the various operational units.
The typical scope of work of a Productivity Manager is described in Annex A. This scope may be modified depending on the structure and complexity of the productivity management function within your organisation.
Step 2 Set Overall Productivity Goals
The next step is to set productivity goals that are in line with and integrated into your organisation’s long-term strategic plans.
To ensure that these goals are met, key performance indicators and targets need to be identified and developed. The organisation’s productivity performance can be monitored against these targets.
Step 3 Garner Participation and Commitment
A harmonious and open corporate culture is essential to continuous productivity improvement. This can be achieved through the following:
Commitment from Top Management
Top management set the direction of an organisation. For any productivity plan to succeed, senior leadership must be fully committed to the cause.
This commitment can be expressed through direct communication with employees on your productivity goals and strategies, as well as allocation of resources for productivity improvement. A senior employee could also be put in charge of the organisation’s productivity efforts.
Communication and Creation of Awareness
Employees must have a clear understanding of productivity concepts, the organisation’s productivity goals and how these goals will benefit them as well as the organisation. They then need to be armed with the right tools to improve their productivity and know how they can play a part in the productivity journey.
It is, therefore, important to set up open communication channels between departments, staff and management to facilitate exchange of ideas and information, create trust and engage employees.
Mobilisation of Employees
Employees should be involved in each stage of the productivity effort — from the setting of targets and development of initiatives, to the measurement and management of productivity performance. Their involvement helps to foster commitment and provides them with a sense of ownership.
Phase II – Diagnose
For any productivity intervention to be effective, you should have a thorough understanding of your organisation’s current situation. This can be done through a productivity diagnosis to assess your organisation’s “state of health”, pinpoint its strengths and weaknesses, and recommend areas for improvement.
A productivity diagnosis covers:
A qualitative assessment of your organisation’s performance in relation to the productivity levers.
A quantitative assessment of your organisation’s performance based on certain key indicators that are linked to the various productivity levers.
These assessments are undertaken specifically to:
Measure the gap between the current situation and the productivity goals set by your organisation.
Identify your organisation’s strengths and weaknesses.
Determine the underlying causes of the gaps (for the weak areas). Determine areas for improvement.
Qualitative Assessment of Performance
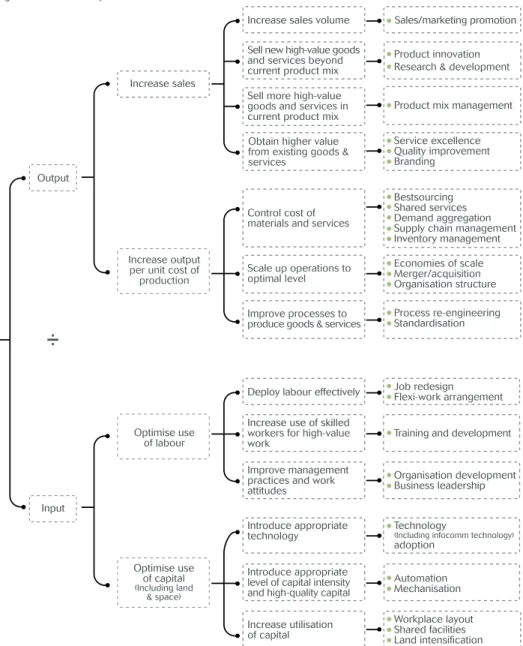
Figure 3.2 shows the key levers that affect productivity. These levers are areas or actions that your organisation can focus on to improve productivity significantly.
Productivity levers do not operate in silos. Improvements made to one lever require complementary actions on some other levers, for it to be effective. For example, the adoption of new technology inevitably requires the complementary actions of training of employees and redesign of work processes. Similarly, weakness in one lever is likely to have an adverse effect on other levers.
Quantitative Assessment of Performance
There are 10 common indicators used to gauge an organisation’s productivity performance: Labour productivity
Sales per employee Value added-to-sales ratio Capital productivity Sales per dollar of capital Capital intensity
Labour cost competitiveness Labour cost per employee Profit-to-value added ratio Profit margin
Annex B provides details of these indicators and their relationships with one another. While these indicators may provide a good analysis of your organisation’s overall performance, you should also measure the performance of the operational units and functions. Such measurements are further discussed in Phase IV.
Productivity Diagnostic Tool
Annex C provides an example of a simple diagnostic tool that allows you to conduct qualitative and quantitative assessments for your organisation. The findings from both assessments should be taken in totality before you decide on the course of action to pursue.
Phase III – Develop Road Map
After the diagnosis is completed, you will develop a productivity road map or action plan based on the findings obtained. The road map helps to direct specific activities towards your productivity goals in a coordinated and systematic manner.
Components of Productivity Road Map A productivity road map addresses the following:
What affects productivity?
Identify the specific actions that need to be taken in relation to the findings from the diagnosis.
Spell out the key performance indicators, targets and deliverables for the actions to be taken.
Who affects productivity?
Identify the units or individuals who will carry out the actions. Assign responsibilities and accountabilities to the parties identified.
When are the activities to be undertaken?
Set milestones and timelines for the actions to be taken.
The actions should then be taken and monitored according to the road map. Template for Productivity Road Map
You can use various templates to draw up your productivity road map. An example is shown in Figure 3.3.
Key Performance
Indicator PerformanceCurrent DeliverableTarget / ProgrammeStrategy &
Timeline Milestone Deadline • Average daily seat turnover (number of times a seat is used by different individuals in a day) • Preparation time per meal • Waiting time (time taken before an order is filled) per meal served • 6 • 15minutes • 20minutes • 8 • 8minutes • 10minutes 1. Explore electronic ordering systems • Review ordering process • Explore different electronic ordering systems • Submit recommendations • November 2010 • November 2010 • December 2010 2. Implement 5S to reduce waste and standardise procedures • Review food preparation processes • Identify areas for
improvement • Propose changes • November 2010 • November 2010 • December 2010 3. Implement customer service improvement programme • Conduct customer satisfaction survey • Conduct mystery audit • December 2010 • January 2011
Productivity Lever Improve processes to produce goods and services
Goal Reduce time taken to serve a customer
Departments-in-charge Lead: Operations Department Supported by:
• Kitchen Department
• Human Resources Department • IT Department
Phase IV – Implement Measurement System
Importance of Productivity Measures
Productivity improvement initiatives must be complemented by a sound measurement system, which forms an integral part of an organisation’s management information system. Productivity measures can be used to:
Evaluate the effectiveness of action plans Monitor performance
Set targets and formulate strategies
Account to various stakeholders – customers, investors, employees, suppliers and funding agencies
Link effort and reward for employees Productivity Measurement
Since productivity is the relationship between output and the input used to produce that output, there are various ratios you can use to measure the performance of different operational units within your organisation. By adopting an integrated approach to productivity measurement, you can learn how each of your departments affects your organisation’s overall performance.
Figure 3.4 shows an example of a family of interlinked measures used by a restaurant. Key management indicators at the top are broad indicators that provide management with information related to productivity and profitability. They are then broken down into activity indicators and operational indicators.
Activity indicators provide a snapshot of costs, activity levels and resource utilisation rates, which are particularly useful for middle and higher management.
Operational indicators are usually physical ratios that address the operational aspects that need to be monitored and controlled.
Figure 3.4: Example of an Integrated Approach to Productivity Measurement
You should consider the following points in selecting productivity ratios:
Ratios should measure something significant.
Only elements that have an important impact on the business performance should be measured.
Ratios should be meaningful and action-oriented.
Ratios used must be relevant to the objectives and operations of your organisation. They should explain the pattern of performance and preferably signal a course of action.
Component parts of the ratios should be reasonably related.
The numerator and the denominator should correspond with each other. For example, it would not be appropriate to relate sales with the number of employees in the human resources department as they are not directly responsible for sales.
Phase V – Implement Performance Management System
Productivity measurement tells an organisation how it is performing and why, and what it should do in view of its performance. The next step is to use these measures to manage productivity performance.
Performance management covers two main areas: (a) activities to monitor performance; and (b) activities to reinforce performance and motivate employees.
Activities to Monitor Performance
Productivity Level and Growth
An organisation’s productivity performance can be monitored in terms of the productivity level measured by the various productivity ratios, or the change in productivity level over time. Productivity levelrepresents the efficiency and effectiveness of resource utilisation achieved at a given point in time. Comparison of productivity levels must be made between similar entities. For example, the management of a restaurant chain may compare the labour productivity of outlet A against that of outlet B.
The change in productivity level over time is expressed as a percentage. It indicates dynamism and the potential for achieving higher productivity levels. An organisation with a consistently high productivity growth rate may overtake another with a negative growth rate, even if its current productivity level is lower.
Comparison of Performance
To know how well your organisation fares in your productivity efforts, a comparison of your organisation’s performance against some standard has to be made. This can be done across time and space, with external entities (e.g. benchmarks and organisations within the same industry) and within the organisation (e.g. between departments). Such comparisons provide valuable information on your organisation’s relative standing vis-à-vis your competitors and the best-in-class performers.
Organisations who want to assess themselves against their competitors can use the Inter-firm Comparison (IFC)tool. IFC studies involve comparing productivity ratios of organisations in the same industry. Their identities are kept confidential.
Within the organisation, comparisons can be made against its productivity goals and targets to evaluate the effectiveness of the productivity efforts; and against its past performance for trend analysis. Comparisons can also be made across different operational units and different employees for performance appraisals.
Review and Feedback Mechanism
Information on any organisation’s productivity performance is rendered useless if it does not lead to further improvements. It is therefore important to put in place a review and feedback mechanism to gather valuable information for strategic planning and training purposes. The information should be made readily available to all employees to improve the performance of the organisation or the unit that they are in.
Activities to Reinforce Performance and Motivate Employees
To sustain the productivity drive, a clear link between rewards and achievements must be established. The wealth generated by the organisation should be distributed back to those who have contributed to the production process.
Productivity incentive schemes can take different forms:
Recognition Schemes
Awards can be given out to individuals or teams to encourage continuous productivity improvements.
Productivity Gain-Sharing Schemes
The value added created by the organisation is shared with employees, based on a formula agreed upon by both management and employees.
Staff Performance Appraisal Linked to Productivity Improvements
Employees’ contributions to productivity efforts are recognised in their performance appraisals. Good performers should be rewarded with higher bonuses or salary increments.
Productivity incentive schemes can shape employees’ behaviour and align their objectives with those of the organisation. Employees should have a clear understanding of how they are being appraised and the kind of performance that is recognised by management.
4
In 6th Century BC, Sun Tzu, a Chinese military strategist and author of The Art of War, wrote: “Know thy self, know thy enemy. A hundred battles, a hundred victories.”
This guide helps you to know your organisation better and to know how it stands in relation to others. There is no guarantee that your organisation will have a hundred victories after going through a hundred battles. However, use of the IMPACT framework and regular assessment of performance should stand the organisation in good stead against the competition. Since this guide is intended as a first-level help to any organisation that wants to embark on the productivity journey, it has introduced the various concepts, frameworks and tools at a generic level. Those who want to delve deeper into the productivity issue will have to consider the relevant industry- and enterprise-specific factors that impinge on their performance.
Nevertheless, the key message about the need for an integrated approach to the management of productivity activities remains unchanged.
Conclusion
CONCLUSION
The duties of a productivity manager include planning, coordinating, controlling and monitoring of productivity programmes within an organisation. The productivity manager is also responsible for getting cooperation from all management levels to achieve the productivity goals and objectives that have been set.
Attributes of a Productivity Manager Knowledge
• Well-versed in productivity concepts, frameworks and tools
• Prior knowledge or relevant experience in the organisation’s sector of work Abilities & skills
• Good people management and negotiation skills
• Strategic view of the organisation’s productivity objectives Key Responsibilities of a Productivity Manager
• Establish productivity management structure, responsibilities and accountabilities • Mobilise employees to participate in the productivity drive
• Manage and facilitate actions taken to improve productivity
• Establish productivity measurement system and performance management system Establish structure, responsibilities and accountabilities
• Review current reporting structure and assess if it is suitable for productivity management accountability
• Assess need for a productivity management committee or unit within the organisation • Establish productivity accountability at different management levels
• Decide process of setting overall productivity goals Mobilise employees
• Educate employees on:
i. Meaning and scope of productivity, its benefits and how it can be improved and measured
ii. Role of every employee and how to adopt a positive mindset towards productivity initiatives
Scope of Work of a Productivity Manager
• Communicate to employees on:
i. Organisational objectives in productivity
ii. Organisation’s targets and overall direction and strategy to achieve its productivity objectives
• Involve employees at different levels in the productivity drive by:
i. Engaging them throughout the whole productivity journey - planning, development of measures and implementation of initiatives
ii. Showing them the impact of their efforts in improving productivity and the consequent benefits
Manage and facilitate productivity improvements • Diagnose
i. Assess performance in relation to the key productivity levers ii. Identify areas for improvement and productivity levers to address • Develop road map
i. Work out action plan to address findings from diagnosis ii. Set targets and assign responsibilities
iii. Monitor progress of actions taken
Establish productivity measurement system and performance management system • Identify and implement measures to track productivity performance against targets and benchmarks
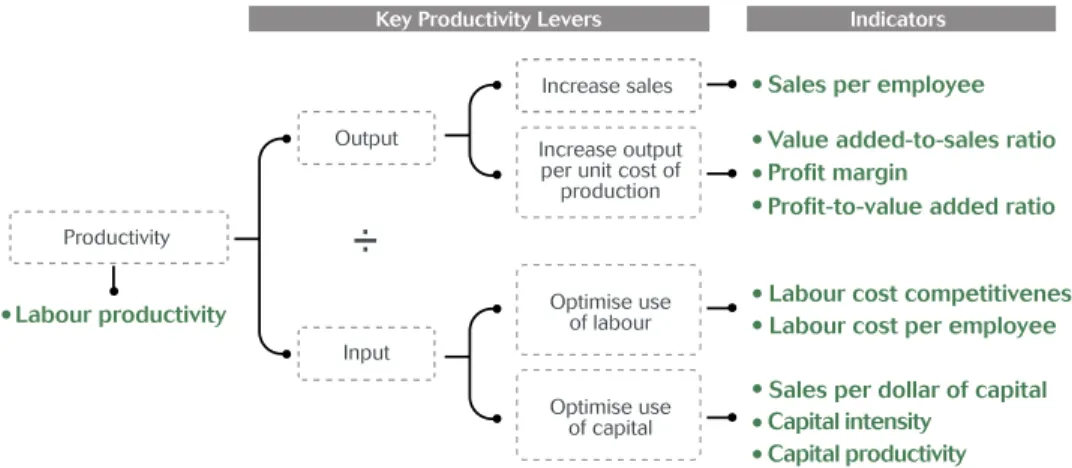
Some key productivity indicators are commonly used to diagnose an organisation’s productivity performance, from the angles of both creation and distribution of value added, and to compare it against other organisations. These indicators are shown in Figure 1. Figure 1: Key Productivity Indicators
Key Productivity Indicators
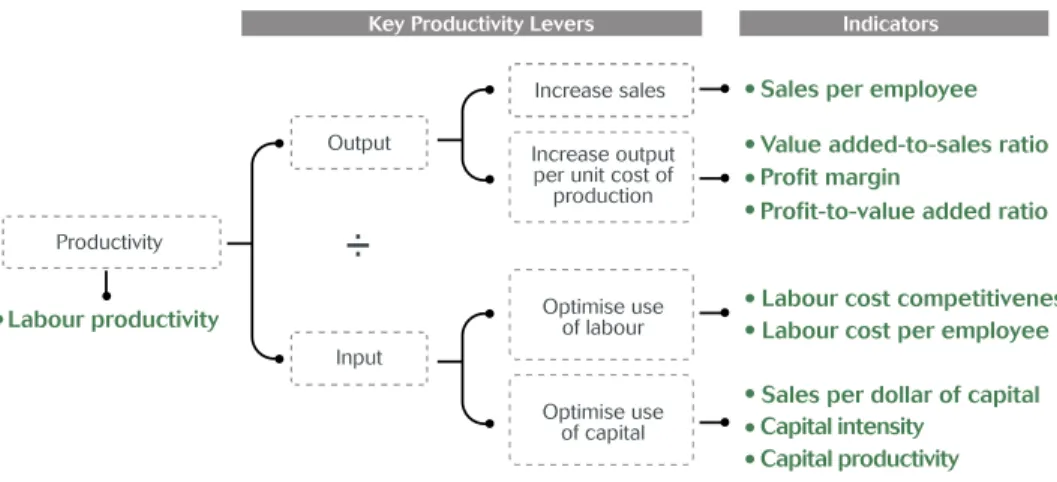
Figure 2 shows how the key productivity indicators are linked to the key productivity levers. Figure 2: Indicators of Organisation’s Performance in Relation to the Key Productivity Levers
The definitions and significance of the indicators are summarised below.
Indicator What it measures
A ) Productivity
1. Labour productivity Efficiency and effectiveness of employees in the generation of value added B ) Increase sales
2. Sales per employee Efficiency and effectiveness of marketing strategy C ) Increase output per unit cost of production
3. Value added-to-sales ratio
Proportion of sales created by the organisation over and above purchased materials and services
4. Profit margin Proportion of sales left to the organisation after deducting all costs 5. Profit-to-value added
ratio
Operating profit allocated to the providers of capital as a proportion of value added
D ) Optimise use of labour 6. Labour cost
competitiveness Efficiency and effectiveness of the organisation in terms of its labour cost 7. Labour cost per
employee
Average remuneration per employee E ) Optimise use of capital
8. Sales per dollar of capital
Efficiency and effectiveness of fixed assets in the generation of sales 9. Capital intensity Extent to which the organisation is capital-intensive
This IMPACT assessment is used as a first-level diagnosis of an organisation’s productivity performance. The diagram below shows that an organisation’s productivity performance is dependent on key productivity levers, supported by an integrated management of productivity activities. This assessment helps to gauge the effectiveness of the organisation’s productivity management function, identify the key productivity levers to address and recommend areas for improvement.
Parts of Assessment
There are three parts to this assessment:
Part I: Qualitative assessment of the organisation’s productivity management function and productivity levers.
Part II: Quantitative assessment of the organisation’s productivity performance based on the key productivity indicators.
Part III: Overall assessment and recommendations based on the findings from Parts I and II. Part II: Quantitative Assessment Part I: Qualitative Assessment
PR
O
D
U
CTIVIT
Y
IMPACT Assessment
ANNEX C
Section 1 assesses the effectiveness of your organisation’s productivity management function, and Section 2 evaluates its productivity levers.
Section 1 : Productivity Management
On a scale of 0 to 4 (0 = not at all, 4 = to a great extent), rate the statements below to reflect the current state of productivity management in your organisation. Add the score obtained for each area of the productivity management function.
A. Establish Productivity Management Function
1. There is a productivity management function / clear accountability for productivity (e.g. productivity manager)
2. Productivity improvement goals are set for the organisation
Total =
B. Diagnose
3. Key factors that affect output (production and sales) and use of resources, as well as their inter-linkages, are identified
4. A productivity diagnosis is undertaken to identify areas for
improvement
Total =
C. Develop Road Map
5. There is an overall productivity plan, which is integrated into the strategic plan
6. There are specific action plans implemented to improve productivity
Total =
Qualitative Assessment of Productivity Management Function and Key Productivity Levers
PART I
D. Implement Productivity Measurement & Performance Management Systems
7. There is a system to measure productivity at various levels 8. Benchmarks/best-in-class performance are identified 9. Targets are set for key productivity measures
10. Productivity performance at various levels is monitored 11. Productivity audits are performed
12. Staff performance appraisals are aligned to productivity achievements 13. There is an employee incentive scheme that is linked to productivity
achievements
Total =
Score
Section 2 : Current State in Addressing Key Productivity Levers
On a scale of 0 to 4 (0 = not at all, 4 = to a great extent), rate the statements below to reflect the current state in addressing key productivity levers in your organisation. Indicate NA if the statement does not apply or if you do not know the answer.
Add the score obtained for each productivity lever. OUTPUT
A. Increase Sales
a. Increase sales volume i. Set stretch and challenging sales growth targets
ii. Implement a marketing strategy to increase sales
b. Sell new high-value goods and services beyond current product mix
i. Conduct market research on potential new goods/services ii. Carry out product development plan
c. Sell more high-value goods and services in current product mix i. Identify clear market segments for products in current product mix,
and the needs of these segments ii. Explore different product mix
d. Obtain higher value from existing goods and services
i. Focus on service excellence/product quality improvements ii. Engage in branding for products
B. Increase Output Per Unit Cost of Production
a. Control cost of materials and services
i. Engage in best sourcing practices
ii. Explore shared services and/or demand aggregation
iii. Engage in supply chain management and inventory management
b. Scale up operations to optimal level i. Identify and implement measures to reach optimal level of operations
to achieve economies of scale
ii. Explore possibilities to achieve an optimal organisation structure
c. Improve processes to produce goods and services i. Implement measures to maximise output with given resources
ii. Implement measures to reduce the amount and cost of resources / inputs used to produce the output
iii. Streamline business/work processes
Total =
INPUT
C. Optimise Use of Labour
a. Deploy labour effectively
i. Engage in job redesign
ii. Implement real-time labour redeployment to meet demand fluctuations iii. Create flexi-work arrangement
b. Increase use of skilled workers for high-value work i. Analyse manpower requirements (i.e. need for skilled or unskilled
workers) in business decisions ii. Upgrade skills of workforce
c. Improve management practices and work attitudes i. Implement best-in-class management practices
ii. Communicate productivity goals to employees iii. Assess work attitudes
iv. Assess management practices
Total =
Score Score
D. Optimise Use of Capital (including land and space)
a. Introduce appropriate technology i. Keep abreast of technology developments
ii. Review state of technology in the organisation
b. Introduce appropriate level of capital intensity and high-quality capital i. Mechanise and automate processes where possible
ii. Review effectiveness of capital equipment in various processes
c. Increase utilisation of capital i. Set stretch/challenging targets for capital utilisation rates and
track achievements
ii. Implement a strategy to effect high level of capital utilisation
d. Optimise use of space i. Review space utilisation in relation to business volume and execute
an optimisation plan
ii. Consider shared facilities
Total =
SCORING
Fill in the score obtained for each area of assessment, and compute the percentage of the score obtained out of the maximum score.
Section 1 Productivity Management
Area of Assessment Maximum
Score Score %
(a) (b) [(b) ÷ (a)] x
100%
A. Establish Productivity Management Function 8
B. Diagnose 8
C. Develop Road Map 8
D. Implement Productivity Measurement and Performance Management Systems
28 Total for Section 1 52
Section 2 Current State in Addressing Key Productivity Levers
Area of Assessment Total No. of Statements
No. of Statements
with “NA”
Maximum Score Score %
(c) (d) (e) = [(c) – (d)] x 4 (f) [(f) ÷ (e)] x 100% Output
A. Increase Sales 8 B. Increase Output per
Unit Cost of Production 8 Input
C. Optimise Use of Labour 9 D. Optimise Use of Capital (including land / space) 8
Total for Section 2 Total for Section 1 + Section 2
> 70% Relatively strong in productivity management and improvement efforts. 30% – 70% Equipped with the fundamentals required to manage productivity. < 30% Weak in productivity management and improvement efforts.
Section 1 shows the calculation of value added. Section 2 shows the computation and evaluation of the key productivity indicators based on the figures provided in Section 1. The following information is required to complete the assessment:
Financial statements (profit and loss statements, and balance sheets) Number of employees
Section 1 : Calculation of Value Added
There are two methods to calculate value added - (a) the subtraction method and (b) the addition method. Either one of them can be used to compute value added using the templates provided in Section 1-A (subtraction method) and Section 1-B (addition method). A summary of the two methods is given below.
Subtraction Method
VALUE ADDED = SALES - COST OF PURCHASED GOODS AND SERVICES
Addition Method
Fill in the template with financial information over a 3-year period. The types of income or expenditure can vary, depending on your organisation’s operations. Compute the value added for each year using the formula stated in the template.
Quantitative Assessment of Productivity Performance Based On Key Productivity Indicators
PART II
VALUE ADDED =LABOUR COST + DEPRECIATION + INTEREST + PROFIT + OTHER DISTRIBUTED COSTS (e.g. TAX)
Section 1-A Calculation of Value Added Using the Subtraction Method
S/No. Item Formula Year 1 Year 2 Year 3
$ $ $
1 REVENUE
2 Less: Opening Stocks of Finished Goods
3 Add: Closing Stocks of Finished Goods
4 Gross Output 1-2+3
PURCHASED MATERIALS AND SERVICES Materials Used
5 Direct raw material
6 Indirect raw material
7 Stock obsolescence
8 Others
9 Sub-Total (Materials Used) add 5 to 8
Production Expenses
10 Freight and handling
11 Casual labour
12 Insurance (excl insurance for employees)
13 Transport charges
14 Utilities
15 Maintenance of factory building
16 Maintenance of plant and machinery
17 Hire of plant and machinery
18 Others
19 Sub-Total (Production Expenses) add 10 to 18
Administrative & General Expenses 20 Printing, stationery & office supplies
21 Insurance (excl insurance for employees)
22 Rental
23 Transport charges
24 Company vehicle expenses
25 Advertising
26 Entertainment
27 Refreshment
28 Fax and telephone charges
29 Courier and postage charges
30 Maintenance of office equipment
31 Travelling expenses
32 Audit, secretarial & professional fee
33 Newspapers and periodicals
34 Stamp duty, filing & legal charges
35 Bank charges
36 Others
37 Sub-Total (Admin & General Expenses) add 20 to 36
38 Total Purchased Materials and Services 9+19+37
39 VALUE ADDED 4 - 38
ANNEX C IMPACT Assessment
Section 1-B Calculation of Value Added Using the Addition Method
S/No. Item Formula Year 1 Year 2 Year 3
$ $ $
OPERATING PROFIT/(LOSS)
1 Profit/(Loss) Before Income Tax
Less: Non-operating income
2 Profit on Sale of Fixed Assets
3 Gain on Foreign Exchange
4 Other Income
Add: Non-operating expenses
5 Bad Debts
6 Donations
7 Loss on Foreign Exchange
8 Loss on Sale of Fixed Assets
9 Others
10 Total Operating Profit/(Loss) 1-(2+3+4)+(add 5 to 9) LABOUR COST 11 Salaries 12 Bonuses 13 CPF 14 Staff Welfare 15 Medical Expenses 16 Training Expenses 17 Directors’ Fees
18 Insurance for employees
19 Others
20 Total Labour Cost add 11 to 19
INTEREST ON BORROWINGS
21 Bank Interest & Charges
22 Loan Interest
23 Hire Purchase Interest
24 Others
25 Total Interest on Borrowings add 21 to 24
DEPRECIATION
26 Buildings
27 Plant, Equipment & Machinery
28 Others
29 Total Depreciation add 26 to 28
TAXES
30 Customs & Excise Duties
31 Property Tax
32 Foreign Worker Levy
33 Others (excl income tax & GST)
34 Total Taxes add 30 to 33
35 VALUE ADDED 10+20+25+29+34
Section 2 : Calculation and Evaluation of Key Productivity Indicators
The indicators shown in Figure 1 are the key productivity indicators commonly used to diagnose an organisation’s productivity performance.
Figure 1: Indicators of Organisation’s Performance on the Key Productivity Levers
Table 1: Additional data required for calculation of key productivity indicators
Year 1 Year 2 Year 3
Number of employees1 (average for period)
Sales ($) Labour cost ($)
Fixed assets at net book value2 (average for period) ($)
Operating profit (before interest and tax) ($)
1 Refers to all categories of employees, including working directors/proprietors/partners, unpaid family
workers and part-time workers. Part-time workers should be converted to their full-time equivalent.
2 Excludes work-in-progress
To compute the key productivity indicators, the information shown in Table 1 is required in addition to the value added calculated in Section 1.
ANNEX C IMPACT Assessment
Calculation of Key Productivity Indicators
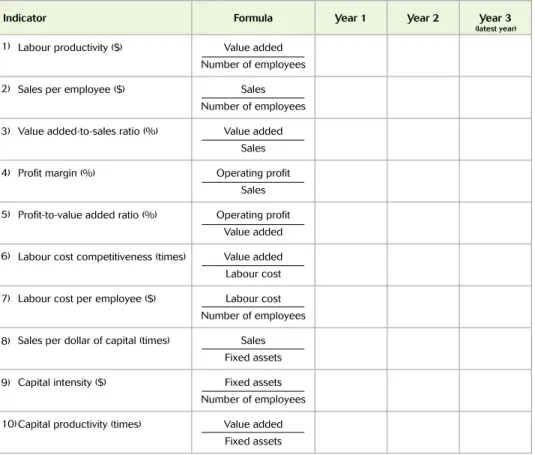
Calculate the key productivity indicators using the information provided in Section 1 and Table 1. The formulas for the indicators are shown in Table 2.
Table 2: Calculation of key productivity indicators
Indicator Formula Year 1 Year 2 Year 3
Labour productivity ($) Value added
Number of employees
Sales per employee ($) Sales
Number of employees
Value added-to-sales ratio (%) Value added
Sales
Profit margin (%) Operating profit
Sales Profit-to-value added ratio (%) Operating profit
Value added Labour cost competitiveness (times) Value added Labour cost
Labour cost per employee ($) Labour cost
Number of employees
Sales per dollar of capital (times) Sales
Fixed assets
Capital intensity ($) Fixed assets
Number of employees
Capital productivity (times) Value added
Fixed assets
Evaluation of Key Productivity Indicators
To know how well your organisation fares in its productivity efforts, a comparison should be done against the industry average. Figures on the industry average can be obtained from the Singapore Department of Statistics (www.singstat.gov.sg) and other government agencies overseeing the respective industry sectors3.
(latest year) 1) 2) 3) 4) 5) 6) 7) 8) 9) 10)
Fill in a year’s results of the key productivity indicators and compare them against the industry average in Table 3. Calculate the variance between your organisation’s results and the industry average.
A comparison can also be made against your organisation’s past performance for trend analysis, or against industry benchmarks and best-in-class performers for further improvement.
Table 3: Comparison of key productivity indicators against industry average
Indicator
Year % Variance Assessment
e.g. low, average. (See note to Table 3)
Organisation Industry
Average {[(a) – (b)] / (b)} x 100%
(a) (b)
1) Labour productivity ($) 2) Sales per employee ($) 3) Value added-to-sales ratio (%) 4) Profit margin (%)
5) Profit-to-value added ratio (%) 6) Labour cost competitiveness (times) 7) Labour cost per employee ($) 8) Sales per dollar of capital (times) 9) Capital intensity ($)
10) Capital productivity (times)
Note
How organisation’s performance compares against industry average Assessment
> 30% below industry average Very low
10 – 30% below industry average Low
± 10% of industry average Average
10 – 30% above industry average High
> 30% above industry average Very high
The findings from the assessments performed in Parts I and II should be taken in totality before you decide the course of action to pursue. Senior management should discuss and agree on the key areas of focus, guided by the following:
Productivity management total score of less than 30% (Part I)
This indicates that the organisation is weak in productivity management and improvement efforts. Particular attention should be given to areas where the score achieved is less than 30% of the maximum score.
Productivity indicators which fall below 30% of the industry average (Part II) Productivity indicators are interlinked. The organisation should assess the performance of an indicator in relation to other indicators and consider the internal and external factors affecting it.
The organisation should determine the underlying causes for any performance that falls below expectations and industry averages, and take specific actions to improve its productivity. Productivity management is a journey of continuous improvements. Organisations that score well in the IMPACT assessment should continue to manage productivity in a systematic manner. This will ensure that the productivity achievements are sustainable in the long run.
Overall Assessment and Recommendations PART III
For more information on productivity and self-help tools, visit the Productivity@Work website at www.enterpriseone.gov.sg
SPRING Singapore
1 Fusionopolis Walk, #01-02, South Tower, Solaris, Singapore 138628 Tel: +65 6278 6666 - Fax: +65 6278 6667