Do Depositors Care About Enforcement Actions?
R. Alton Gilbert and Mark D. Vaughan
Working Paper 2000-020A
http://research.stlouisfed.org/wp/2000/2000-020.pdf
FEDERAL RESERVE BANK OF ST. LOUIS
Research Division 411 Locust Street St. Louis, MO 63102
______________________________________________________________________________________ The views expressed are those of the individual authors and do not necessarily reflect official positions of the Federal Reserve Bank of St. Louis, the Federal Reserve System, or the Board of Governors.
Federal Reserve Bank of St. Louis Working Papers are preliminary materials circulated to stimulate discussion and critical comment. References in publications to Federal Reserve Bank of St. Louis Working Papers (other than an acknowledgment that the writer has had access to unpublished material) should be cleared with the author or authors.
R. Alton Gilbert
Vice President Research Department Federal Reserve Bank of St. Louis
P.O. Box 442 St. Louis, Missouri 63166
314-444-8559 e-mail: [email protected]
Mark D. Vaughan
Senior Manager and Economist Banking Supervision and Regulation
Federal Reserve Bank of St. Louis P.O. Box 442
St. Louis, Missouri 63166 314-444-8859
e-mail: [email protected]
JEL Codes: G21 and G28
Keywords: Bank Supervision, Enforcement Actions, Market Discipline
Date: July 1, 2000
We thank Heather Black, Eli Brewer, Joan Cronin, Bob DeYoung, John Jordan, Steve Kane, Mary Karr, Andy Meyer, Bill Poole, Gary Whalen, and Tim Yeager as well as seminar participants at Baylor University, the Federal Reserve Bank of St. Louis, the Federal Reserve Bank of Dallas, the Federal Reserve Bank of New York, the Financial Management Association meetings, Indiana University, the Midwest Finance Association meetings, Texas A&M University, the University of Missouri at St. Louis, Washington University in St. Louis, and the Western Economics Association meetings for useful comments. We also thank Boyd Anderson, Winchell Carroll, Tom King, and Rob Webb for excellent research assistance. All remaining errors are our own. The views expressed in this paper do not reflect official positions of the Federal Reserve Bank of St. Louis, the Board of Governors, or the Federal Reserve System.
“DO DEPOSITORS CARE ABOUT ENFORCEMENT
ACTIONS?”
ABSTRACT
Since 1990, federal bank supervisors have publicly announced formal enforcement actions. This change in regime provides a natural laboratory to test two propositions: (1) claims by economists that putting confidential supervisory information in the public domain will enhance market discipline and (2) claims by bank supervisors that releasing such data will spark runs. To evaluate these propositions, we measure depositor reaction to 87 Federal Reserve announcements of enforcement actions. We compare deposit growth rates and yield spreads before and after the announcements at the sample banks and a control group of peer banks. The data show no evidence of unusual deposit withdrawals or spread increases at the sample banks following the announcements of formal actions. These results suggest that public announcements of enforcement actions did not spark bank runs or enhance depositor discipline. Apparently, depositors did not care a great deal about our sample actions.
JEL Codes: G21 and G28
I. Introduction
As is well known, underpriced deposit insurance creates incentives for bankers to take excessive risk. Bankers can pursue high-risk ventures, confident of capturing the profits and shifting the losses, should failure occur, to the Federal Deposit Insurance Corporation (FDIC). Broadly speaking, two forces constrain this temptation: government supervision (Flannery, 1982) and discipline by bank claim-holders [see Flannery, (1998) for a thorough review of the literature].
Theory and evidence suggest that discipline by bank claim-holders can play an important role constraining bank risk. Bank claim-holders, with their own money on the line, have powerful incentives to monitor and punish excessive risk. Between 1987 and 1991, for example, holders of large certificates of deposit at thrift institutions responded to increases in the probability of failure by demanding higher yields and withdrawing funds (Park and Peristiani, 1998). Thrift supervisors, in contrast, responded to emerging problems slowly, hoping that troubled institutions would grow out of their problems. This regulatory forbearance significantly increased the ultimate cost of the cleanup (Kane, 1989; White, 1991).
The evolution of public policy over the last decade reflects the view that discipline by bank claim-holders can be an important check on bank risk. The Federal Deposit Insurance Corporation Improvement Act of 1991 (FDICIA) limited insurance coverage on some classes of deposits and directed the FDIC to resolve failures in the least costly way. These provisions shifted more of the burden of failure to uninsured depositors, thereby strengthening their role as monitors (Benston and Kaufman, 1997). Moreover,
the capital standards phased in under the Basle Accords were designed to mimic the discipline that depositors would impose in a world with no insurance by linking capital requirements to credit risk exposure (Berger, et. al., 1995).
In theory, greater disclosure of confidential supervisory information could further strengthen discipline by bank claim-holders. The Federal Financial Institutions Examinations Council (FFIEC) requires all depository institutions to submit quarterly Reports of Condition and Income, also known as call reports. Bank claim-holders, in turn, react when presented with evidence that an institution is taking on more risk (Hall, Meyer, and Vaughan, 1998; Hall, King, Meyer, and Vaughan, 1999). Through on-site examinations, supervisors gather additional information about the quality of loan portfolios and the competence of bank management that does not appear in call reports. If bank claim-holders had access to this confidential information, they could, in theory, exert even more effective discipline on risky institutions.
Bank supervisors have, however, consistently opposed releasing confidential information for fear of sparking costly runs. Bank runs, supervisors argue, are not creatures of the 1930s. In the 1980s, for example, news reports questioning the solvency of state-run deposit insurance funds prompted runs at thrift institutions in Maryland and Ohio (Kane, 1989). More recently, a CNN report about the 1991 Rhode Island credit union crisis led to a brief run on Old Stone Bank, a safe and sound $3.7 billion thrift, when a reporter elected to use the institution’s impressive façade as a backdrop (Wilke, 1991; Leander, 1991). Supervisors fear that depositors will respond to negative information as Old Stone’s depositors responded to the CNN report. Instead of evaluating the information carefully, depositors will panic and withdraw funds from
named or other similar institutions. The failures of such institutions may, in turn, disrupt lending relationships that cannot easily be re-established with other banks. Disruption of these relationships reduces the value of bank-dependent firms (Peterson and Rajan, 1994; Slovin, Shuska, and Poloncheck, 1993) and depresses local as well as national economic activity (Bernanke, 1983; Gilbert and Kochin, 1989).
Although most bank-specific adverse information remains confidential, supervisors have begun to publicly announce the imposition of formal enforcement actions. Supervisors use enforcement actions to bring banks into compliance with consumer regulations and safety-and-soundness standards. Enforcement actions take one of two forms: informal understandings between banks and their supervisors and more formal actions, which are enforceable in the courts. In 1989, over the objection of the supervisory community, Congress mandated the disclosure of the most serious formal actions, cease-and-desist orders. Soon after, Congress expanded the disclosure requirements, directing that the public be notified about all formal enforcement actions. This regime change provides a natural laboratory for gauging depositor response to adverse supervisory information.
Several studies have explored the impact of enforcement actions on various aspects of bank behavior. Curry, et. al. (1999), for example, found that formal enforcement actions prompt banks to make significant changes in operating policies, such as slowing asset growth and building loan loss provisions. Curry (1997) has also presented evidence showing that formal enforcement actions have the same effect on bank behavior as informal actions. Peek and Rosengren (1995a, 1995b, and 1996), meanwhile, have
documented a link between formal enforcement actions and reductions in bank lending, particularly to bank-dependent borrowers.
Only one study, however, has exploited data on formal actions to address the market discipline vs. bank run question. Using an event study approach, Jordan, Peek, and Rosengren (1999) measured the stock market’s reaction to announcements of formal actions for a sample of 35 banking organizations. They identified statistically significant and economically large, negative abnormal returns on the stock of these organizations around the time when details of the actions appeared in the press. To look for evidence of runs, they also examined deposit levels following the actions and found only a moderate decline. The authors interpreted these results as evidence of market discipline rather than bank runs.
The Jordan, Peek, and Rosengren study suffers from several methodological shortcomings that make it difficult to interpret their findings. First, evidence of negative stock returns following enforcement action announcements is consistent with two different hypotheses. On one hand, the capital market could be responding to new adverse information about the condition of the named institutions. On the other, the capital market could be responding to a change in bank control that reduces the value of the put option implicit in deposit insurance. The value of this put to bank shareholders increases with the volatility of underlying cash flows, and supervisors would, undoubtedly, take steps to reduce volatility. Second, the authors do not control for secular trends in deposit growth and for seasonal and geographic deviations from those trends. It is possible that deposit levels at other, similar, banks increased dramatically
over the same time period. In that case, the moderate declines in deposits at the sample banks would look more like runs.
We examine the same underlying questions addressed in the Jordan, Peek, and Rosengren study, but we use an approach that allows clearer interpretation of the evidence. Specifically, we measure depositor reaction to 87 Federal Reserve announcements of enforcement actions. We compare deposit growth rates before and after the announcements at the sample banks and a control group of peer banks. We also track changes in the spread between deposit yields offered by the sample banks and the peer banks. Unlike previous work, our method controls for seasonal, geographic, and secular influences. Moreover, we exploit heterogeneity in the sample to gauge the importance of change-in-control effects to our results.
Taken together, our findings suggest that public announcements of formal actions did not spark bank runs or enhance depositor discipline. The data showed no evidence of unusual deposit withdrawals from the sample banks or unusual increases in deposit spreads after the disclosures. Apparently, depositors did not care a great deal about our sample actions.
II. A Primer on Enforcement Actions
The announcement that a supervisor has imposed a formal action signals depositors that serious regulatory compliance or safety-and-soundness issues exist at the affected institution. If the action concerns a safety-and-soundness issue, then depositors may revise upward their expected probability of institution failure. For the same potential
losses—either the principal on uninsured deposits or the nuisance cost of having transactions funds in a closed institution—such a revision implies an increase in the expected losses. In theory, depositors should respond by withdrawing funds or demanding higher returns on those funds. If depositors panic, a run could occur.
To see why depositors might value the signal from an enforcement action, it is necessary to understand the role of these actions in bank supervision. The term “enforcement action” refers to a broad range of powers used to address suspect practices of depository institutions and institution-affiliated parties. Typically, enforcement actions are imposed after an on-site exam has unearthed adverse information, but they can also be triggered by deficient capital levels under the prompt corrective action guidelines of FDICIA or by information gathered through off-site surveillance. Supervisors generally implement enforcement actions in a graduated manner, with informal actions preceding formal actions.
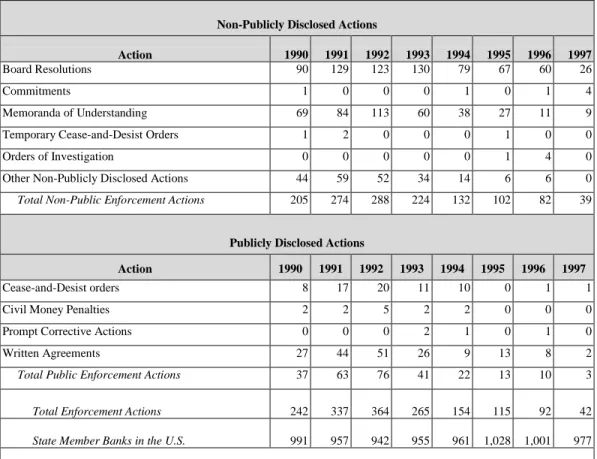
Informal actions are the most common type of enforcement action. Supervisors use informal actions when problems are considered to be less severe and management is expected to take corrective steps. Informal actions are simply mutual understandings between banks and their supervisors that suspect practices and violations will be addressed. These understandings are not enforceable through the courts; failure to comply cannot serve as a basis for assessing civil money penalties, for initiating actions to remove bank officers or directors, or for prohibiting bank officers or directors from involvement in the affairs of other banks. Supervisors do not disclose informal actions to the public. Table 1 contains data on enforcement actions issued by the Federal Reserve. From 1990 through 1997, the Federal Reserve imposed 1,611 enforcement actions
against bank holding companies and state-chartered, member banks. Of that total, 1,346 (84 percent) were informal.
Supervisors resort to formal actions only when violations of law or regulations continue or when unsafe and abusive practices occur. Formal enforcement actions are legally enforceable and, in most cases, publicly disclosed. Formal actions include cease-and-desist orders, written agreements, prohibition-and-removal orders, civil money penalties, and prompt-corrective-action directives. Written agreements and cease-and-desist orders are the most common types of formal action. Of the 265 final, formal enforcement actions announced by the Federal Reserve though 1997, 180 (or 68 percent) were written agreements, while 68 (or 26 percent) were cease-and-desist orders.
Although supervisors view all formal actions as grave matters, they consider cease-and-desist orders to be more serious than written agreements. Supervisors rely on written agreements when they believe that an institution’s problems warrant a less severe form of formal action and that management will take remedial steps. A cease-and-desist order, in contrast, is used as a last resort. Such an order requires a depository institution or person either to desist from suspect practices or violations or to take affirmative action to correct the practices or violations. An affirmative action could, for example, require that the institution be returned to its condition prior to the practice or violation. Other affirmative actions include restrictions on growth, debt and dividends; disposition of certain loans or assets; rescission of agreements or contracts; and the termination of certain officers or employees.
Prior to 1989, the public never learned about the vast majority of enforcement actions. The Securities and Exchange Commission did require depository institutions with publicly traded stock to disclose enforcement actions deemed “material.” In addition, the Comptroller of the Currency—on a limited, case-by-case basis—disclosed the facts surrounding its enforcement actions (Combating Fraud, Abuse, and Misconduct
in the Nation’s Financial Institutions, p. 88). FIRREA and the Crime Control Act (CCA)
of 1990 required supervisory agencies for the first time to publicly disclose final, formal enforcement actions as well as any modifications or terminations of the actions.
In the debate over FIRREA, the House of Representatives questioned the secrecy about enforcement actions, noting that bank supervisors were alone among federal regulators in keeping civil enforcement actions confidential (Financial Institutions
Reform, Recovery, and Enforcement Act, p. 470). The House also asserted that
confidentiality served only to perpetuate banker misconduct and exacerbate the problems of troubled institutions. Disclosure, in contrast, would inform taxpayers about the effectiveness of the bank regulatory system, signal depository institutions about the types of conduct that would not be tolerated, and warn the financial community about particular problem banks (Combating Fraud, p. 89). Supervisors countered that disclosure of
enforcement actions might trigger bank runs, but these concerns were downplayed. Indeed, the House noted that no bank or thrift run had ever occurred following the indictment and prosecution of a bank official or owner (Ibid., p. 89).
III. The Sample Enforcement Actions
To test depositor reaction to enforcement action announcements, we assembled a sample of publicly disclosed actions from the 1990s. We began by securing press notices for all formal actions imposed by the three federal banking agencies since 1990. After reading these notices, we decided to limit the sample to actions brought by the Federal Reserve for safety-and-soundness reasons. We excluded actions dealing with consumer affairs problems because they revealed no adverse information about bank condition. We confined our analysis to Federal Reserve actions to allow clearer identification of an event date. The Fed announced each action in a separate press release at the time of imposition while the Comptroller of the Currency and the FDIC announced all actions in monthly press releases. Concentrating on Federal Reserve actions also insured greater homogeneity in the sample; discussions with Federal Reserve supervisors and lawyers convinced us that fewer differences obtain across the twelve regional Reserve Banks than across federal supervisory agencies in the criteria for resorting to a formal action.
We designed our sample to bias the empirical tests towards finding evidence of a depositor reaction. The sample included only those formal actions that were clearly related to bank condition and, hence, would be interpreted by depositors as “bad news.” The text of the sample press releases included common provisions such as prohibitions on paying dividends. Applying this screen yielded a sample of 177 formal enforcement actions imposed on 166 different banks. Unfortunately, weekly deposit data were not available for 69 of these banks. Also, we could not find adequate peer institutions for 9 banks. (We matched each sample bank with a set of peer banks to hold all other factors affecting deposit behavior constant. See section IV for further discussion.) Finally, we
deleted one bank as an outlier. After these adjustments, the sample included 87 enforcement actions on 87 different banks.
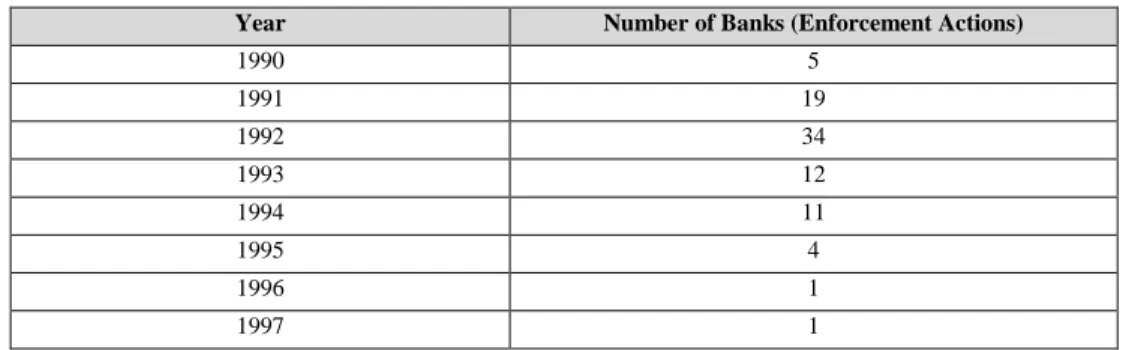
Although the sample was not chosen to be representative, it matched the universe of U.S. banks and Federal Reserve enforcement actions reasonably well. Table 2 presents information about the 87 sample banks and the enforcement actions imposed on those banks. The sample banks were geographically dispersed, representing 25 states and each of the nine U.S. census regions except the Pacific Northwest. The sample banks, like most U.S. banks, were small—65 of the 87 actions were imposed on banks with less than $250 million in assets. The sample actions, like most of the enforcement actions in the 1990s, were concentrated in the first part of the decade; 81 of the 87 actions were imposed before 1995. Finally, like most formal actions in the 1990s, most of the sample actions were written agreements (60), but a nontrivial number were cease-and-desist orders (27).
When analyzing the impact of enforcement action announcements on deposit behavior, it is important to distinguish between changes induced by depositors and changes induced by supervisors. Supervisors assign confidential safety-and-soundness grades at the close of each examination. These grades, called composite CAMELS scores, range from 1 (best) to 5 (worst). In general, banks with composite ratings of CAMELS 3, 4, or, 5 are considered problem institutions. When a bank slips into problem status, supervisors typically require management to develop an explicit plan for restoring safety and soundness. These plans often involve strengthening the bank’s leverage ratio. Because troubled institutions often find it difficult to attract new capital, executing these plans depends heavily on reducing assets and deposits (Gilbert, 1994; Curry, et. al.,
1999). If formal actions were imposed at the same time a bank was downgraded to problem status, then any observed change in deposit behavior in the following weeks or quarters might be the result of management action rather than depositor reaction.
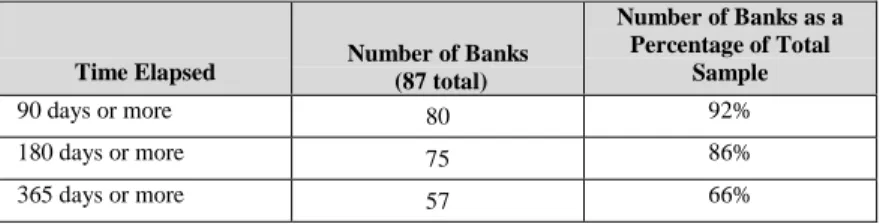
For most of the sample banks, a considerable span of time separated the enforcement action and CAMEL downgrades, making it more likely that any observed changes in deposit behavior were induced by depositors.1 We defined a downgrade date as the opening date of the examination that ultimately led to the increase in (deterioration of) the composite CAMEL rating. Table 3 classifies the 87 sample banks by the time elapsed between the downgrade to problem status and the formal action. Supervisors downgraded 80 of the sample banks at least one quarter before the date of the action. For 75 of the sample banks, the interval between the CAMEL downgrade and the announcement date was at least two quarters. For 57 of the banks, at least a year separated the downgrade and the enforcement action. In short, supervisors recognized problems and demanded remedial action at most of the sample banks well before the enforcement actions were imposed.
Because, in theory, a formal action will prompt a depositor reaction only if the announcement changes perceptions about failure, it is important to identify the information available to the public as of the announcement date. If, for example, the sample banks already had one foot in the grave, the announcements might not have conveyed much additional information to depositors. Table 4 summarizes the data available to the public about the capital positions, profitability, and asset quality of the
1
The “S” component of the CAMELS score, which gauges sensitivity to market risk, was not added until January 1, 1997—at the end of our sample period.
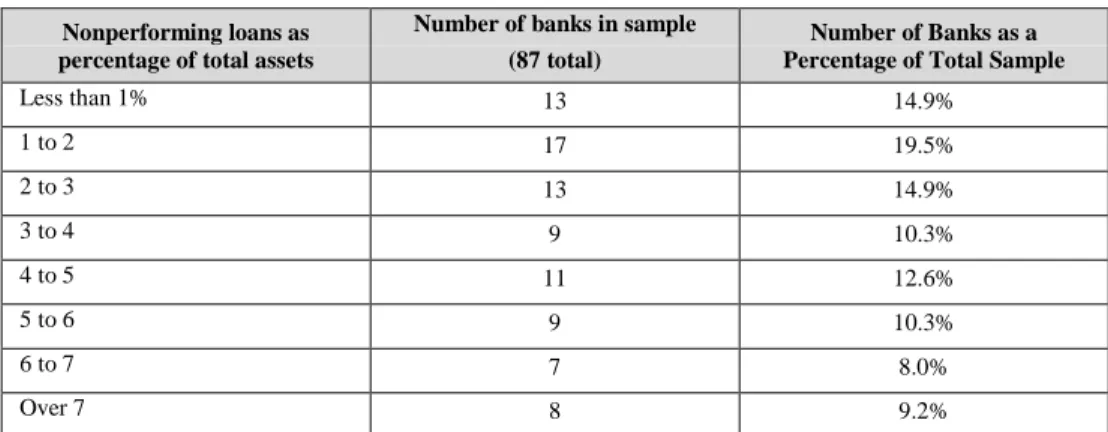
sample banks in the quarter prior to the actions. Most of the banks were adequately capitalized: about two-thirds boasted equity-to-asset ratios above 6 percent. Although the sample banks posted relatively low profitability ratios—only 16 met the industry benchmark of a one-percent return on assets—net income was positive at 47 of the banks. Asset quality was a problem at many of the banks; nevertheless, 52 of the 87 banks reported nonperforming-loan-to-asset ratios below the 4 percent threshold documented by Gilbert (1992) as a harbinger of failure. In short, the sample banks were not, on average, in robust condition, but they were not on the verge of failure either.
IV. The Research Strategy
To examine the run vs. market discipline question, we looked for evidence that depositors withdrew funds or demanded higher yields from the sample banks following disclosure of the formal actions. If depositors receive unfavorable signals from supervisory enforcement actions, they ought to respond to them by decreasing the supply of funds they provide to the afflicted bank. This deposit-supply contraction should lead,
ceteris paribus, to a decrease in deposit accounts on the bank’s books and a rise in the
yield it is obliged to pay on these accounts.
One can imagine an alternative scenario wherein the bank’s demand for deposits shifts synchronously with depositor supply. This reaction may occur, for example, if borrowers interpret the enforcement action as a signal that the bank has loose credit standards and flood it with increased loan demand. The bank will then attempt to attract additional deposits to fund the new loans, so that observations of changes in deposit totals may understate the effects of the depositor reaction. In the extreme, we may actually see
deposit levels rise in the aftermath of the enforcement action if this demand on the part of the bank greatly outweighs the supply contraction. Looking only at changes in deposit quantities may thus be misleading if supply does not move in isolation. However, the demand and supply movements in this scenario will both exert an upward effect on yields. By looking at changes in both deposit levels and yields (i.e., both at price and quantity fluctuations), we can deduce unambiguously whether any depositor reaction has occurred.
We therefore looked both at changes in growth rates and yields for total deposits at our sample banks. We also considered four specific types of deposits—transactions deposits, savings deposits, small time deposits, and large time deposits. A priori, we
expected that large time deposits would be the most sensitive to announcements because, in the wake of FDICIA, large depositors have borne more of the burden of failures.
We began by computing deposit growth rates for the sample banks in the weeks and quarters following the announcements. We let Ds represent the weekly deposit level in the sample banks and the subscripts on Ds denote the week of the observation. For example, Ds0 refers to the deposit level in the sample banks the week just prior to the
announcement. Similarly, Dsn refers to deposit levels “n” weeks or quarters later. Using
this nomenclature, we calculated deposit growth for the sample banks in the “n” weeks or quarters after the enforcement action using the following ratio:
D
D
s
o
s
n
=
Deposit growth at the sample banks in the “n” weeks after the announcementWhen examining deposit growth, it is important to control for seasonal and geographic influences. Suppose, for example, that deposits declined at the sample banks an average of 10 percent in the four weeks after the enforcement action. If deposits also declined 10 percent at a set of peer banks over that same period, it would be hard to conclude that depositors of the sample banks reacted to the announcement. To control for geographic and seasonal factors, we subtracted the deposit growth rate at a set of peer banks in the “n” weeks or quarters after the announcement from the deposit growth rate at the sample banks. Letting Dpn denote deposit levels in the peer banks “n” weeks or
quarters after disclosure, we obtained deposit growth rates at the peer banks with the same ratio, namely:
D
D
p
o
p
n
=
Deposit growth at the sample banks in the “n” weeks or quarters following the enforcement action, adjusted for deposit growth at the peer banks, is given by:
D
D
-D
D
p
o
p
n
s
o
s
n
=
We formed the control group by matching each sample bank with at least three and as many as ten peer institutions. Peer banks had to be headquartered in the same census
“Adjusted” deposit
growth at the
sample banks in the
“n” weeks
after
the
announcement
Deposit growth at the peer banks in the “n” weeks after the announcement
region, boast a CAMEL 1 or 2 rating, and maintain total deposit levels within 25 percent of the sample bank as of the date of the enforcement action. To eliminate noise, we treated peer banks collectively as one big bank. To insure robustness, we assembled an alternative peer group by matching each sample bank with a healthy (CAMEL 1 or 2 rating), similarly sized institution (total deposit levels within 10 percent of the sample bank) that was located outside of the census region of the sample bank. In the alternative
group, each sample bank was matched with at least 5 and as many as 613 peer banks.
It is also important to control for underlying trends in deposit growth at the sample and peer banks. A negative adjusted deposit growth figure might, instead of providing evidence of depositor reaction to an enforcement action, be nothing more than the continuation of a trend. Suppose, for example, that the public is aware of a general deterioration in the condition of the sample banks. As a result, adjusted deposits— growth at the sample banks net of growth at the peer banks—have declined an average of 10 percent in each of the past three quarters. If adjusted deposits declined 10 percent in the quarter following the enforcement action, it would be hard to conclude that depositors of the sample banks found the announcements alarming.
To control for secular trends, we subtracted adjusted deposit growth in the “n” weeks or quarters before the announcement from the adjusted growth rate of deposits in the “n”
weeks or quarters after the announcement. We used the same approach to obtain deposit
growth figures in the period leading up to the announcement that we used to obtain growth figures for the period following the announcement. Specifically, we let Ds-n
denote the deposit levels in the sample bank “n” weeks or quarters before the announcement and Dp-n denote the deposit levels in the peer banks “n” weeks or quarters
18
before the announcement. To obtain adjusted growth before the announcement, we computed the following difference:
=
−
−
p
n
p
o
s
n
s
o
D
D
-D
D
Finally, to arrive at an overall figure for deposit growth that controlled for seasonal and geographic influences as well as secular trends, we subtracted adjusted deposit growth before the action from growth after the action:
=
ú
û
ù
ê
ë
é
−
−
D
D
-D
D
D
D
-D
D
p
n
p
o
s
n
s
o
p
o
p
n
s
o
s
n
Rearranging parentheses highlights the amount of the overall change that can be traced to the sample banks and the amount that can be traced to the peer banks.
ú
û
ù
ê
ë
é
−
−
D
D
-D
D
D
D
-D
D
p
n
p
o
p
o
p
n
s
n
s
o
s
o
s
n
“Adjusted” deposit
growth in the “n”
weeks or quarters
before
the
announcement
Change in deposit
growth at sample
Change in deposit
growth at peer
Change in “adjusted”
deposit growth after the
enforcement action
=
(1a) (1b)Change in
“adjusted”
deposit growth
following the
enforcement
action
We examined changes in adjusted deposit growth rates over three intervals: four weeks before to four weeks after the announcement, one quarter before to one quarter after the announcement, and two quarters before to two quarters after the announcement. Weekly deposit data were obtained from each bank’s Report of Transaction Accounts, Other Deposits and Vault Cash (reported on the Federal Reserve form, FR 2900). An economically and statistically significant decline in adjusted deposit growth following the announcement would be evidence that depositors reacted adversely to the enforcement action. Although no clear line differentiates a run from depositor discipline, we believe that exceptionally large declines during the four-week window are consistent with runs while large declines during the one-quarter and/or two-quarter windows are more consistent with depositor discipline.
Because depositor discipline can also take the form of higher deposit rates, we analyzed trends in funding costs at the sample banks. Indeed, Park and Peristiani (1998) have shown that market discipline is reflected entirely in rates when every depositor can accurately estimate the probability of failure and the expected amount to be recovered should failure occur. Changes in market rates were not observable for most of the sample banks, so we examined changes in accounting proxies for market rates. We used call report data to compute the average rates paid on deposits each quarter by the sample banks and their peers. Specifically, these yields were calculated by dividing the interest paid on deposits in a given quarter by the average level of deposits in that quarter. Following our work on deposit growth, we calculated yields for total deposits as well as for transaction deposits, savings deposits, small time deposits and large time deposits. We also included a yield measure that adjusted for service charges (NETYLD) because
the explicit interest on some accounts may be offset by various fees. In sum, the six yield measures were:
• GROSYLD – the average yield on all deposits (not adjusting for deposit charges)
• JUMYLD – the average yield on jumbo (> $100,000) time deposits
• SMALYLD – the average yield on time deposits under $100,000
• TRANYLD – the average yield on transactions deposits
• SAVYLD – the average yield on savings deposits
• NETYLD – the average yield on all deposits, net of deposit charges
When analyzing trends in deposit yields, it is important to control for seasonal and geographic influences as well as the general level of interest rates. We controlled for these influences by computing the spread between the yields offered by the sample banks and the yields offered by the control banks. We then examined the change in these yields between the announcement date and a date “n” quarters later. Specifically, for total deposits as well as for each individual deposit category, we let Ysn refer to the yield
offered by the sample banks “n” quarters after the action, and Ypn refer to the yield
offered by the peer banks. The spread for each deposit category “n” quarters after the announcement is given by:
Similarly, the spread at the time of the enforcement action is given by:
(
−
p
)
=
n
=
n
s
n
Y
S
Y
Deposit spread, “n” quarters after the action(
s
−
p
)
=
=
S
Y
For each deposit category, the change in spread in the “n” quarters after the enforcement
action is given by:
We controlled for secular trends by comparing the changes in deposit spreads in the “n” quarters after the enforcement action with changes in the “n” quarters before the action. Following the approach we used to calculate changes after the announcement, we
computed changes in the spread for each deposit category in the “n” quarters before the
action:
The change in the trend in the spread is, therefore, given by:
(
S
n
−
S
o
)
=
∆
S
N
=
Change in the spread in the “n” quarters after the action
(
S
o
−
S
−
n
)
=
∆
S
−
N
=
Change in the spread in the
“n” weeks before the action
(
∆
S
N
−
∆
S
−
N
)
=
Change in the trend in deposit spreads (i.e., changes in “adjusted” spreads) (2)Again, we can rearrange the terms in equation (2) to highlight the amount of the widening (or narrowing) in spreads that can be traced to the sample banks and the amount that can be traced to the peer banks.
We tracked changes in deposit spreads over two intervals: one quarter before to one quarter after the announcement, and two quarters before to two quarters after the announcement. We obtained the interest expense data from schedule RI and the deposit level data from schedule RC-E of each bank’s call report. We could not consider the four-week interval because call report data are only submitted quarterly. Evidence that deposit spreads widened by more—in a statistically as well as economically meaningful sense—in the one- and two-quarter intervals following the announcement than in the quarters before the announcement would be consistent with depositor discipline.
V. Evidence of Bank Runs
As noted, supervisors opposed announcing the imposition of formal actions on the grounds that such announcements might spark runs. We now test this claim by examining changes in adjusted deposits in the four weeks following disclosure. Specifically, we define a run as an exceptionally large decline in adjusted deposits at the sample banks in the four weeks after the announcement, compared with the four weeks before the announcement. Table 5 contains the evidence about runs on the sample banks. Panel A displays the adjusted growth figures for the sample banks and the original peer group. Panel B shows the adjusted growth figures when the alternative peer group is used for control. Panel C documents the adjusted growth rates for the sample banks
following their last CAMEL downgrade. These growth rates provide a benchmark for interpreting the economic significance of adjusted growth rates in Panels A and B. A run, for example, should involve deposit runoffs several orders of magnitude larger than the runoffs engineered by bank management to comply with supervisory directives. In each panel, column 3 contains the overall change in deposit growth (change at the sample banks minus change at the peer banks); column 4 contains the standard deviation of the overall change, column 5 notes the statistical significance of the overall change; and column 6 indicates what percentage of the sample banks experienced deposit runoffs relative to their peers.
Adjusted deposit growth in the four-week interval after the formal actions suggests that the announcements did not spark runs. The average change in total deposits was a positive 0.49 percent, implying that funds flowed into the sample banks relative to peer
banks, though this change was not statistically significant. Moreover, only 46 percent of the sample banks experienced a relative outflow of total deposits. Turning to the individual deposit categories, on average the sample banks did suffer small relative runoffs of savings deposits and jumbo CDs, although, again, neither change was statistically significant. The results were comparable when an alternative peer group was used. As expected, jumbo CDs exhibited the most sensitivity to the announcement (a 2.88 percent adjusted decline using the original peer group and a 2.48 percent adjusted decline with the alternative peer group). Still, the adjusted decline was not appreciably larger than the runoff that occurred after the last CAMEL downgrade (-2.83%).
One potential reason that depositors did not “run” the sample banks is that they already knew about the safety-and-soundness problems. To explore this possibility, we
partitioned the 87 sample banks into two sub-samples: those that appeared financially strong and those that appeared financially weak as of the last call report. A “strong” bank had to meet three criteria: an equity-to-asset ratio above 6 percent, a return-on-asset ratio above zero, and a nonperforming-loan-to-asset ratio below 4 percent. Of the 87 sample banks, 28 met the criteria. Depositors at the strong banks should have been surprised by the enforcement action announcements. It is possible, therefore, that runs on the strong banks occurred, but that the evidence is obscured by the inclusion of the 59 other banks.
Examination of deposit growth rates at the strong banks offered no evidence of runs. Comparisons of adjusted deposit growth at these banks and the 59 other banks—for total deposits as well as for the individual deposit categories—revealed no statistically significant differences. Looking at the strong bank sub-sample in isolation, the average change in total deposits was small (0.21 percent), had the wrong sign and was not statistically significant. Again, runoffs of total deposits occurred at only about one-half of the strong banks. Turning to the individual deposit categories, the 28 strong banks again suffered small relative runoffs of savings deposits and jumbo CDs, although, as with the full sample, neither change was statistically significant. The adjusted decline in jumbo CDs was somewhat larger (-4.13 percent) than the average runoff for the full sample (-2.88 percent) but still not large enough to be characterized as a run. These results did not change when the alternative peer group was used for control.
Another possible explanation for the evidence is that depositors at the larger sample banks believed that their funds carried de facto insurance. Depositors at banks deemed “too big to fail” might not infer from the announcement of a formal action that expected
losses were higher. To control for this effect, we partitioned the 87-bank sample into two sub-samples: the 79 banks with less than $1 billion in deposits at the time of the enforcement actions (“small” banks) and the 8 banks with more than $1 billion in deposits (“too big to fail” banks). We then examined the adjusted deposit growth rates for the small bank sub-sample and compared them with the growth rates for the “too big to fail” sub-sample.
The data did not support the hypothesis that small and large banks posted different deposit growth rates in the wake of the enforcement actions. First, the results for the small bank sub-sample were almost identical to those obtained with the full sample. Irrespective of which control group we used, the adjusted growth of total deposits was small (0.27 percent for the original peer group and 0.33 percent for the alternative peer group), positive, and statistically indistinguishable from zero. Again, only two of the individual deposit growth rates had the correct sign: savings deposits and jumbo CDs (though neither differed statistically from zero). And, the decline in jumbo CDs (-2.56 percent with original peers) was on par with the decline for the full sample. Second, and more important, we could not reject the hypothesis that adjusted deposit growth rates for the small and the “too big to fail” banks were equal, not only for total deposits, but also for each deposit category.
Still another possible explanation for the absence of runs is that depositors did not know about the sample actions. The Fed issued press releases about the actions, but it is possible that local, regional, or trade newspapers did not report them. To exclude this possibility, we searched several news databases for articles about each bank or its holding company, beginning two months before the announcement of the formal action and
ending two months after the announcement. The databases included articles from 127 major regional newspapers and business publications as well as The New York Times, The
Washington Post, The Christian Science Monitor and American Banker. The search
revealed articles about 33 of the 87 sample actions. Because it is possible that runs occurred only at the banks whose actions were reported, we analyzed adjusted deposit growth rates for the 33 “cited” banks and compared the growth figures with the averages for the remaining sample banks.
The data revealed no evidence of runs on the banks whose enforcement actions were reported in the press. As in all the other cases, the adjusted growth of total deposits at the cited banks was small (0.20 percent), positive, and statistically insignificant. As before, only about one-half of the “cited” banks suffered a runoff. Again, the growth rates for only two individual deposit categories (savings and large time) had the correct sign— though neither differed statistically from zero. Again, jumbo CDs were the most responsive deposit category (a 3.10 percent drop), yet the decline was still not large enough to suggest a run. Again, all of these results remained intact when we employed a different peer definition group. Finally, tests on differences of means could not rule out the possibility that the cited and non-cited banks had the same adjusted growth rates for total deposits, as well as for each individual deposit category.
One final possible explanation for the results is that a “change-in-control” effect offset the “depositor-run” effect. The announcement of a formal action reveals two pieces of information. First, the announcement reveals that serious safety-and-soundness problems exist at the bank. Depositors should greet this news with concern; it implies that failure is more likely. If sufficiently concerned about bank viability, depositors
might panic and run the bank. Second, the announcement reveals that a change in control has occurred; some portion of effective control has passed from the management team to bank supervisors. Depositors should welcome this news; it implies that a failure is less likely. In this case, depositors will be less apt to remove funds from the bank. It is possible that the change-in-control effect offsets the depositor-run effect, resulting in no observable change in adjusted deposit growth.
One way to measure the size of the change-in-control effect is to examine depositor responses to announcements at the subset of sample banks whose problems were well known. An enforcement action announcement should release little additional negative information about these institutions. Any observed changes in adjusted deposit growth rates should reflect only the change-in-control effect. Earlier we characterized a sample bank as “strong” if it boasted a return-on-asset ratio above zero, a nonperforming-loan-to-asset ratio below four percent, and an equity-to-nonperforming-loan-to-asset ratio above six percent as of its latest call report. Conversely, we now characterize a sample bank as “known to be weak” if it failed all three performance criteria. Eleven banks failed all three performance tests. Economically large and statistically significant deposit inflows into the weak banks would suggest that the change-in-control effect is potentially important and should not be neglected when interpreting adjusted deposit growth rates.
Evidence from the weak bank sub-sample did not support the conjecture that a large change in control effect explains the absence of runs. Irrespective of the peer group employed, adjusted deposit growth for the weak banks was not economically large or statistically significant. Indeed, the growth figures for the weak banks (0.83 percent) looked very much like the averages for the 87-bank sample as well as the averages for the
strong bank sub-sample (i.e., the subset of banks that passed all three performance tests). Moreover, formal tests revealed no significant differences between the adjusted growth rates at the 11 weak banks and 76 remaining banks, or between the 11 weak banks and the 33 strong banks. These patterns remained even when the definition of weak was expanded to include banks that failed two of three performance tests (thereby expanding the sub-sample from 11 to 32 banks).
In short, the evidence provided no support for claims by bank supervisors that disclosure of formal actions would trigger bank runs. Irrespective of the sub-sample or the peer group definition employed, the data showed no economically large or statistically significant deposit runoffs following announcements. Moreover, attempts to measure depositor reaction to changes in bank control suggest that offsetting change-in-control and safety-and-soundness effects do not account for the results.
VI. Evidence of Depositor Discipline
As noted, economists generally believe that confidential supervisory data should be put in the public domain on the grounds that the market will use this information to discipline risky institutions. We now test this claim for announcements of formal actions by examining changes in adjusted deposit growth and spreads over longer time horizons. Specifically, we define depositor discipline as economically significant declines in adjusted deposits at the sample banks and/or economically significant widening of adjusted deposit spreads in the quarters following the announcements. Tables 6 and 7 contain the deposit growth evidence. Tables 8 and 9 contain the spread evidence. As
before, Panel A in each table displays the figures for the sample banks using the original peer group to hold every other influence constant. Panel B shows the figures with the alternative peer group used for control. Panel C documents the adjusted changes for the sample banks following their last CAMEL downgrade. In each panel, column 3 contains the overall change in deposit spreads (change at the sample banks minus change at the peer banks); column 4 contains the standard deviation of the overall change, column 5 notes the statistical significance of the overall change; and column 6 indicates what percentage of the sample banks saw their adjusted spreads widen relative to their peers.
The deposit growth data for the one-quarter interval did not show evidence of depositor discipline. On average, adjusted total deposits at the sample banks actually
grew 0.51 percent, though this figure was statistically insignificant. Furthermore, only
about one-half of the sample banks experienced runoffs in total deposits. For the individual deposit categories, only the changes for transactions deposits (-0.74 percent) and large time deposits (-2.02 percent) had the correct sign, though again neither was statistically significant. The results with the alternative peer group were similar, though the breakout by individual categories showed a sign reversal on the change in large time deposits (now 1.12 percent, but still not significant). To put these figures in context, the sample banks experienced large (-6.99 percent), statistically significant (5 percent level) declines in jumbo CDs following their last CAMEL downgrades.
Evidence from the two-quarter interval did not support the depositor discipline hypothesis either. Adjusted total deposits at the sample banks did decline, but the figure was quite small (0.10 percent) and statistically insignificant. Again, only about one-half of the sample banks experienced runoffs in total deposits. For three of the four individual
categories—transactions deposits (-3.27 percent), savings deposits (-3.64 percent), and large time deposits (-6.52 percent)—changes in adjusted deposits had the correct sign. In addition, runoffs in these categories were larger than those observed over the one-quarter interval. Still, none of the changes differed statistically from zero. Moreover, the rather large runoff in jumbo CDs dropped significantly (to –1.61 percent) when the alternative peer group was employed as a control. Again to put the large time deposit figures in context, the sample banks suffered much larger (-12.87 percent), statistically significant (one percent level) runoffs in the wake of their last CAMEL downgrades.
To insure robustness, adjusted deposit growth rates were examined for the same sub-samples that we used in the bank run analysis. These sub-sub-samples included the banks with less than $1 billion in deposits, the banks with strong performance ratios as of their last call report submissions, the banks whose enforcement actions were reported in the press, and the banks with weak performance ratios as of their latest call reports. The results conformed to those obtained with the full sample. In short, we unearthed no evidence of market discipline from the deposit growth data.
Turning to spreads, the data for the one-quarter interval did not show evidence of depositor discipline. As noted, large, statistically significant increases in adjusted spreads following the announcements would be consistent with such discipline. On average, however, adjusted gross spreads narrowed 1 basis point in the quarter after disclosure,
though this dip was not statistically significant. Net spreads were unchanged. Only about one-half of the sample banks saw their gross or net adjusted spreads widen after the actions. Interestingly, jumbo CD spreads, which, in theory, should be the most likely to widen after the actions, were entirely responsible for the overall decline in gross spreads.
Indeed, adjusted jumbo-CD spreads narrowed 27 basis points when the original peer group was used as a control and 21 basis points when the alternative peer group was employed. Neither of these changes, however, was statistically significant. To put all of these spread results in context, adjusted spreads on jumbo CDs widened 62 basis points and adjusted gross spreads widened 37 basis points following the last CAMEL downgrades.
Changes in adjusted spreads over the two-quarter interval did not show evidence of depositor discipline either. Indeed, adjusted spreads for each of the individual deposit categories narrowed in the six months after the enforcement actions. The decline in
spreads on jumbo certificates of deposit (CDs) was the largest (40 basis points), proving significant at the 5 percent level. The dips in adjusted gross spreads (23 basis points) and adjusted net spreads (26 basis points) also proved statistically significant. Only about one-third of the sample banks saw their adjusted gross or net spreads widen after the actions. Using the alternative peer group yielded similar results, though the declines in spreads were only about half as large. In contrast to these figures, adjusted gross spreads
widened by 28 basis points in the six months following a CAMEL downgrade.
Again, to insure robustness, we examined changes in adjusted spreads for the various sub-samples used in the deposit growth analysis. These sub-samples included the banks with less than $1 billion in deposits, the banks with strong performance ratios as of their last call report submissions, the banks whose enforcement actions were reported in the press, and the banks with weak performance ratios as of their latest call reports. The results confirmed those obtained with the full sample. In short, we could find no evidence of depositor discipline in the deposit-spread data.
Because tests on changes in average yields have low power to detect changes in the
marginal cost of deposits, we examined changes in spreads for one additional
sub-sample—the banks with short average CD maturities. As noted by James (1988), banks holding deposits with longer average maturities roll over their portfolios less often. Consequently, the average yield on their deposits takes longer to adjust to new information. For this reason, we identified the subset of our sample with average jumbo CD maturities of less than six months; 24 banks met this criterion. The average maturities of the jumbo-CD portfolios at the original and alternative peer banks did not match the average maturities of the jumbo-CD portfolios at the 24 “short maturity” banks, so we controlled for seasonal and macroeconomic influences by identifying a new set of peer banks. This new set of peers included all U.S. banks with CAMEL 1 or 2 ratings, with weighted-average CD maturities under six months, with average assets of at least $25 million but no more than $2.5 billion (the asset range for the short maturity sub-sample), and with jumbo-CD holdings of at least $2.5 million but not more than $200 million (the range of jumbo-CD portfolio sizes for the short maturity sub-sample). The number of new peer banks varied from 1,063 to 6,630, depending on the quarter.
The short maturity sub-sample did not offer any evidence of depositor discipline. Indeed, in the quarter following the actions, adjusted jumbo-CD spreads narrowed, on
average, by 40 additional basis points, though this change was not statistically significant. Moreover, only 30 percent of the sub-sample experienced any widening in jumbo-CD spreads. Over the two-quarter interval, adjusted spreads narrowed by even more—58 basis points, a decline that proved significant at the 5 percent level.
VII. Discussion
The evidence offered no support for the fear that announcements of formal actions lead to bank runs. At the same time, the evidence also did not support the view that such announcements strengthen depositor discipline. Indeed, taken together, the evidence suggests that depositors did not care much about our sample actions. Figure 1 provides a visual summary of our results. It shows ordered pairs of changes in deposit growth and deposit spreads for the individual sample banks in the two-quarter interval following the announcements. Depositor discipline involves a relative decrease in the supply of deposits to the sample banks. Such a decrease would engender a decline in adjusted deposit growth and a widening of adjusted deposit spreads. In the figure, a cluster of points in quadrant II would be consistent with depositor discipline. Note that the observations are not clustered in quadrant II. Rather, most observations are clustered around the origin.
Although poor test design may account for some of our results, we are not inclined to dismiss them entirely. True, the tests were structured like event studies, yet the deposit series and interest expense series were much lower frequency than typical event study data. It is possible that other contaminating events offset depositor responses to the sample actions, particularly over the one- and two-quarter intervals. Still, the results were robust to a variety of sample cuts and peer-group definitions. Another potential criticism is that the relatively small sample sizes gave the tests low power. Even so, some changes in deposit growth and deposit spreads were significant. More importantly, even if one assumed infinitesimal standard deviations so that every change in growth rates and spreads was significant, the small magnitudes relative to those observed after
CAMEL downgrades still suggest that depositors cared little about the sample announcements.
One possible reason for the apparent indifference of insured depositors is that the increase in expected losses due to the announcement was less than the transactions costs and interest penalties associated with moving deposits. The cost of failure to depositors holding less than $100,000 is merely the inconvenience of delayed access to funds. These depositors may have perceived an increase in the probability of failure due to the action but did not withdraw their funds or demand higher interest rates because they considered the expected losses to be trivial.
Although the seeming indifference of uninsured depositors is more puzzling, we can think of three potential explanations. Perhaps large depositors were unable to extract a useful signal about bank condition from the press releases. The Federal Reserve announced the sample actions through short statements with no accompanying explanation. Moreover, the Fed refused, as a matter of policy, to answer questions about the actions. Another possibility is that uninsured depositors were slow to recognize that their funds were no longer protected from a failure. Most of the sample actions were concentrated in the early 1990s. In their study of subordinated debt yields, Flannery and Sorescu (1996) noted that sensitivity to bank risk increased gradually in the early 1990s as the government retreated from “too big to fail” guarantees and FDICIA shifted more of the burden of failure to uninsured claim-holders. One final potential explanation is that banking conditions improved so rapidly over the sample period that large depositors attached little importance to enforcement action announcements. In 1990, 159 banks failed in the U.S.; by 1997, this number had dropped to one. In such a robust banking
environment, news about formal actions may not have prompted uninsured depositors to reconsider their estimates of bank failure.
VIII. Conclusion
We examined depositor responses to public announcements of formal enforcement actions. The evidence suggests that banks under formal enforcement actions in the 1990s did not suffer deposit runoffs or significant increases in deposit costs. Indeed, it is hard to escape the conclusion that depositors did not care about the sample actions.
Our findings do not, however, imply that supervisors should discontinue the announcements. Rapidly improving banking conditions and a rapidly declining number of bank failures characterized our sample period. Depositors might find information about formal actions useful in a banking environment more like that of the 1980s. More importantly, depositors might find news about formal actions useful, irrespective of the condition of the banking sector, if the press releases contained more contextual information.
Our research does have implications for the debate over publicizing CAMELS scores. As noted, supervisors have historically opposed the release of any adverse
information gathered through examinations for fear of sparking costly runs. Our evidence demonstrates that the fears expressed by supervisors during the debate over disclosing formal actions were unfounded. The next logical step is to provide depositors with more contextual information about each formal action in an easy-to-understand
format. Then, should no runs occur, the debate could move on to the issue of CAMELS disclosure.
REFERENCES
Benston, George J. and George G. Kaufman. “FDICIA after Five Years.” Journal of Economic Perspectives 11, no. 3 (1997): 139-58.
Berger, Allen N., Richard J. Herring, and Giorgio P. Szego. “The Role of Capital in Financial Institutions.” Journal of Banking and Finance 19 (1995): 393-430.
Bernanke, Ben. S. “Nonmonetary Effects of the Financial Crises in the Propagation of the Great Depression.” American Economic Review 73 (1983): 257-276.
Curry, Timothy. “Chapter 12, Bank Examination and Enforcement.” In Federal Deposit Insurance Corporation, History of the Eighties, Lessons for the Future 1 (1997): 421-75.
Curry, Timothy J.; John O’ Keefe; Jane Coburn; and Lynne Montgomery. “Financially Distressed Banks: How Effective are Enforcement Actions in the Supervisory Monitoring Process.” Federal Deposit Insurance Corporation, Working Paper, May 4, 1999.
Flannery, Mark J., “Using Market Information in Prudential Bank Supervision: A Review of the U.S. Empirical Evidence.” Journal of Money, Credit and Banking 30 (1998): 273-305.
Flannery, Mark J. “Deposit Insurance Creates a Need for Bank Regulation.” Federal Reserve Bank of Philadelphia Business Review (January/February 1982): 17-27. Flannery, Mark J. and Sorin Sorescu. “Evidence of Bank Market Discipline in
Subordinated Debenture Yields: 1983-1991.” Journal of Finance 50 (1996): 1347-77.
Gilbert, R. Alton. “The Benefits of Annual Bank Examinations.” In Research in Financial Services: Private and Public Policy, ed. George G. Kaufman, 6 (1994): 215-48.
Gilbert, R. Alton. “The Effects of Legislating Prompt Corrective Action on the Bank Insurance Fund.” Federal Reserve Bank of St. Louis Review 74 no. 4 (1992): 3-22.
Gilbert, R. Alton, and L.A. Kochin. “Local Economic Effects of Bank Failures.”
Journal of Financial Services Research 3 (1989): 333-345.
Hall, John, R.; Andrew P. Meyer; and Mark D. Vaughan. “Do Equity Markets and Bank Supervisors View Risk Similarly? A Comparison of the Factors Affecting Market-Based Risk Measures and Regulators’ BOPEC Scores.” Supervisory Policy Analysis Working Paper, Federal Reserve Bank of St. Louis, December 1998.
Hall, John, R.; Thomas B. King; Andrew P. Meyer; and Mark D. Vaughan. “Do Certificate of Deposit Holders and Bank Supervisors View Risk Similarly? A Comparison of the Factors Affecting CD Default Premiums and CAMEL Scores.” Supervisory Policy Analysis Working Paper, Federal Reserve Bank of St. Louis, August 1999.
James, Christopher. “The Use of Loan Sales and Standby Letters of Credit by Commercial Banks.” Journal of Monetary Economics 22 (1988): 395-422.
Jordan, John S.; Joe Peek; and Eric S. Rosengren. “The Impact of Greater Bank Disclosure Amidst Banking Crises.” Federal Reserve Bank of Boston Working Paper, No. 99-1, February 1999.
Kane, Edward J. The S&L Mess: How Did It Happen? Washington, D.C.: Urban Institute Press, 1989.
Leander, Tom. “CNN Apologizes for Triggering Run on Thrift.” American Banker,
January 29, 1991.
Park Sangkyun and Stavros Peristiani. “Market Discipline by Thrift Depositors.”
Journal of Money, Credit and Banking 30 (1998): 347-64.
Peek, Joe and Eric S. Rosengren. “Banks and the Availability of Small Business Loans,” Working Paper No. 95-1, Federal Reserve Bank of Boston, January 1995 (a). Peek, Joe and Eric S. Rosengren. “Bank Regulation and the Credit Crunch,” Journal of
Banking and Finance 19 (1995): 679-92 (b).
Peek, Joe and Eric S. Rosengren. “Bank Regulatory Agreements and Real Estate Lending,” Real Estate Economics 24 (1996): 55-73.
Petersen, Mitchell A. and Raghuram G. Rajan. “The Benefits of Lending Relationships: Evidence from Small Business Data.” Journal of Finance 49 (1994): 3-37.
Slovin, Myron B.; Marie E. Shushka; and John A. Polonchek. “The Value of Bank Durability: Borrowers as Bank Stakeholders.” Journal of Finance 48 (1993): 247-266.
U.S. Congress, House Committee on Government Operations. “House Report No. 100-1088, Combating Fraud, Abuse, and Misconduct In The Nation’s Financial Institutions: Current Federal Efforts Are Inadequate.” U.S. Government Printing Office: Washington, D.C., 1988.
U.S. Congress, House Committee on Banking. “House Report No. 101-54(I), Financial Institutions Reform, Recovery, and Enforcement Act.” U.S. Government Printing Office: Washington, D.C., 1989.
Wilke, John R. “Fear Strikes Old Stone Depositors in Rhode Island, Prompting Many to Demand Cash Immediately.” The Wall Street Journal, January 28, 1991.
Table 1:Enforcement Actions Imposed by the Federal Reserve, 1990 – 1997
This table presents data on enforcement actions imposed by (or with the blessing of) the Federal Reserve System. Non-publicly disclosed actions include informal supervisory actions, such as Board Resolutions, Commitments, and Memoranda of Understanding, as well as non-final formal actions, such as Temporary Cease-and-Desist Orders and Orders of Investigation. The category "Other Non-Publicly Disclosed Actions" includes other informal actions initiated by Federal and state regulatory agencies to address supervisory concerns, including formal actions implemented by state agencies that are not enforceable under Section 8 of the Federal Deposit Insurance Act. Publicly disclosed actions include all final formal enforcement actions. The subset of publicly disclosed actions also includes Prohibition-and-Removal Orders. However, such actions are issued exclusively against institution-affiliated parties, which are not included in this study.
Non-Publicly Disclosed Actions
Action 1990 1991 1992 1993 1994 1995 1996 1997
Board Resolutions 90 129 123 130 79 67 60 26
Commitments 1 0 0 0 1 0 1 4
Memoranda of Understanding 69 84 113 60 38 27 11 9 Temporary Cease-and-Desist Orders 1 2 0 0 0 1 0 0 Orders of Investigation 0 0 0 0 0 1 4 0 Other Non-Publicly Disclosed Actions 44 59 52 34 14 6 6 0
Total Non-Public Enforcement Actions 205 274 288 224 132 102 82 39
Publicly Disclosed Actions
Action 1990 1991 1992 1993 1994 1995 1996 1997
Cease-and-Desist orders 8 17 20 11 10 0 1 1 Civil Money Penalties 2 2 5 2 2 0 0 0 Prompt Corrective Actions 0 0 0 2 1 0 1 0 Written Agreements 27 44 51 26 9 13 8 2
Total Public Enforcement Actions 37 63 76 41 22 13 10 3
Total Enforcement Actions 242 337 364 265 154 115 92 42
State Member Banks in the U.S. 991 957 942 955 961 1,028 1,001 977
Table 2: Description of the Sample
This table presents data on the sample banks and the formal actions imposed on the sample banks. Although the sample was not constructed to be representative, it matched the universe of U.S. banks and Federal Reserve enforcement actions reasonably well. The sample actions, like most of the enforcement actions in the 1990s, were concentrated in the first part of the decade; 81 of the 87 actions were imposed before 1995 (see Panel A). The sample banks, like most U.S. banks, were small—65 of the 87 actions were imposed on banks with less than $250 million in assets (see Panel B). The subject banks were geographically dispersed, representing 25 states and each of the nine U.S. census regions except the Pacific Northwest (see Panel C). Finally, like most formal actions in the 1990s, most of the sample actions were written agreements (60), but a nontrivial number were cease-and-desist orders (see Panel D).
Panel A: Number of Banks (Enforcement Actions) by Year
Year Number of Banks (Enforcement Actions)
1990 5 1991 19 1992 34 1993 12 1994 11 1995 4 1996 1 1997 1
Panel B: Size of the Banks Subject to the Sample Enforcement Actions (Total deposits as of the week prior to the announcement) Range of Deposits
(millions of dollars) Number of Banks
$0 to $25 0 $25 to $50 9 $50 to $75 20 $75 to $100 10 $100 to $250 26 $250 to $500 7 $500 to $1,000 7 $1,000 to $2,000 4 $2,000 to $5,000 4 Over $5,000 0