PETR BERKA
University of Finance and Administration, Prague, Czech Republic Abstract. It becomes a good habit to organize a data mining cup, a competition or a challenge at machine learning or data mining conferences. Such events can be used for comparison of various approaches and algorithms, they give the participants a possibility to access and analyze real-world data, and they can result in knowledge interesting for the domain experts who provided the data. The paper describes our experience gained when organizing and evaluating the data mining challenges during European Conferences on Data Mining and Machine Learning. It shows the challenge settings, describes the used data and the solved tasks and summarizes the lessons learned.
1
Introduction
It becomes a good habit to organize a data mining cup, a competition or a challenge at machine learning or data mining conferences. Such events serve several purposes: they can be used for comparison of various approaches and algorithms, they give the participants a possibility to access and analyze real-world data, and they can result in a knowledge interesting for the domain experts who provided the data.
Cups and competitions are usually organized around a clearly specified classification problem. The participants are provided with pre-classified training data and a set of examples to be classified. The goal is to build a model that will perform well on the evaluation data. The models are then ranked according to their performance and the winners (sometimes also the losers) are announced. Thus the first purpose is stressed. Let us mention here e.g. the COIL2000 competition [6], the EUNITE2001 competition and, of course, the KDD cups held since 1997 [1].
Challenges have a less competitive nature. The aim here is to prepare conditions of a real/realistic data mining problem (classification or description) and to find a solution. The results are then discussed with the domain experts. This kind of events is organized e.g. at the European [4] or Pacific-Asian (e.g. [7]) KDD conferences.
2
ECML/PKDD Discovery Challenges
The main idea of the Discovery Challenge organized at the European Conferences on Principles and Practice of Knowledge Discovery in Databases since 1999 [2] was to encourage a collaborative research effort, a broad and unified view of knowledge and methods of discovery, and emphasis on business problems and solutions to those problems.
During the Discovery Challenges we have organized in the years 1999-2005, different data sets have been used. One data set was taken from a financial domain (data about accounts of clients of a bank), two data sets were taken from various areas of medicine (data about patients with collagen diseases, data about patients with atherosclerosis, and data about patients with hepatitis) and one data set was taken from the e-commerce area (data about visits of an e-shop). Although the data came from very different domains, they shared some common features. The participants were faced with multi-relational problem with a mixture of static data (characteristics of clients or patients) and dynamic data (transactions or laboratory tests and examinations). Our aim was to follow as closely as possible a real KDD process, so An ideal contribution thus included
• the proposed business objectives (goals that may be of interest to database users), • a brief summary of data mining effort; this summary may include the data
• preprocessing tasks like data extraction, sampling, data integration and homogenization, data cleaning, data transformation, the data mining step as well as the evaluation criteria approved,
• presentation of the discovered knowledge, and
• an explanation for database users how they can apply the discovered knowledge.
Nevertheless the challenge conditions differed from conditions of a real KDD projects in two main points. The time for analysis was rather short (about two or three months), and the participants have only indirect (if any) access to domain experts.
Year topic/data
1999 financial data, collagen diseases 2000 financial data, collagen diseases 2001 collagen diseases
2002 atherosclerosis data, hepatitis data 2003 atherosclerosis data, hepatitis data
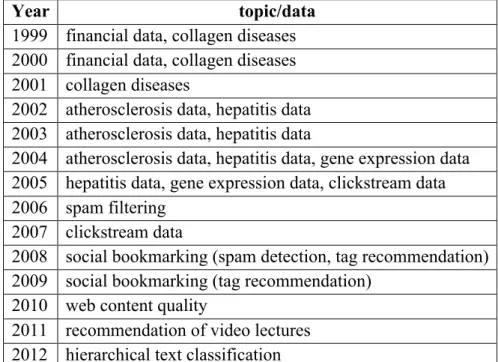
2004 atherosclerosis data, hepatitis data, gene expression data 2005 hepatitis data, gene expression data, clickstream data 2006 spam filtering
2007 clickstream data
2008 social bookmarking (spam detection, tag recommendation) 2009 social bookmarking (tag recommendation)
2010 web content quality
2011 recommendation of video lectures 2012 hierarchical text classification
Tab. 1 ECML/PKDD Discovery Challenge topics
2.1 Challenge on the Financial Data Real Background
The data mining project for a Czech bank (for confidence reasons we are not allowed to give the name of the bank) was a kind of a promotional pilot study that should demonstrate
the abilities of machine learning and data mining methods. The business goal of this study was to better understand the behavior of clients of the bank. The domain experts were not aware of the benefits of data mining technologies, so they could not give us a clear problem. We turned their vague ideas into a data mining goal of defining and describing various categories of clients according to the character of their debt. We used our experience from this project when preparing the Discovery Challenge on financial data.
Realistic Setting
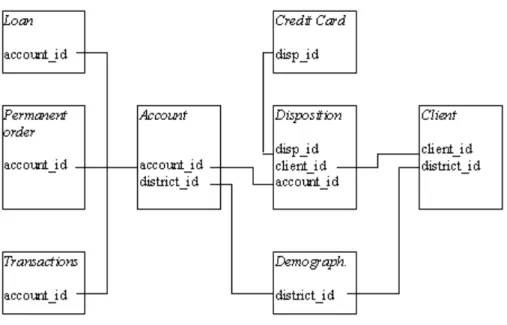
The data for the Financial Challenge consist of 8 tables describing clients of a bank, their accounts, transactions, permanent orders, granted loans and issued credit cards. Each account has both static characteristics (e.g. date of creation, address of the branch) given in relation ”account” and dynamic characteristics (e.g. payments debited or credited, balances) given in relations ”permanent order” and ”transaction”. Relation ”client” describes characteristics of persons who can manipulate with the accounts. One client can have more accounts, more clients can manipulate with single account; clients and accounts are related together in relation ”disposition”. Relations ”loan” and ”credit card” describe some services which the bank offers to its clients; more credit cards can be issued to an account, at most one loan can be granted for an account. Relation ”demographic data” gives some publicly available information about the districts.
No explicit problem was given for the analysis, nevertheless, two implicit classification tasks can be found in the structure of the data: classifying clients according to loans (running loans with no problems, running loans with client in debt, finished contract with loan paid off, finished contract with loan not paid) and according to credit cards (does not own credit card, owns junior card, owns classic card, owns gold card). As in the real data, the classes were highly unbalanced. Only 15% of clients had loan contracts, out of them only 11% loans were with problems (running or finished). Similar proportions hold for the credit cards: only 20% clients used credit cards, out of them only 10% (2% of all clients) used gold cards.
Prototype Solutions
We can distinguish two basic types of these contributions. The ”method/algorithm oriented” papers focused on describing a new approach or system and used the data more or less for demonstration of the functionality of the method. The ”problem oriented” papers tried to formulate (and solve) a problem that could be interesting for end users or domain experts. Whereas the first type of papers can be written ”domain independent”, the second type of papers requires deeper understanding of the domain. This could be the reason for the fact that most papers fall into the first category.
Most of the analysis was oriented on classification of loans or credit cards. There were also some interesting results of client segmentation and profiling based on transactions, and of discovering spatio-temporal patterns in behavior of different branches of the bank. Most participants used symbolic machine learning methods (association rules, decision rules or decision trees).
Fig. 1 Structure of the financial data
Tab. 2 Financial data challenge analyses [2]
Paper Task Method
1 loans classification association rules
2 loans and credit cards classification association rules, ranking examples 3 relations among branches ILP
4 loan classification classification rules 5 initial insight
6 credit cards classification deviation detection, k-NN 7 loans classification visualization of correlations 8 loans and credit cards description association rules
9 loans classification association rules, tree
10 client profiling SOM, tree
2.2 Challenge on the Atherosclerosis Data The Problem
Atherosclerosis is a total complicated disease of the vessels in all organisms. It is a dynamic process that begins in childhood and adolescence and continues for the whole life. The experts’ opinions on the origin and progress of the disease are developing. Interaction and influence of genetic predisposition and exterior environment as well as of so-called risk factors is considered. On the other hand there are some so-called protective factors.
In the early seventies of the twentieth century, a project of extensive epidemiological study of atherosclerosis primary prevention was developed under the name National Preventive Multi-factor Study of Heart Attacks and Strokes in the former Czechoslovakia. The study included data of more than 1 400 men born between 1926–1937 and living in Prague 2. The men were divided according to presence of risk factors, overall health conditions and ECG result into the following three groups: normal, risk and pathological. The aims of the study were:
1. Identify atherosclerosis risk factors prevalence in a population generally considered to be the most endangered by possible atherosclerosis complications, i.e. middle aged men.
2. Follow the development of these risk factors and their impact on the examined men’s health, especially with respect to atherosclerotic cardiovascular diseases.
3. Study the impact of complex risk factors intervention on their development and cardiovascular morbidity and mortality.
4. 10–12 years into the study, compare risk factors profile and health of the selected men, who originally did not show any atherosclerosis risk factors with a group of men showing risk factors from the beginning of the study.
The Data
STULONG is the data set concerning the twenty years lasting longitudinal study of the risk factors of atherosclerosis in the population of 1 417 middle aged men. For the Discovery Challenges, four data files have been used:
• The file ENTRY contains values of 64 attributes obtained from entry examinations; these attributes are either codes or results of measurements of different variables or results of transformations of the rest of the 244 attributes actually surveyed for each patient.
• Risk factors and clinical demonstration of atherosclerosis have been followed during the control examination for 20 years. The file CONTROL contains results of observation of 66 attributes recorded during these control examinations (10 572 records).
• Additional information about health status of 403 men was collected by the postal questionnaire. Resulting values of 62 attributes are stored in the file LETTER.
• There are 5 attributes concerning death of 389 patients. Values of these attributes are stored in the file DEATH.
Fig. 2 Structure of the atherosclerosis data The Data Mining Tasks
The listed analytic questions (possible tasks), which have not been subjected to study yet, can be divided into four groups:
• analytic questions related to the entry examination (what are the relations between social factors, or physical activity, or alcohol consumption and the risk factors),
• analytic questions related to the long-term observation (are there any differences between men of the two risk subgroups RGI, RGC, who came down with the observed cardiovascular diseases in the course of 20 years and those who stayed healthy),
• analytic questions concerning postal questionnaire,
• analytic questions concerning entry examination, long-term observation and death The descriptive tasks – associations or segmentation (subgroup discovery), are used if the main purpose of the data mining is to find some relation between attributes or examples. As the analytic questions suggest to focus on mining for descriptive models, different forms of association rules were the results of most analyses. Classification (and regression) tasks are used if the main purpose of the data mining is to build a model that can be used for decision or decision support. The classification tasks performed on STULONG data deal either with classifying patients into the three predefined groups normal, risk or pathological or with classifying them into classes derived from the data. The experts preferred the results of description tasks in favor of the results of classification tasks. Even if the found associations were often no surprise, they were better accepted than the less understandable classification models. Entry 1417x64 Control 10572x66 Letter 403x62 Death389x5
2.3 Challenge on the Click-stream Data The problem domain
The daily access to an Internet Web site can today easily rise to a number of access in millions of pages, executed by a large amount of users spread all over the world. Web usage mining [9] is the application of data mining technologies on large logs files, collected from Web servers accesses. Examples of such applications include: improvements of web sites design, system performance analyses as well as network communications, understanding user reaction and motivation, automated clustering and building adaptive web sites
The data
The data used for analysis consist of a log file from a Czech e-shop containing more than 3 million records of page visits (traffic of one month) in the structure shown in Fig. 3. Beside this, detailed information about the meaning of various variables is stored in several tables. The table “shop” gives the (anonymous) name of the internet shop (7 entries), table ”category” gives the info about category of products (64 entries), table “sheet” gives the info about a specific product of a more detailed type (157 entries), table “brand” gives the name of the producer or brand of a product (197 entries) and table “theme” gives the info about themes discussed in the on-line advice (36 entries).
The main issue when analyzing log file is to identify the so called click-streams, i.e. the sequence of page views (web pages) visited by a single user during one visit. To identify a single user is not an easy task due to the fact that he can use different machines (even public ones) or can be “hidden” behind a fire wall; so IP address cannot be used for identification of a person. So some heuristics based on time spent during a visit are used instead.
Fig. 3 Structure of the atherosclerosis data The Data Mining Tasks
Following tasks have been solved by different participants in the challenge: visualizing the clickstream data with multidimensional scaling, clustering of customers based on the visited pages, visitor profiling according to the click-stream sequences, anomaly detection in the click-stream behavior, prediction next page in the clickstream sequence, associations between visited pages, similarity between sequences.
2.4 Common features of the challenge data
Despite the great variety of domains of the described discovery challenges (finance, medicine, e-commerce), we can identify some common features of the analyzed data. The data have multi-relational structure with a mixture of categorical and numeric attributes, some of them being static (basic characteristics of clients, patients or users), some being time
unix time ;IP address ; session ID ; page request; referee 1074589200;193.179.144.2 ;1993441e8a0a4d7a4407ed9554b64ed1;/dp/?id=124 ;www.google.cz; 1074589201;194.213.35.234;3995b2c0599f1782e2b40582823b1c94;/dp/?id=182 ;
1074589202;194.138.39.56 ;2fd3213f2edaf82b27562d28a2a747aa;/ ;www.seznam.cz; 1074589233;193.179.144.2 ;1993441e8a0a4d7a4407ed9554b64ed1;/dp/?id=148 ;/dp/?id=124; 1074589245;193.179.144.2 ;1993441e8a0a4d7a4407ed9554b64ed1;/sb/ ;/dp/?id=148; 1074589248;194.138.39.56 ;2fd3213f2edaf82b27562d28a2a747aa;/contacts/ ; /;
dependent (transactions on accounts, results of examinations, visited pages), with imbalanced classes and a lot of missing values. This brings number of problems for the data pre-processing step of the whole mining task.
3
Lessons Learned
Let us summarize the lessons we have learned from both our real analyses and the challenge results [6]. We will give some conditions we believe that must be fulfilled in a successful data mining project:
Cooperate with Domain Experts: The main drawback of successful applications of expert (knowledge-based) systems is the so called knowledge acquisition bottleneck. This term was used for the tedious and time consuming process of knowledge elicitation from human experts. Many people expected, that machine learning techniques would automate the knowledge acquisition process and thus would exclude experts form the process of building models. The experience from real knowledge discovery projects shows that experts did not disappear from the knowledge acquisition (modeling) process. Only their role has changed. In real-world data mining, we can observe a problem we can call ”data acquisition bottleneck”. The most difficult steps of the KDD process are problem understanding, data understanding and data preparation. In real-world problems, we need experts who help with understanding the domain, with understanding the problem, with understanding the data.
Use external data if possible: There are many external factors that are not directly collected for the data mining task, but can have a large impact on thedata analysis.
Use knowledge-intensive preprocessing methods: The aim of data preprocessing step is (1) to find (or create) in the available data the information relevant for the data mining task and (2) to represent it in a way suitable for the data mining algorithm. It is well known, that this step takes the most time in the whole KDD process and has (together with domain and data understanding) the main impact on successful modeling. As illustrated by the financial challenge, typical preprocessing actions are joining tables, aggregation, discretization and grouping, handling missing values, creating new attributes. Very often, these operations are performed domain independent. More background knowledge based on domain and data understanding should be used in these transformations.
Look for simple models first: One of the common sources of misunderstanding between domain experts and data mining experts is that data mining experts are interested in applying their sophisticated algorithms and domain experts are interested in simple results. Sometimes even “simple” reporting and summarization gives acceptable results. Make the results understandable and/or acceptable: The crucial point for success of a data
mining application on real-world problem is the acceptance of results by the domain experts and potential users. The best solution is worthless if it is not used. Understandability of results is the keyword for this lesson. Domain experts are not interested in tables showing improvement of accuracy of 2.47% or in lists of thousands of rules. They want to know the strengths and limitations of the classifiers or insight into found patterns. So explanation of the results, post-processing or visualization is of great importance.
Show some preliminary results soon: To convince the domain experts (and the managers as well) about the usefulness of data mining methods, some preliminary results should be delivered in the early stage of the project. Even an initial data exploration can be very
appreciated. Experts and end-users are interested in solutions not in applying (and playing with) sophisticated methods.
Assess the ROI of the models: The experts and users are interested in the benefit, the models bring when applying and deploying them. This can be better expressed as return of investment (ROI) rather than as classification accuracy.
4
Conclusions
The reusability of successful data mining solutions can help in new data mining projects. This fact has been recognized by the machine learning and data mining communities. An example for this is the EU research project MiningMart (IST-1999-11993) aiming on collecting solutions of business problems with emphasis on preprocessing [5]. Discovery challenges can provide a workbench for finding such prototype solutions of realistic problems. The Challenge participants had the opportunity to analyze large real-world data and to test and present their approach. They gained a hands-on experience with realistic data mining projects. Such experience can motivate further research. The tasks formulated and solved in the Challenge can be reused in similar domains.
Literature
1. ACM KDD Cup. http://www.sigkdd.org/kddcup/index.php (Accessed on 7 September 2012)
2. Berka, P. (Ed.): Workshop Notes on Discovery Challenge. 3rd European Conference on Principles and Practice of Knowledge Discovery in Databases. University of Economics, Prague, 1999.
3. Berka,P, Rauch,J., Tomečková,M.: Lessons Learned from the ECML/PKDD Discovery Challenge on the Atherosclerosis Risk Factors Data. Computing and Informatics, Vol. 26, No. 3, 2007, 329-344
4. European Conference on Machine Learning and Principles and Practice of Knowledge Discovery in Databases. http://www.ecmlpkdd.org (Accessed on 7 September 2012) 5. Kietz, J. U., Zucker, R,. Vaduva, A.: Mining Mart: Combining Case-Based-Reasoning
and Multi- Strategy Learning into a Framework to reuse KDDApplication. In: Proc. 5th Int. Workshop on Multistrategy Learning MSL2000, 2000.
6. Putten, P., Someren, M (Eds.): CoIL Challenge 2000: The Insurance Company Case. Technical Report 2000-09. Leiden Institute of Advanced Computer Science, 2000.
7. Suzuki, E. (Ed.): Proceedings of Int. Workshop of KDD Challenge on Real world Data.
4th Pacific-Asia Conference on Knowledge Discovery and Data Mining PAKDD-2000, Kyoto, 2000.
Contact data:
Prof. Ing. Petr Berka, CSc.
University of Finance and Administration, Estonska 500, 10100 Praha 10, Czech Republic