Novel “
Anti
-Bayesian” Techniques
⋆B. John Oommen1⋆⋆, Richard Khoury2 ⋆ ⋆ ⋆, and Aron Schmidt2 †
1
School of Computer Science, Carleton University, Ottawa, Canada: K1S 5B6.
2
Dept. of Software Engg., Lakehead University, Thunder Bay, Canada: P7B 5E1.
Abstract. This paper presents a non-traditional “Anti-Bayesian”
solu-tion for the tradisolu-tional Text Classificasolu-tion (TC) problem. Historically, all the recorded TC schemes work using the fundamental paradigm that once the statistical features are inferred from the syntactic/semantic indicators, the classifiers themselves are the well-established statistical ones. In this paper, we shall demonstrate that by virtue of the skewed distributions of the features, one could advantageously work with in-formation latent in certain “non-central” quantiles (i.e., those distant from the mean) of the distributions. We, indeed, demonstrate that such classifiers exist and are attainable, and show that the design and imple-mentation of such schemes work with the recently-introduced paradigm of Quantile Statistics (QS)-based classifiers. These classifiers, referred to as Classification by Moments of Quantile Statistics (CMQS), are es-sentially “Anti”-Bayesian in theirmodus operandi. To achieve our goal, in this paper we demonstrate the power and potential of CMQS to de-scribe theveryhigh-dimensional TC-related vector spaces in terms of a limited number of “outlier-based” statistics. Thereafter, the PR task in classification invokes the CMQS classifier for the underlying multi-class problem by using a linear number of pair-wise CMQS-based classifiers. By a rigorous testing on the standard 20-Newsgroups corpus we show that CMQS-based TC attains accuracy that is comparable to the best-reported classifiers. We also propose the potential of fusing the results of a CMQS-based method with those obtained from a traditional scheme.
Keywords : Text Classification, Quantile Statistics (QS), Classification by
the Moments of QS (CMQS)
1
Introduction
This paper presents a non-traditional and totally novel solution to the problem of Text Classification (TC). TC is the challenge of associating a given unknown
⋆
The authors are grateful for the partial support provided by NSERC, the Natural Sciences and Engineering Research Council of Canada.
⋆⋆ Chancellor’s Professor; Fellow: IEEE and Fellow: IAPR. This author is also an Adjunct Professorwith the University of Agder in Grimstad, Norway. E-mail address:
⋆ ⋆ ⋆E-mail address:[email protected].
†E-mail address:
text document with a category selected from a predefined set of categories (or classes) based on its content. As opposed to this, statistical Pattern recognition
(PR) is the process by which unknownstatisticalfeature vectors are categorized
into groups or classes based on their statistical components [?]. The field of
statistical PR has been so well developed that it is not necessary for us to survey the field here. Suffice it to mention that all the recorded TC schemes work using the fundamental paradigm that once the statistical features are inferred
from thesyntactic or semanticindicators, the classifiers themselves are the
well-establishedstatistical, neural or fuzzy ones such as the Bayesian, Na¨ıve Bayesian,
Linear Discriminant, the SVM, the Back-propagation etc.
The TC problem has been studied since the 1960’s [?], but it has taken a
special importance in recent years as the sheer amount of text available has in-creased super-exponentially – thanks to the internet, text-based communications such as e-mail, tweets and text messages, and the numerous book-digitization projects that have been undertaken by the various publishing houses. Over the
decades, many approaches3
have been proposed to accomplish this goal. When it concerns classification and PR, the TC problem is particularly interesting both from an academic and a research perspective. This is because, whereas the
fea-tures in TC are derived fromsyntactic or semanticindicators, the classification,
in and of itself, is based onstatistical, neural or fuzzy strategies.
The goal of this paper is to show that we can achieve TC using “Anti”-Bayesian quantile statistics-based classifiers which only use information con-tained in, let us say, non-central quantiles (which are sometimes outliers) of the distributions, and that it can do this by operating with a philosophy that is totally contrary to the acclaimed Bayesian paradigm. Indeed, the fact that such a classification can be achieved is, strictly speaking, not easy to fathom.
To motivate this paper and to place its contribution the right context, we present the following simple example. Consider the problem of distinguishing a
document that belongs to one of two classes, namely, Sports or Business. It is
obvious that one can trivially distinguish them if we merely considered those words which occurred frequently in one class and not the other, for example,
“football” and “basketball”versus“dollars” and “euros”. Our hypothesis is that
it is notmerelythese truly “distinguishing” words that possess “discriminating”
capabilities. We intend to demonstrate that there are “outliers” quantiles of the words which occur in both categories, and which also can be used to achieve the classification. Hopefully, this would be both a pioneering and remarkable result. It should, first of all, be highlighted that we do not intend to obtain a
clas-sification that surpasses the behavior of the scheme that involves a Bayesian
strategy invoking the truly “distinguishing” words. Attempting to do this would be tantamount to accomplishing the impossible, because the Bayesian approach
3
Due to space limitations, it is impossible to survey the field of TC here. The unabridged version of this paper [?] contains a more detailed survey of the field and
includes the preliminaries of the Vector Space model, the Bag-of-Words (BoW), the Term Frequency (TF), the Term Frequency-Inverse Document Frequency (TFIDF) weighting schemes, and the Cosine Similarity metric etc. [?,?].
maximizes the a posteriori probability and it thus yields the optimal hallmark classifier. What we endeavor to do is to show that if we use the above-mentioned non-central quantiles and work within an “Anti”-Bayesian paradigm using only
these quantile statistics, we can obtain accuracies comparable to this optimal hallmark! Indeed, we demonstrate that a near-optimal solution can be obtained
by invoking counter-intuitive features when they are coupled with a
counter-intuitive PR paradigm.
As a backdrop, we note that the basic concept of traditional parametric
classification is to model the classes based on the assumptions related to the
underlying class distributions, and this has been historically accomplished by
performing a learning phase in which the moments, i.e, the mean, variance etc. of the respective classes are evaluated. However, there have been some families of indicators (or distinguishing quantifiers) that were until recently, noticeably,
uninvestigatedin the PR literature. Specifically, we refer to the use of phenomena
that have utilized the properties of theQuantile Statistics (QS) of the
distribu-tions. This has led to the “Anti”-Bayesian methodology alluded to.
1.1 Contributions of this Paper
The novel contributions of this paper are:
– To demonstrate that text and document classification can be achieved using
an “Anti”-Bayesian methodology;
– To show that this “Anti”-Bayesian PR can be achieved using syntactic
in-formation that that has not been used in the literature before, namely the information contained in the symmetric quantiles of the distributions, and which are traditionally considered to be “outlier”-based;
– To show that the results of our “Anti”-Bayesian PR is not highly correlated
with the results of any of the traditional TC schemes, implying that one can use it in conjunction with a traditional TC scheme for an ensemble-based classifier;
– To suggest that a strategy that incorporates the fusion of the features and
methodology proposed here and the distinct ones from the state-of-the-art has great potential. This is an avenue that we will explore in future research. As in the case of the quantile-based PR results, to the best of our knowledge, the pioneering nature and novelty of these TC results hold true.
2
Background: Traditional Text Classifiers
Apart from the methods presented above, many authors have also looked at ways of enhancing the document and class representation by including not only
words but also bigrams, trigrams, and n-grams in order to capture common
multi-word expressions used in the text [?]. Likewise, character n-grams can
be used to capture more subtle class distinctions, such as the distinctive styles of different authors for authorship classification. While these approaches have, so far, considered ways to enrich the representation of the text in the word
vector, other authors have attempted to augment the text itself by adding extra information into it, such as synonyms of the words taken from a thesaurus, be it a specialized custom-made one for a project such as the affective-word thesaurus
built in [?], or, more commonly, the more general-purpose linguistic ontology,
WordNet[?].
Adding another generalization step, it is increasingly common to enrich the
text not only with synonymous words but also with synonymousconcepts, taken
from domain-specific ontologies [?] or from Wikipedia [?]. Meanwhile, in an
opposing research direction, some authors prefer to simplify the text and its representation by reducing the number of words in the vectors, typically by grouping synonymous words together using a Latent Semantic Analysis (LSA) system or by eliminating words that contribute little to differentiating classes
as indicated by a Principal Component Analysis (PCA) [?]. Other authors have
looked at improving classification by mathematically transforming the sparse and noisy category word space into a more dense and meaningful space. A pop-ular approach in this family involves Singpop-ular Value Decomposition (SVD), a projection method in which the vectors of co-occurring words would project in similar orientations, while words that occur in different categories would be pro-jected in different orientations.This is often done before applying LSA or PCA modules to improve their accuracy. Likewise, authors can transform the word-count space to a probabilistic space that represents the likelihood of observing a word in a document of a given category. This is then used to build a probabilistic
classifier, such as the popular Na¨ıve-Bayes’ classifier [?], to classify the text into
the most probable category given the words it contains.
An underlying assumption shared by all the approaches presented above is that one can classify documents by comparing them to a representation of what an average or typical document of the category should look like. This is im-mediately evident with the BOW approach, where the category vector is built from average word counts obtained from a set of representative documents, and then compared to the set of representative documents of other categories to compute the corresponding similarity metric. Likewise, the probabilities in the Na¨ıve-Bayes’ classifier and other probability-based classifiers are built from a corpus of typical documents and represent a general rule for the category, with the underlying assumption that the more a specific document differs from this general rule, the less probable it is that it belongs to the category. The addition of information from a linguistic resource such as a thesaurus or an ontology is also based on this assumption, in two ways. First, the act itself is meant to add words and concepts that are missing from the specific document and thus make it more like a typical document of the category. Secondly, the development of these resources is meant to capture general-case rules of language and knowl-edge, such as “these words are typically used synonymously” or “these concepts are usually seen as being related to each other.”
The method we propose in this paper is meant to break away from this assumption, and to explore the question of whether there is information usable for classification outside of the norm, at “the edges (or fringes) of the word distributions”, which has been ignored, so far, in the literature.
3
CMQS-based Text Classifiers
3.1 How Uni-dimensional“Anti”-Bayesian Classification Works
We shall first describe how uni-dimensional “Anti”-Bayesian classification works, and then proceed to explain how it can be applied to TC, which, by definition, involves PR in a highly multi-dimensional feature space. Classification by the
Moments of Quantile Statistics4, (CMQS) is the PR paradigm which utilizes
QS in a pioneering manner to achieve optimal (or near-optimal) accuracies for various classification problems. Rather than work with “traditional” statistics (or
even sufficient statistics), the authors of [?] showed that the set ofdistantquantile
statistics of a distribution do, indeed, have discriminatory capabilities. Thus, as aprima faciecase, they demonstrated how a generic classifier could be developed for any uni-dimensional distribution. Then, to be more specific, they designed the classification methodology for the Uniform distribution, using which the analogous classifiers for other symmetric distributions were subsequently created. The results obtained were for symmetric distributions, and the classification accuracy of the CMQS classifier exactly attained the optimal Bayes’ bound. In
cases where the symmetrtic QS values crossed each other, one invokes a dual
classifier to attain the same accuracy.
Unlike the traditional methods used in PR, one must emphasize the fasci-nating aspect that CMQS is essentially “Anti”-Bayesian in its nature. Indeed, in CMQS, the classification is performed in a counter-intuitive manner i.e., by
com-paring the testing sample to a few samplesdistant from the mean, as opposed to
the Bayesian approach in which comparisons are made, using the Euclidean or
a Mahalonibis-like metric, to centralpoints of the distributions. Thus, opposed
to a Bayesian philosophy, in CMQS, the points against which the comparisons are made are located at the positions where the Cumulative Distribution
Func-tion (CDF) attains the percentile/quantile values of 2
3 and 1
3, or more generally,
where the CDF attains the percentile/quantile values of n−k+1
n+1 and k n+1.
In [?], the authors built on the results from [?] and considered various
symmetric and asymmetric uni-dimensional distributions within the
exponen-tial family such as the Rayleigh, Gamma, and Beta distributions. They again proved that CMQS had an accuracy that attained the Bayes’ bound for sym-metric distributions, and that it was very close to the optimal for asymsym-metric distributions.
3.2 TC: A Multi-dimensional “Anti”-Bayesian Problem
Any problem that deals with TC must operate in a space that is very high dimensional primarily the because cardinality of the BOW can be very large. This, in and of itself, complicates the QS-based paradigm. Indeed, since we are speaking about the quantile statistics of a distribution, it implicitly and explicitly
4
The authors of [?], [?] and [?] (cited in their chronological order) had initially
proposed their theoretical and experimental results as being based on the Order -Statistics of the distributions. This was later corrected in [?], where they showed
assumes that the points can be ordered. Consequently, the multi-dimensional generalization of CMQS, theoretically and with regard to implementation, is particularly non-trivial because there is no well-established method for achieving the ordering of multi-dimensional data specified in terms of its uni-dimensional components.
To clarify this, consider two patterns, x1 = [x11, x12]T = [2,3]T and x2 =
[x21, x22]T = [1,4]T. If we only considered the first dimension, x21 would be
the first QS since x11 > x21. However, if we observe the second component of
the patterns, we can see that x12 would be the first QS. It is thus, clearly, not
possible to obtain the ordering of the vectorial representation of the patterns
based on their individual components, which is the fundamental issue to be resolved before the problem can be tackled in any satisfactory manner for multi-dimensional features. One can only imagine how much more complex this issue is in the TC domain – when the number of elements in the BOW is of the order of hundreds or even thousands.
To resolve this, multi-dimensional CQMS operates with a paradigm that is
analogous to a Na¨ıve-Bayes’ approach, although it, really, is of an Anti
-Na¨ıve-Bayes’ paradigm. Using such aAnti-Na¨ıve-Bayes’ approach, one can design and
implement a CMQS-based classifier. The details of this design and implementa-tion for two and multi-dimensions (and the associated conclusive experimental
results) have been given in [?]. Indeed, on a deeper examination of these
re-sults, one will appreciate the fact that the higher-dimensional results for the various distributions do not necessarily follow as a consequence of the lower uni-dimensional results. They hold by virtue of the factorizability of the
multi-dimensional density functions that follow theAnti-Na¨ıve-Bayes’ paradigm, and
the fact that thed-dimensional QS-based statistics are concurrently used for the
classification in every dimension.
3.3 Design and Implementation: “Anti”-Bayesian TC Solution
“Anti”-Bayesian TC Solution: The Features Each class is represented by
two BOW vectors, one for each CMQS point used. For each class, we compute the frequency distribution of each word in each document in that class, and generate a frequency histogram for that word. While the traditional BOW approach would then pick the average value of this histogram, our method computes the area of the histogram and determines the two symmetric QS points. Thus, for example,
if we are considering the 2
7 and 5
7 QS points of the two distributions, we would
pick the word frequencies that encompass the 2
7 and 5
7 of the histogram area
respectively. The reader must observe the salient characteristic of this strategy: By working with such a methodology, for each word in the BOW, we represent the class by two of its non-central cases, rather than its average/median sample. This renders the strategy to be “Anti”-Bayesian!
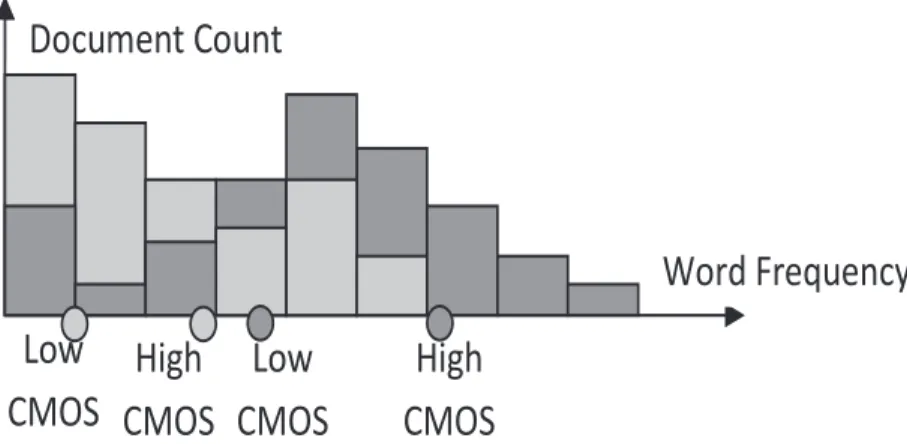
For further clarity, we refer the reader to Figure??. For any word, the
his-tograms of the two classes are depicted in light grey for the lower class, and in dark grey for the higher class. The QS-based features for the classes are then extracted from the histograms as clarified in the figure.
Word Frequency
Document Count
Low
CMOS
Low
CMOS
w
OS
Lo
CM
High
CMOS
High
CMOS
Fig. 1: Example of the QS-based features extracted from the histogram of a lower class (light grey) and of a higher class (dark grey), and the corresponding lower and higher CMQS points of each class.
“Anti”-Bayesian TC Solution: The Multi-Class TC Classifier Let us
assume that the PR problem involvesCclasses. Since the “Anti”-Bayesian
tech-nique has been extensively studied for two-class problems, our newly-proposed
multi-class TC classifier operates by invoking a sequence ofC−1 pairwise
clas-sifiers. More explicitly, whenever a document for testing is presented, the system invokes a classifier that involves a pair of classes from which it determines a winning class. This winning class is then compared to another class until all the classes have been considered. The final winning class is the overall best and is the one to which the testing document is assigned.
“Anti”-Bayesian TC Solution: Testing To classify an unknown document,
we compute the cosine similarity between it and the features representing pairs of classes. This is done as follows: For each word, we mark one of the two groups as the high-group and the other as the low-group based on the word’s frequency in the documents of each class, and we take the high CMQS point of the
low-group and the low CMQS point of the high-low-group, as illustrated in Figure ??.
We build the two class vectors from these CMQS points, and we compute the
cosine similarity [?] between the document to classify each class vector.
The most similar class is retained and the least similar one is discarded and replaced by one of the other classes to be considered, and the test is run again, until all the classes have been exhausted. The final class will be the most similar one, and the one that the document is classified into.
4
Experimental Set-Up
4.1 The Data Sets
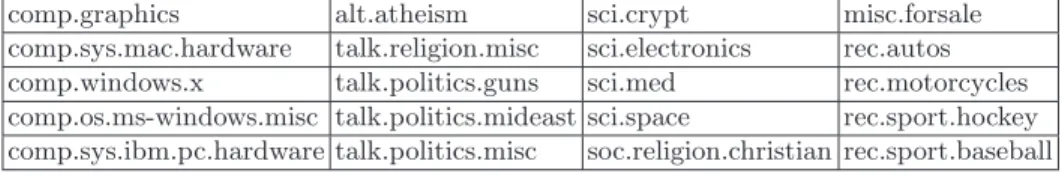
For our experiments, we used the 20-Newsgroups corpus, a standard corpus in the literature pertaining to Natural Language Processing. This corpus contains
1,000 postings collected from the 20 different Usenet groups, each associated with
a distinct topic, as listed in Table ??. We preprocessed each posting by
remov-ing header data (for example, “from”, “subject”, “date”, etc.) and lines quoted
from previous messages being responded to (which start with a ‘>’ character),
performing stop-word removal and word stemming, and deleting the postings that became empty of text after these preprocessing phases.
Table 1: The topics from the “20-Newsgroups” used in the experiments.
comp.graphics alt.atheism sci.crypt misc.forsale
comp.sys.mac.hardware talk.religion.misc sci.electronics rec.autos
comp.windows.x talk.politics.guns sci.med rec.motorcycles
comp.os.ms-windows.misc talk.politics.mideast sci.space rec.sport.hockey
comp.sys.ibm.pc.hardware talk.politics.misc soc.religion.christian rec.sport.baseball
In every independent run, we randomly selected 70% of the postings of each newsgroup to be used for training, and retained the remaining 30% for testing.
4.2 The Histograms/Features and Benchmarks Used
We first describe the process involved in the construction of the histograms and the extraction of the Quantile-based features.
Each document in the 20-Newsgroups dataset was preprocessed by word stemming using the Porter Stemmer algorithm and by a stopword removal phase. It was then converted to a BOW representation. The documents were then ran-domly assigned into training or testing sets.
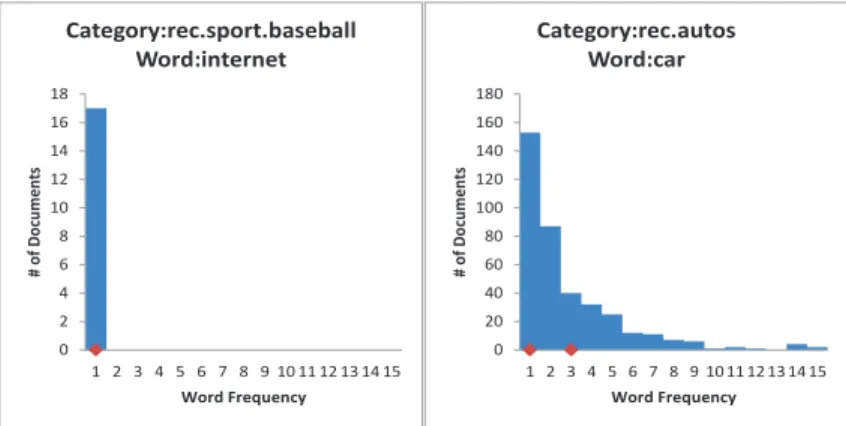
The word-based histograms (please see Figure ??) were then computed for
each word in each category by tallying the observed frequencies for that word in each training document in that category, where the area of each histogram was the total sum of all the columns. The CMQS points were determined as those points where the cumulative sum of each column was equal to the CMQS mo-ments when normalized with the total area. For further clarification, we present
an example of two histograms5 in Figure ?? below. The 1
3 and 2
3 QS points of
each histogram are marked along their horizontal axes. In this case, the
mark-ings represent the word frequencies that encompass the 1
3 and 2
3 areas of the
histograms respectively. The histogram on the left depicts a less significant word for its category while the histogram on the right depicts a more significant word for its category. Note that in both histograms the first CMQS point is located at unity. To help clarify the figure, we mention that for the word “internet” in “rec.sport.baseball”, both the CMQS points lie at unity - i.e., they are on top of each other.
To compare the various methods used, we have developed three benchmarks for our system: A BOW classifier which involved the TFs and invoked the cosine similarity measure, a BOW classifier with the TFIDF features, and a Na¨ıve-Bayes’ classifier. Since they are well-established classifiers, their details are
omit-ted – they are found in [?].
5
The documents used in this test were very short, which explains why the histograms are heavily skewed in favour of lower word frequencies.
0 2 4 6 8 10 12 14 16 18 1 2 3 4 5 6 7 8 9 10 11 12 13 14 15 # o f D o cu m e n ts Word Frequency Category:rec.sport.baseball Word:internet 0 20 40 60 80 100 120 140 160 180 1 2 3 4 5 6 7 8 9 10 11 12 13 14 15 # o f D o cu m e n ts Word Frequency Category:rec.autos Word:car
Fig. 2: The histograms and the 1
3 and 2
3 QS points for the two words “internet ”
and “car” from the categories “rec.sport.baseball” and “rec.autos”.
The Metrics Used In every testing case, we used the respective data to train
and test our classifier and each of the three benchmark schemes. For each
news-group i, we counted the number of True Positives (T Pi) of postings correctly
identified by a classifier as belonging to that group, the number of False
Neg-atives, (F Ni) of postings that should have belonged in that group but were
misidentified as belonging to another group, and the number ofFalse Positives
(F Pi) of postings that belonged to other groups but were misidentified as
be-longing to this one. The PrecisionPi is the proportion of postings assigned in
groupithat are correctly identified, and the RecallRiis the proportion of
post-ings belonging in the group that were correctly recognized. The F score is an
average of these two metrics for each group, and themacro-F1is the average of
theF scores over the all groups. All these are specified in Eq. (??).
Pi= T Pi T Pi+F Pi ; Ri= T Pi T Pi+F Ni ; Fi= 2PiRi Pi+Ri ; macro-F1= 1 20 20 X i=1 Fi. (1)
Correlation between the Classifiers Since the features and methods used
in the classification are rather distinct, it would be a remarkable discovery if we could confirm that the results between the various classifiers are not correlated. Since the classifiers themselves yield binary results (‘0’ or ‘1’ for incorrect or
correct classifications), it is appropriate to compare classifiersX and Y by the
“number” of times they yieldidenticaldecisions. In other words, a suitable metric
for evaluating how any two classifiersX andY yield identical results is given by
Eq. (??) below: ClassifierSimX,Y = P osXP osY +N egXN egY P osXP osY +P osXN egY +N egXP osY +N egXN egY , (2)
whereP osXP osY andN egXN egY are the count of cases where the classifiersX
andY both return identical decisions ‘1’ or ‘0’ respectively, and where ‘0’ and ‘1’
represent the events of a classifier classifying a document incorrectly or correctly
respectively. Analogously, P osXN egY and N egXP osY are the counts of cases
whereX returns ‘1’ andY returns ‘0’ and vice-versa respectively. Although this
is a statistical measure of the relative similarities between the classifiers, we shall refer to this as their mutual “correlation”.
5
Experimental Results
5.1 The Results Obtained: “Anti”-Bayesian TF Scheme
The experimental results that we have obtained for the “Anti”-Bayesian scheme that used only the TF criteria are briefly described below. We performed 100 tests, each one using a different random 70%/30% split of training and test-ing documents. We then evaluated the results of each classifier by computtest-ing
the Precision, Recall, andF-score of each newsgroup, whence we computed the
macro-F1value for each classifier over the 20-Newsgroups. The average results
we obtained, over all 100 tests, are summarized in Table??.
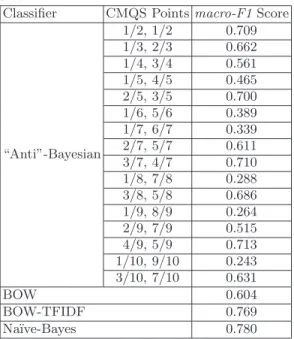
Table 2: Themacro-F1score results for the 100 classifications attempted and for
the different methods. In the case of the “Anti”-Bayesian scheme, the method used the TF features.
Classifier CMQS Pointsmacro-F1Score
“Anti”-Bayesian 1/2, 1/2 0.709 1/3, 2/3 0.662 1/4, 3/4 0.561 1/5, 4/5 0.465 2/5, 3/5 0.700 1/6, 5/6 0.389 1/7, 6/7 0.339 2/7, 5/7 0.611 3/7, 4/7 0.710 1/8, 7/8 0.288 3/8, 5/8 0.686 1/9, 8/9 0.264 2/9, 7/9 0.515 4/9, 5/9 0.713 1/10, 9/10 0.243 3/10, 7/10 0.631 BOW 0.604 BOW-TFIDF 0.769 Na¨ıve-Bayes 0.780
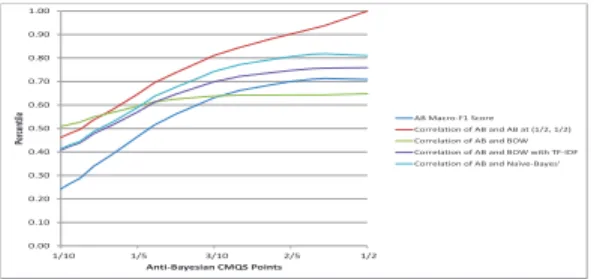
The results show that forhalf of the CMQS pairs, the “Anti”-Bayesian
clas-sifier performed as well as and sometimes even better than the BOW clasclas-sifier.
Figure ?? displays the plots of the correlation between the different
scheme, the method used the TF features. The reader should observe the
uncor-related nature of the classifiers when the CMQS points are non-central [?].
0.00 0.10 0.20 0.30 0.40 0.50 0.60 0.70 0.80 0.90 1.00 1/10 1/5 3/10 2/5 1/2 Pe rc en til e Anti-Bayesian CMQS Points AB Macro-F1 Score Correlation of AB and AB at (1/2, 1/2) Correlation of AB and BOW Correlation of AB and BOW with TF-IDF Correlation of AB and Naïve-Bayes'
Fig. 3: Plots of the correlation between the different classifiers for the 100 classi-fications achieved. In the case of the “Anti”-Bayesian scheme, the method used the TF features.
5.2 The Results Obtained: “Anti”-Bayesian TFIDF Scheme
The results of the “Anti”-Bayesian scheme when it involves TFIDF features are
shown in Table??.
Table 3: Themacro-F1score results for the 100 classifications attempted and for
the different methods. In the case of the “Anti”-Bayesian scheme, the method used the TFIDF features.
Classifier CMQS Pointsmacro-F1Score
“Anti”-Bayesian 1/2, 1/2 0.742 1/3, 2/3 0.747 1/4, 3/4 0.746 1/5, 4/5 0.742 2/5, 3/5 0.745 1/6, 5/6 0.736 1/7, 6/7 0.729 2/7, 5/7 0.747 3/7, 4/7 0.744 1/8, 7/8 0.720 3/8, 5/8 0.746 1/9, 8/9 0.712 2/9, 7/9 0.745 4/9, 5/9 0.744 1/10, 9/10 0.705 3/10, 7/10 0.748 BOW 0.604 BOW-TFIDF 0.769 Na¨ıve-Bayes 0.780
1. The results show that for all CMQS pairs, the “Anti”-Bayesian classifier
performed much better than the traditional BOW classifier. For example,
for the CQMS pairsh1 3,
2
3i, was significantly higher, i.e., 0.747. Further, the
macro-F1score indices forh1 4, 3 4i,h 3 7, 4 7iandh 4 9, 5
9iwere consistently higher
– 0.746, 0.744 and 0.744 respectively. This demonstrates the validity of our
counter-intuitive paradigm – that we can truly get a remarkable accuracy even though we are characterizing the documents by the syntactic features of the points quite distant from the mean and more towards the extremities of the distributions.
2. In all the cases, the values of the Macro-F1 index was only slightly less
than the indices obtained using the BOW-TFIDF and the Na¨ıve-Bayes ap-proaches.
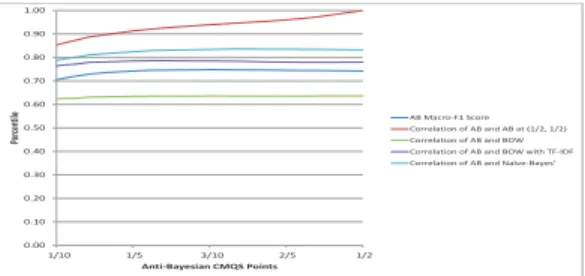
Figure??displays the plots of the correlation between the different classifiers
for the 100 classifications achieved, where in the case of the “Anti”-Bayesian scheme, the method used the TFIDF features. The reader should again observe the uncorrelated nature of the classifiers for non-central CMQS points. This correlation increases as the feature points become closer to the mean/median.
0.00 0.10 0.20 0.30 0.40 0.50 0.60 0.70 0.80 0.90 1.00 1/10 1/5 3/10 2/5 1/2 Pe rc en til e Anti-Bayesian CMQS Points AB Macro-F1 Score Correlation of AB and AB at (1/2, 1/2) Correlation of AB and BOW Correlation of AB and BOW with TF-IDF Correlation of AB and Naïve-Bayes'
Fig. 4: Plots of the correlation between the different classifiers for the 100 classi-fications achieved. In the case of the “Anti”-Bayesian scheme, the method used the TFIDF features.
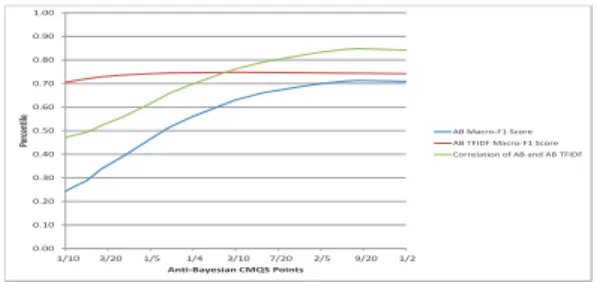
To continue the analysis, it would be good to examine if the two “Anti”-Bayesian classifiers are relatively uncorrelated in and of themselves. Thus, if a particular pair of CMQS points yielded distinct classification decisions using the two schemes, and if they, all the same, yielded comparable accuracies, the potential of the paradigm is shown to be significantly more. This is precisely what we embark on achieving now – i.e., examining the correlation (or lack thereof) of the “Anti”-Bayesian TF and TFIDF schemes. This correlation is
depicted graphically in Figure??whence the trends in the correlation with the
increasing values of the CMQS points is clear.
When the CMQS points are close to the mean or median, the correlation is quite high (for example, 0.842). This is not surprising at all, since in such cases, the “Anti”-Bayesian classifier reduces to become a Bayesian classifier. Also, when the CMQS points are far from the mean or median, the correlation is quite high
(for example, 0.659 for the CMQS pointsh2
9, 7
9i). This is quite surprising because
although both schemes are “Anti”-Bayesian in their philosophy, the lengths of the documents play a part in determining the decisions that they individually make because the IDF values account for document lengths.
0.00 0.10 0.20 0.30 0.40 0.50 0.60 0.70 0.80 0.90 1.00 1/10 3/20 1/5 1/4 3/10 7/20 2/5 9/20 1/2 Pe rc en til e Anti-Bayesian CMQS Points AB Macro-F1 Score AB TFIDF Macro-F1 Score Correlation of AB and AB TFIDF
Fig. 5: The correlation between the two “Anti”-Bayesian classifiers for the 100 classifications when they utilized the TF and the TFIDF features respectively.
The unabridged version of the paper [?] also describes how the various
clas-sifiers can be fused. This discussion is omitted here in the interest of space.
6
Conclusions
In this paper we have considered the problem of Text Classification (TC), which is a problem that has been studied for decades. From the perspective of classi-fication, problems in TC are particularly fascinating because while the feature
extraction process involves syntactic or semantic indicators, the classification
uses the principles of statistical Pattern Recognition (PR). The
state-of-the-art in TC uses these statistical features in conjunction with the well-established methods such as the Bayesian, the Na¨ıve Bayesian, the SVM etc. Recent research has advanced the field of PR by working with the Quantile Statistics (QS) of the features. The resultant scheme called Classification by Moments of Quantile
Statistics (CMQS) is essentially “Anti”-Bayesian in its modus operandus, and
advantageously works with information latent in “outliers” (i.e., those distant from the mean) of the distributions. Our goal in this paper was to demonstrate
the power and potential of CMQS to work within the very high-dimensional
TC-related vector spaces and their “non-central” quantiles. To investigate this, we considered the cases when the “Anti”-Bayesian methodology used both the TD and the TFIDF criteria.
Our PR solution forCcategories involvedC−1 pairwise CMQS classifiers. By
a rigorous testing on the well-acclaimed data set involving the 20-Newsgroups corpus, we demonstrated that the CMQS-based TC attains accuracy that is comparable to and sometimes even better than the BOW-based classifier, even though it essentially uses the information found only in the “non-central” quan-tiles. The accuracies obtained are comparable to those provided by the BOW-TFIDF and the Na¨ıve Bayes classifier too!
Our results also show that the results we have obtained are often uncorrelated with the established ones, thus yielding the potential of fusing the results of a CMQS-based methodology with those obtained from a more traditional scheme.
References
1. A. Alahmadi, A. Joorabchi, and A. E. Mahdi. A New Text Representation
Scheme Combining Bag-of-Words and Bag-of-Concepts Approaches for Automatic Text Classification. Proceedings of the 7th IEEE GCC Conference and Exhibition, Doha, Qatar, November 2014, pp. 108–113.
2. F. Debole and F. Sebastiani. Supervised Term Weighting for Automated Text Categorization. Proceedings of the 18th ACM Symposium on Applied Computing, Melbourne USA, 784–788, March 2003, pp. 784-788.
3. R. O. Duda and P. E. Hart and D. G. Stork Pattern Classification. A Wiley Interscience Publication, 2006.
4. J. Dumoulin. Smoothing of n-gram Language Models of Human Chats.Proceedings of the Joint 6th International Conference on Soft Computing and Intelligent Sys-tems (SCIS) and 13th International Symposium on Advanced Intelligent SysSys-tems (ISIS), Kobe, Japan, November 2012, pp. 1-4.
5. L. Lu and Y.-S. Liu. Research of English Text Classification Methods based on Semantic Meaning. Proceedings of the ITI 3rd International Conference on In-formation and Communications Technology, Cairo, Egypt, December 2005, pp. 689-700.
6. R. E. Madsen, S. Sigurdsson, L. K. Hansen and J. Larsen. Pruning the Vocabulary for Better Context Recognition. Proceedings of the 17th International Conference on Pattern Recognition, Cambridge, UK, Vol. 2, August 2004, pp. 483-488. 7. Y. Ning, T. Zhu and Y. Wang. Affective-word based Chinese Text Sentiment
Clas-sification.Proceedings of the 5th International Conference on Pervasive Computing and Applications (ICPCA), Maribor, Slovenia, December 2010, pp. 111-115. 8. B. J. Oommen, R. Khoury and A. Schmidt. Text Classification Using
“Anti”-Bayesian Quantile Statistics-based Classifiers. Unabridged version of this paper. Submitted for publication.
9. B. J. Oommen and A. Thomas. Optimal Order Statistics-based “Anti-Bayesian” Parametric Pattern Classification for the Exponential Family.Pattern Recognition, Vol. 47, 2014, pp. 40-55.
10. G. Qiang. An Effective Algorithm for Improving the Performance of Na¨ıve Bayes for Text Classification. Proceedings of the Second International Conference on Computer Research and Development, Malaysia, May 2010, pp. 699-701.
11. G. Salton and M. McGill. Introduction to Modern Information Retrieval. New York: Mc-Graw Hill Book Company. 1983.
12. G. Salton, C. S. Yang, and C. Yu. Term weighting approaches in automatic text retrieval. Technical Report, Ithaca, NY, USA, 1987.
13. F. Sebastiani. Machine Learning in Automated Text Categorization. ACM Com-puting Surveys, 2002, Vol. 34, pp. 1-47.
14. A. Thomas and B. J. Oommen. The Fundamental Theory of Optimal “Anti-Bayesian” Parametric Pattern Classification Using Order Statistics Criteria. Pat-tern Recognition, 2013, pp. 376-388.
15. A. Thomas and B. J. Oommen. Order Statistics-based Parametric Classification for Multi-dimensional Distributions. Pattern Recognition, 2013, pp. 3472-3482. 16. A. Thomas and B. J. Oommen. Corrigendum to Three Papers that deal with
“Anti”-Bayesian Pattern Recognition. Pattern Recognition, 2014, pp. 2301-2302. 17. G. Wu and K. Liu. Research on Text Classification Algorithm by Combining
Statistical and Ontology Methods. Proceedings of the International Conference on Computational Intelligence and Software Engineering, Wuhan, China, December 2009, pp. 1-4.