Available online on 30.08.2019 at http://jddtonline.info
Journal of Drug Delivery and Therapeutics
Open Access to Pharmaceutical and Medical Research
© 2011-18, publisher and licensee JDDT, This is an Open Access article which permits unrestricted non-commercial use, provided the original work is properly cited
Open Access
Research Article
Formulation and Evaluation of Sustained Release Matrix Tablets of
Captopril
Pawar Simran S.*, Malpure Prashant S., Surana Santosh S., Bhadane Jayashri S.
Department of Pharmaceutics, Loknete Dr. J.D. Pawar College of Pharmacy, Manur, Tal-Kalwan, Dist-Nashik (Maharashtra) 423501
ABSTRACT
The objective of the present study was to study the effect of polymers on sustained release of Captopril from tablets. Compatibility was studied by Fourier transform infrared spectroscopy and DSC. The tablets were prepared by direct compression technique using Xanthan g um and Ethyl Cellulose. The prepared matrix tablets were evaluated for their physicochemical parameters such as weight variation, hardness, friability, content uniformity and in-vitro dissolution. Pre and post compression parameters were evaluated and all the parameters were found within the limit. The drug release data were subjected to different models in order to evaluate release kinetics and mechanism of drug release. Formulation F4 was selected as best formulation. The dissolution of formulation F4 can be Shows Non-fickian drug release mechanism. Keywords: Matrix tablets, Captopril, Xanthan gum, Ethyl cellulose.
Article Info: Received 18 July 2019; Review Completed 23 Aug 2019; Accepted 27 Aug 2019; Available online 30 Aug 2019
Cite this article as:
Pawar SS, Malpure P.S., Surana S.S., Bhadane J.S., Formulation and Evaluation of Sustained Release Matrix Tablets of
Captopril, Journal of Drug Delivery and Therapeutics. 2019; 9(4-A):260-268
http://dx.doi.org/10.22270/jddt.v9i4-A.3406
*Address for Correspondence:
Miss. Pawar Simran S., Department of Pharmaceutics, Loknete Dr. J.D. Pawar College of Pharmacy, Manur, Tal-Kalwan, Dist-Nashik (Maharashtra) 423501
INTRODUCTION
Sustained release technology is relatively new field and as a consequence, research in the field has been extremely fertile and has produced many discoveries. With many drugs, the basic goal is to achieve a steady state blood level that is therapeutically effective and non-toxic for an extended period of time. The design of proper dosage form is an important element to accomplish this goal. Sustained release, sustained action, prolonged action, controlled release, extended action, timed release and depot dosage form are term used to identify drug delivery system that are designed to achieve prolonged therapeutic effect by continuously releasing medication over an extended period of time after administration of a single dose. In the case of oral sustained released dosage form, an effect is for several hours depending upon residence time of formulation in the GIT. The success of a therapy depends on selection of the appropriate delivery system as much as drug itself.1 Sustained release dosage forms are designed to complement pharmaceutical activity of the medication in order to achieve better selectivity and longer duration of action. Captopril belongs to class Angiotensin Converting Enzyme inhibitor
abolish responses to Angiotensin I but not to Angiotensin II. Hence the inhibition of ACE therefore may induce the effect unrelated to reducing the level of Angiotensin II. ACE inhibition increase bradykinin synthesis which stimulate prostaglandin biosynthesis. Bradykinin and prostaglandin contribute pharmacological effect of ACE inhibitor. All these effects produce pharmacological actions like vasodilatation etc which ultimately decrease the blood pressure. Captopril is freely water-soluble and has a half-life 1.9 hours. It is usually prescribed to patients who are chronically ill and require long term use for therapeutic benefits. Development of a captopril oral formulation would be a significant advantage for patient compliance accompanied by minimization of the drug side effects as a result of reduction in the drug blood concentration fluctuations, especially in long-term therapy. The aim of this study was to prepare matrix tablets of Captopril using varying proportions of the Xanthan gum and Ethyl cellulose.
MATERIALS & METHODS
MATERIALSMagnesium stearate , Talc are from Research lab fine chem industries (Mumbai).
METHOD OF PREPARATION OF MATRIX TABLETS
Matrix tablets of Captopril were prepared by direct compression technique using varying proportions of polymers in combination. The composition of matrix tablets is given in table -1. All the ingredients were individually passed through a 60 mesh sieve, except glidant and lubricant. For each formulation required quantities of Captopril, polymer (xanthan gum and Ethyl Cellulose), were
accurately weighed according to the composition and mixed in a polybag for about 30 to 45 minutes. The obtained blend was lubricated with talc and magnesium stearate for another 5 minutes. The appropriate amount of the mixture was weighed and then compressed using 8 station rotary tablet press (CEMACH machineries ltd Ahmedabad, India) equipped with 11 mm flat faced punches at a constant compression force required to produce hardness of tablets about 2-4 kg/ cm2. All the tablets were stored in airtight containers for further use.
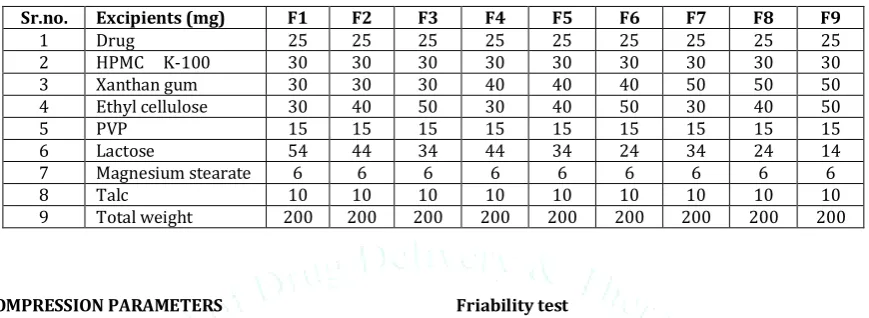
Table 1: Formulation code for each Batch
Sr.no. Excipients (mg) F1 F2 F3 F4 F5 F6 F7 F8 F9
1 Drug 25 25 25 25 25 25 25 25 25
2 HPMC K-100 30 30 30 30 30 30 30 30 30
3 Xanthan gum 30 30 30 40 40 40 50 50 50
4 Ethyl cellulose 30 40 50 30 40 50 30 40 50
5 PVP 15 15 15 15 15 15 15 15 15
6 Lactose 54 44 34 44 34 24 34 24 14
7 Magnesium stearate 6 6 6 6 6 6 6 6 6
8 Talc 10 10 10 10 10 10 10 10 10
9 Total weight 200 200 200 200 200 200 200 200 200
PRE-COMPRESSION PARAMETERS Angle of repose ()
Angle of repose is defined as the maximum angle possible between the surface of a pile of the powder and horizontal plane. The frictional force in a loose powder or granules can be measured by the angle of repose.
tan= h / r
= tan-1 (h/r)
Where, is the angle of repose h is height of pile
r is radius of the base of the pile
Carr’s compressibility index
The compressibility index of the granules was determined by the Carr’s compressibility index. (%) Carr’s Index can be calculated by using the following formula
Carr’s Index (%) =
TBD
LBD
-TBD
x 100
POST-COMPRESSION PARAMETERS
The prepared matrix tablets were evaluated for their physical properties like , hardness and friability, swelling index and drug content.
Hardness test
Tablets require a certain amount of strength, or hardness and resistance to friability, to withstand mechanical shocks of handling during manufacture, packaging and shipping. The hardness of the tablets was determined using Digital Hardness tester. It is expressed in Kg/cm2. Three tablets were randomly picked from each formulation and the mean and standard deviation values were calculated.
Friability test
It is the phenomenon whereby tablet surfaces are damaged and/or show evidence of lamination or breakage when subjected to mechanical shock or attrition.
The friability of tablets was determined by using Electro lab, USP EF 2 friabilator. It is expressed in percentage (%). Ten tablets were initially weighed (Winitial) and transferred into friabilator. The friabilator was operated at 25 RPM for 4
minutes. The tablets were weighed again (Wfinal). The
percentage friability was then calculated by,
F =
x
100
W
W
W
initial final initial
% Friability of tablets less than 1% is considered acceptable.
Swelling index
Swelling of tablet involves the absorption of a liquid resulting in an increase in weight and volume. Liquid uptake by the particle may be due to saturation of capillary spaces within the particles or hydration of macromolecule. The liquid enters the particles or hydration of macromolecules. The liquid enters the particles through pores and bind to large molecule; breaking the hydrogen bond and resulting in the swelling of particle .The extent of swelling can be measured in terms of %weight gain by the tablet. The swelling index of tablets was determined in 0.1 N HCl (pH 1.2) at room temperature. After each interval the tablet was removed from beaker, remove the excess buffer by using filter paper and weighed again upto 8 hrs.
The swelling index was calculated by the following equation:
Swelling index (SI) = (Wt – W0)/WO × 100
Drug content
Take the powder of 20 tablets. Weighed a quantity of powder containing 0.1gm of Captopril with 150ml of phosphate buffer pH6.8 for 10 minutes, add sufficient phosphate buffer pH6.8 to produce 200ml and filter. Dilute 10 ml of filtrate to 100ml with water and measure the absorbance at 233nm.
In vitro dissolution study
In vitro drug release studies of matrix tablets were done in eight-station USP XXII type II dissolution test apparatus( Electro lab TDT-08, India) at 37°C (± 0.5°C) and 50 rpm speed in 900 mL of dissolution medium. Dissolution medium consisted of 0.1N hydrochloric acid for the first 2 hours and phosphate buffer pH 6.8 from 3 to 8 hours. Five millitre (5ml) samples were taken by filtration at predetermined time intervals and after each sampling the volume of dissolution medium was replaced with 5ml of phosphate buffer (pH 6.8) .The amount of drug released is determined spectrophotometrically
In- Vitro Drug Release Kinetic Study Zero Order Kinetics
A Zero order release would be predicted by the following equation,
Qt-Q0=K0t Where
Qt =Amount of drug release dissolved in time ‘t’ Co=Initial amount of drug concentration in solution. Kot=Zero order rate constant.
When the data were plotted as cumulative % drug release versus time, if the plot is linear then data obeys zero order kinetics with slope equal to K0. This model represents an ideal release profile in order to achieve the prolonged pharmacological action.
First Order Kinetics:
A first order release would be predicted by the following equation
Log Qt=Log Q0-Klt/2.303
Where,
Qt=Amount of drug released in time ‘t’
Co=Initial amount of drug concentration in solution. Klt=first order rate constant
When data were plotted as log cumulative% drug remaining versus time yields a straight line indicating that the release follows first order kinetics. The constant K can be obtained multiplying slope values.
Higuchi’s Model:
Drug release from the matrix device by diffusion has been described by Higuchi’s diffusion equation
Ft=Q=VD5/T(2C-5Cs)Cst
Where,
Q=Amount of drug release dissolved in time ‘t’. Co=diffusion coefficient of drug in the release matrix. Cs=Solubility of drug in the matrix.
5=porosity of matrix t=Tortuosity T=Time (h)
The equation may be simplified then the equation becomes,
Ft=Q=KhX t1/2
Where,
Kh=Higuchi dissolution constant
When data were plotted according to this equation, i.e. cumulative drug released versus square root of time, yields a straight line, indicating that the drug was released by diffusion mechanism.
Peppas Korsmeyer Equation
In 1983 korsmeyer et.al developed a simple, semiempirical model, when diffusion is the main drug release mechanism, relating exponentially the drug release to the elapsed time (t)
At/Ao=Kt/n
Where, K=Constant n=Release t=Time
At and Ao=Absolute cumulative amount of drug released at times.
This is used when the release mechanism is not well known or when more than one type of a release phenomenon could be involved.
RESULTS AND DISCUSSION
Precompression parameters:Precompression parameters
Table 2: Precompression parameters for sustained release matrix tablets of captopril F1 to F9
Formulation code repose(Angle of 0) Bulk density (g/ml) Tapped density (g/ml) Carr’s index (%) Hausner’s ratio
F1 31.44±0.14 0.42±0.07 0.54±0.10 22.22±0.1 1.28±0.1
F2 24.72±0.2 0.39±0.110 0.42±0.9 7.14±0.2 1.07±0.4
F3 27.58±0.9 0.36±0.096 0.41±0.69 12.19±0.1 1.13±0.1
F4 28.73±0.2 0.52±0.135 0.59±0.2 11.86±0.3 1.13±0.1
F5 25.52±0.4 0.50±0.108 0.63±0.2 20.63±0.2 1.26±0.1
F6 23.85±0.1 0.37±0.160 0.45±0.2 17.77±0.1 1.21±0.1
F7 30.24±0.4 0.48±0.195 0.56±0.1 14.28±0.1 1.16±0.1
F8 22.56±0.4 0.42±0.17 0.52±0.18 19.23±0.1 1.23±0.2
F9 31.68±0.5 0.44±0.145 0.56±0.13 21.42±0.2 1.27±0.1
Evaluation of postcompression parameters
Sustained release matrix tablets of Captopril were prepared by direct compression technique. Total nine formulations were prepared. The tablet weight variation, hardness, friability and content uniformity for each formulation are shown in table 3. The weight variation test indicated that the percentage deviation of all tablet formulations was found to be within pharmacopoeial acceptable limit. The hardness of all the tablets was within the range of 2.8±3.9kg/cm. The
drug content in all the batches was determined by measuring absorbance of sample at 233 nm using double beam UV spectrophotometer (LABINDIA). The content uniformity among different formulations was found to be higher and the drug content in the range of 82.23 to 90.75% which indicates uniform drug distribution in all the formulations.
Post compression parameters
Table 3: Post compression parameters for sustained release matrix tablets of captopril F1 to F9
Formulation code Hardness Thickness Friability Weight variation
F1 3.3±0. 20 2.84±0.02 0.67±0.02 200.0±0.17
F2 3.2±0.05 2.8±0.04 0.50±0.12 200.8±1.06
F3 2.9±0.05 2.83±0.08 0.63±0.05 201.5±0.63
F4 3.9±0.23 2.82±0.15 0.72±1.35 201.0±1.25
F5 2.9±0.11 2.70±0.07 0.59±0.13 200.3±0.86
F6 3.2±0.15 2.68±0.19 0.82±0.01 200.4±0.44
F7 3.1±0.25 2.74±0.21 0.68±0.16 200.4±0.69
F8 2.8±0.11 2.77±0.06 0.59±0.10 200.3±0.73
F9 3.3±0.45 2.80±0.26 0.67±0.17 200.8±0.68
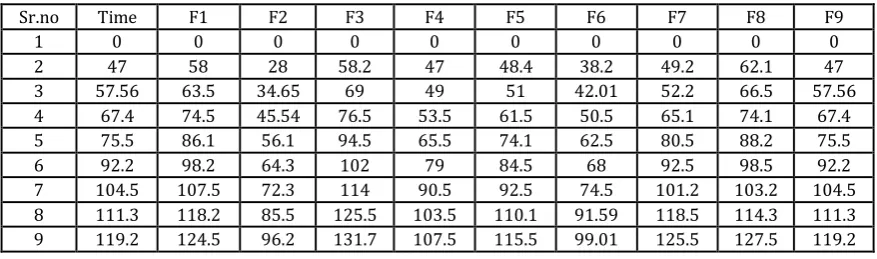
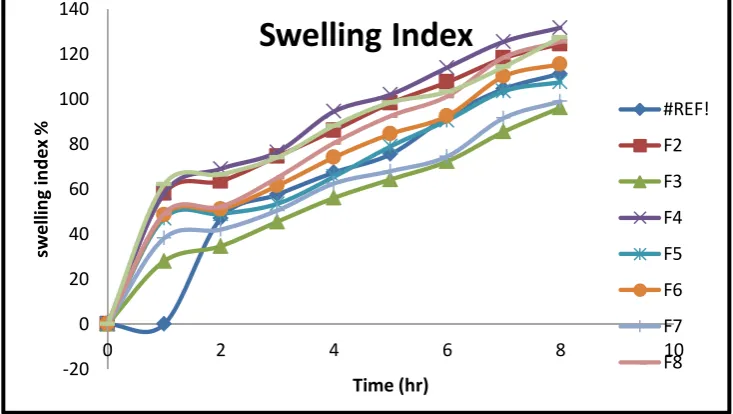
Swelling Index
The swelling behavior of a dosage unit was measured by studying its weight gain. The swelling index of tablets was determine by placing the tablets in a petridish using
dissolution medium as 0.1N HCL(pH 1.2) and pH 7.4 phosphate buffer. After 1, 2, 4, 6, and 8 hours. Each tablet was withdrawn carefully, blotted with tissue paper to remove for each time interval.
Table 4. Swelling index of formulations (F1-F9)
Sr.no Time F1 F2 F3 F4 F5 F6 F7 F8 F9
1 0 0 0 0 0 0 0 0 0 0
2 47 58 28 58.2 47 48.4 38.2 49.2 62.1 47
3 57.56 63.5 34.65 69 49 51 42.01 52.2 66.5 57.56
4 67.4 74.5 45.54 76.5 53.5 61.5 50.5 65.1 74.1 67.4
5 75.5 86.1 56.1 94.5 65.5 74.1 62.5 80.5 88.2 75.5
6 92.2 98.2 64.3 102 79 84.5 68 92.5 98.5 92.2
7 104.5 107.5 72.3 114 90.5 92.5 74.5 101.2 103.2 104.5
8 111.3 118.2 85.5 125.5 103.5 110.1 91.59 118.5 114.3 111.3
Figure 1.Swelling index of Captopril SR Matrix tablet In vitro dissolution study
Captopril release from the matrix tablets was studied for first two hours in 0.1 n HCL and the next six hours in pH 6.8 phosphate buffer. Total nine formulations were made with Xanthan gum and Ethyl Cellulose with different ratios. In batch F1, F2, & F3 Xanthan gum & Ethyl cellulose was used as a sustained release polymers. Preformulation study & Physicochemical evaluation of matrix tablets was conducted and results are shown in table 18 & 19.In vitro dissolution study results of F1 showed 59.57% drug release within 8 hrs. F2 showed 60.31% & F3 showed 64.73% cumulative drug release in 8 hrs. Thus sustained release profile was not achieved. So in next batch F4 it was decided to increase the amount of xanthan gum. In batch F4 amount of xanthan gum
was increased as compared to used in batch F1, F2 & F3. Results obtained of dissolution study showed 90.75% cumulative drug release within 8 hrs. which is in compliance with desired drug release profile. It happened due to the increase amount of xanthan gum. Xanthan gum used to produce directly compressed matrices that display a high degree of swelling due to water uptake and hence it gives desired results.
In Batch F5, F6, F7, F8, F9 xanthan gum & ethyl cellulose was used in different ratios. In vitro dissolution study showed 71. 05 %, 80.21 % , 85.78%, 93.47% & 88.42% cumulative drug release in 8 hrs.These results indicated that the Xanthan gum could control the release of Captopril up to 8 hr when it combined with Ethyl Cellulose.
Fig.- 2: Comparative in-vitro dissolution profile of all the formulations
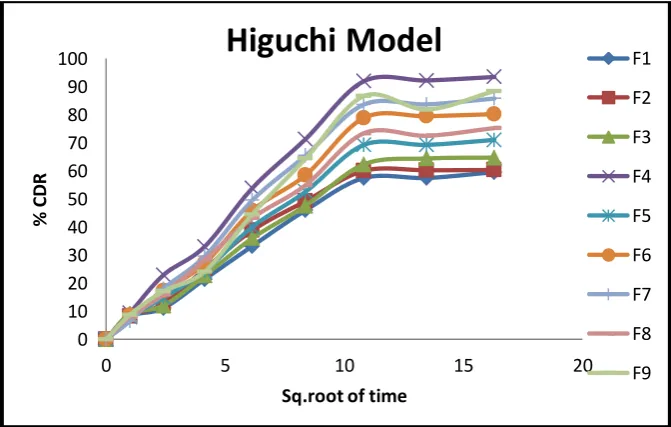
KINETIC STUDY
The classical zero order released curved was found to be linear the curve plotted according to first order and Highuchi and Conner’s were also found to be linear respectively. For the Korsemeyer’s Peppas released curves
r2 was found to be ≥ 0.90 for all formulation and n value was
occurs probably by diffusion, erosion and dissolution follows.
In the present study, the drug released mechanism from all Sustained release matrix tablet formulation different kinetic models was analyzed using factorial design batches followed zero order , first order kinetic, Highuchi model and
-20
0
20
40
60
80
100
120
140
0
2
4
6
8
10
sw
el
lin
g
in
d
ex
%
Time (hr)
Swelling Index
#REF!
F2
F3
F4
F5
F6
F7
F8
0
10
20
30
40
50
60
70
80
90
100
0
2
4
6
8
10
%
C
D
R
time (hrs)
Figure 3: Model graph for comparative evaluation of zero order release kinetics
Figure 4: Model graph for comparative evaluation of first order release kinetics
Figure 5: Model graph for comparative evaluation of Higuchi order release kinetics
0
20
40
60
80
100
0
2
4
6
8
10
%
C
D
R
Time
Zero Order
F1
F2
F3
F4
F5
F6
F7
F8
F9
0
0.5
1
1.5
2
2.5
0
2
4
6
8
10
Lo
g
%
C
D
R
Time
First Order
F1
F2
F3
F4
F5
F6
F7
F8
F9
0
10
20
30
40
50
60
70
80
90
100
0
5
10
15
20
%
C
D
R
Sq.root of time
Higuchi Model
F1
F2
F3
F4
F5
F6
F7
F8
Figure 6: Model graph for comparative evaluation of krosemayers peppas
Table 5: Correlation coefficients according to the different kinetic equations used for describing Captopril release behavior from sustained release matrix tablets.
Formulation
code Zero order First order Higuchi Model Krosmeyer peppas
F1 0.961 0.515 0.910 0.927
F2 0.952 0.463 0.872 0.947
F3 0.964 0.458 0.921 0.921
F4 0.963 0.434 0.907 0.941
F5 0.963 0.511 0.918 0.931
F6 0.962 0.489 0.918 0.929
F7 0.960 0.552 0.914 0.941
F8 0.953 0.530 0.912 0.942
F9 0.949 0.027 0.926 0.901
DRUG EXCIPIENT COMPATIBILITY STUDY
Infrared spectrophotometer is a useful analytical technique utilized to check the chemical interaction between the drug and the other excipients used in the formulation. The sample 1mg was powdered and mixed with the 10mg of dry powdered potassium bromide. The powdered mixture was taken in a sampler and the spectrum was recorded by scanning in the wavelength region of 4000-400 cm-1 using FTIR spectrophotometer.
Fourier transform infra red spectroscopy studies revealed that pure Captopril showed typical bands at 1734.06 cm–1 due to C=O stretching of carboxylic group and a band at 1690 cm–1 due to C=O s stretching of amide group ,C-H stretching at a 2970 cm -1 and C-C stretching at cm–1 .No significant shifts of reduction in intensity of the FTIR bands of Captopril were observed as shown in figure 7 a). From the FTIR spectra shown in fig 7 b), it is very clear that there are no interactions between drug and excipients.
0
10
20
30
40
50
60
70
80
90
100
-0.2
0
0.2
0.4
0.6
0.8
1
Figure- 7 b) : FTIR spectra of Captopril + Xanthan gum
Differential Scanning Calorimetry:
Thermal analysis of drug was carried out using DSC. The DSC curve of captopril profile a sharp exothermic peak at 108 0C corresponding to its melting, and indicating its crystalline nature and purity of sample. The DSC thermogram is shown in figure.
Figure 8: DSC Thermogram of Captopril
CONCLUSION
Sustained release matrix tablets of Captopril were prepared using different ratios of xanthan gum and Ethyl cellulose by direct compression method. The results of the present study demonstrates that the xanthan gum and Ethyl Cellulose control the Captopril release effectively for 8 hrs,. It is concluded that sustained release of Captopril over a period of 8 hours was obtained with formulation (F-4) containing high amount of Xanthan gum and Ethyl cellulose. Sustained release matrix tablets of Captopril can be expected to reduce the frequency of administration and decrease the dose dependent side effects associated with repeated administration of conventional Captopril tablets.
ACKNOWLEDGEMENT
The authors are thankful to the principal and management of Loknete Dr. J. D. Pawar College of Pharmacy Manur, for providing necessary facilities to carry out this work.
CONFLICT OF INTERESTS
Declared None. 500 750 1000 1250 1500 1750 2000 2500 3000 3500 4000 4500 1/cm 30 37.5 45 52.5 60 67.5 %T 4 4 2 6 .7 8 4 2 7 4 .4 0 4 1 2 7 .8 0 3 7 7 8 .6 8 3 5 3 1 .7 8 3 1 7 8 .7 9 2 9 4 3 .4 7 2 7 9 8 .8 0 2 5 8 2 .7
7 23
2 2 .3 7 2 1 9 6 .9 9 2 0 2 7 .2 5 1 5 9 9 .0 4 1 3 3 4 .7 8 1 2 3 6 .4 1 1 0 4 7 .3 8 8 6 2 .2 1 8 1 5 .9 2 6 4 8 .1 0 4 7 2 .5 8
REFERENCES
1. Agarwal G, Agarwal S, Oral sustained release tablets an
overview with a special emphasis on matrix tablet, American journal of advanced drug delivery ,2017;
60-64
2. Darandale A, Aher A,Sustained release dosage form a concise
review, International journal of pharmaceutics and drug analysis,2017;153-160
3. Alhalmi A, Marwan A, Sustained release matrix system an
overview,World journal of pharmacy and pharmaceutical sciences ,2018; 1470-1486.
4.
5. Singh A, Sharma R, Sustained release drug delivery system
review , International research journal of pharmacy ,2012;21-24
6. Karvekar M, Khan A, Abrief review on sustained release
matrix type drug delivery system, Journal of pharmaceutical research 2017;282-283
7. Tapaswi RD, Verma P. Matrix tablets: An approach towards
oral extended releasedrug delivery. Int J Pharma Res Rev. 2013; 2(2):1224.
8. Debjit Bhowmik, Chiranjib B., Recent Trends in Sustained
Release Matrix Drug Delivery System: A review, Page No. 1-21.
9. Ratnaparkhi M. P., Gupta Jyoti P., Sustained Release Oral Drug
Delivery System, An Overview, International Journal of Pharmacy Research and Review, March 2013, Volume-2, Issued-3, Page No. 11-21.
10. Ojha Kumar Abhishek, A Review- Sustained Release Drug
Delivery Technology, World Journal of Pharmacy and Pharmaceutical Sciences.
11. Zalte HD, Saudagar RB. Review on Sustained Release Matrix
Tablet. Int J Pharm & Bio Sci. 2013;3(4):17-29.
12. Ghanshyam Yadav, Mayank Bansal, Pragati Khare Formulation
And Evaluation Of Sustained Release Matrix Tablets Of Captopril Asian Journal Of Pharmaceutical Science & Technology Vol 4( 1)2014 Page No.39-44
13. Dinesh Kumar, Formulation And Evaluation Of Valsartan
Sustained Release Matrix Tablets, Bulletin Of Pharmaceutical Research 2014;4(8), 81-85
14. Ganesh G.K. Preparation And Evaluation Of Sustained Release
Matrix Tablet Of Valsartan Using Natural Polymers, Indo
American Journal Of Pharmaceutical Research
2013;3(1),1310-1315
15. Dhruba Sankar Goswami, Kapil Dev Sharma, Formulation And
Evaluation Of Delayed Sustained Release Tablets Of Anti –
Hypertensive Drug, International Journal Of
Biopharmaceutics 2014;5(1); Page No.29-38
16. Sarika Pundir, Sustained Release Matrix Technology And
Recent Advance In Matrix Drug Delivery System A Review,
International Journal Drug Research And
Technology.2013;3(1):12-20
17. Indian Pharmacopoeia 1996, Government Of India Ministry of
Health and Family Welfare, Published by The Indian Pharmacopoeal Commission, Ghaziabad, Vol II, Page No. 796.
18. Indian Pharmacopoeia 2014, Government Of India Ministry of
Health And Family Welfare, Published by The Indian Pharmacopoeal Commission, Ghaziabad, Vol.III, Page No. 2964,1469,2143,2151.
19. British Pharmacopoeia, Published By British Pharmacopoeia
Commission; Vol-II; 2243.
20. The Merck Index, An Encyclopedia of Chemicals, Drugs and
Biological 14th Edition, Published by Merck Research
Laboratory Copyright 2006 by Merck and Co. Inc. Whitehouse Station, Nj Usa, Page No:1710
21. Handbook Of Pharmaceutical Excipients, Fourth Edition, Page