© 2015 IJSRSET | Volume 1 | Issue 6 | Print ISSN : 2395-1990 | Online ISSN : 2394-4099 Themed Section: Engineering and Technology
Synthesisation of 2223 Superconductors
Rohitash Kumar, H. S. Singh
Department of Physics, Faculty of Science, Jai Narain Vyas University, Jodhpur Rajasthan, India
ABSTRACT
To preparation of superconductors with structure type of Bi2Sr2Can-1CunOx (n=1, 2, 3), with formula (Bi2M1+nTMnOx)
where M= Sr, Ba, Ca transition matel. The composition Bi2Sr2Can-1CunOx were prepared by solid state reaction by
Ball Mill from the principle routs like Bi-2223, Ca2CO3 and CuO with high purity of 99.99%. Different
measurement such as resistivity measurement, X-Ray Diffraction and FTIR were made to changes in
superconductivity. Some transition matel (M) other than Cu, reported belongs to group which contain transition metal such as iron, cobalt, manganese etc. The lattice constant obtained with Fe doped in different amounts. The Tc
of the high temperature superconducting cuprate Bi2Sr4-xCaxFe3-yCuyOz were obtained 157K, the resistance
decreases nearly zero with decreases temperature.
Keywords: Bi2Sr4-xCaxFe3-yCuyOz, ball mill, Fe doping, Electrical Resistivity, XRD, FTIR, MOssbauer
spectroscopy.
I.
INTRODUCTION
The discovery of the Bi-Sr-Ca-Cu-O superconducting compounds Maeda et al, 1988 [1], a great deal of work has been done to prepare the high critical temperature (Tc) phases.A true superconductor not only shows zero
resistance but also excludes a magnetic field completely (the Meissner effect. Muller and Takugi reported the possible existence of percolative superconductivity in (La1-xBax)2CuO4-y with x= 0.2 to 0.5 in the 30k range
and it was concerned by Uchida and Takugi et al [2],[3]. Synthesis and characterization of iron oxidesa with 2223 Bi superconductor in Bi2Sr4-xCaxFe3-yCuyOz with (x=0.0,
1.0…) concerned by H.S.singh and Rohitash kumar in 2013[4]. Superconductivity has been observed in the temperature and 120-130k in Ba-Ca-Sr-Cu-O H.W. Zandbergen et al[5]. The studies of transport properties, such as electrical resistivity, thermoelectric power (S) and thermal conductivity, are important for exploring the conduction mechanisms. The Bi based superconductors offer potential advantages in comparison to the Y-based superconductors. Superconductivity is the phenomenon in which the resistivity of materials falls abruptly to zero around some temperature above the absolute zero called transition temperature (Tc) H.Kamerlingh Onnes et al [6].
The most common method used to synthesize these
superconducting oxides is the solid state reaction method Koyoma et al, 1988 [7], which consist of the mixing nominal composition of high purity compounds such as Bi2O3, SrCO3, CaCO3 and CuO. The Bi-2223
phase has attracted considerable interest due to its higher Tc and the potential for applications. we can use different methods of characterization of the material as XRD, FTIR, Mossbauer effect and particle analysis etc. Our main aim of this work is to understand the variation in the property like resistivity with the substitution of various cations like Cu, Fe, Sr and Ca with different stoichiometry systematically [8].
II.
METHODS AND MATERIAL
2.1 Materials
The samples were prepared by the solid state reaction method using highly pure 99.99% powders of Bi2O3,
SrCO3, Fe2O3 and CaCO3, CuO, with appropriate
weights in proportion to their molecular weights through the following chemical reactions type with formula Bi2Sr4-xCaxFe3-yCuyOz [9].
2.2 The Chemical Reactions
amount of substance through the following chemical reactions.
Bi2O3+2SrCo3+2 CaCo3+0.5 Fe2O3+2CuO =
Bi2Sr2Ca2FeCu2O2+4Co2
2.3 Sample Preparation
All the samples were measuring the weight of each reactants with the required amount, using digital electrical sensitive balance machine with (4-digits), type Adair Dutt AD-180. The mixture for each specimen was prepared by homogeneously mixing and grinding of powders into a Ball Mill type Retsch PM-100. The Bi– 2223 samples were prepared from four type substance and Fe mixed different atomic weight and grinding this amount of substance in Ball mill 400rpm in 25ml grinding jars with 8 grading balls of 10mm. Total grinding time is 6hour initially. In the grinding process we get the particle size and phase changed in different position and the temperature of the sample in the jars nearly 8500C-9000C in 6 hour. The samples were prepared at room temperature 250C. The calcinations process was not performed. The resulting powder was pressed into pellets by using cylindrical die set with a stainless steel cylinder of 13 mm diameter and 1.5 to 1.8 mm thickness using manually hydraulic press by technosearch KBr PRESS Model-15. All the prepared samples are shown in table-2.1.
Table-2.1
Figure 2.1: Operating Ball Mills Type PM100
Figure 2.2
III.
RESULTS AND DISCUSSION
3. SAMPLE TESTING
3.1 X-Ray Diffraction
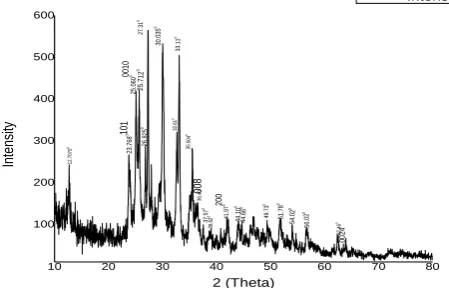
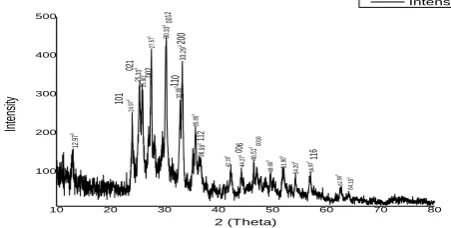
According to table-2.1, the first five samples XRD study has been investigated by Rohitash kumar and H.S. Singh [10]. In this paper we are doing study for (x=1…..,y=0….) next five samples (6-10) are show in table-3.1. The prepared samples were characterized by X-Ray diffraction machine type PANalytical Xpert-PRO in MNIT jaipur. A automatic computational setup has been used to investigated the lattice parameter and planes of unit cell. The XRD pattern were find by CuKα (1.5406 Å) radiation with fitting limit 100 to 900. All the collected data is shown in table-3.1 and get nearly results of Bi-2223 superconductors and XRD pattern show in Fig-3.6, 3.7, 3.8, 3.9, 3.10.
10 20 30 40 50 60 70 80 100
200 300 400 500 600
In
te
ns
ity
2 (Theta)
Intensity
12
.7
07
0
0
23
.7
68
0
25
.0
60
0
25
.712
0
26
.825
0
27
.3
1
0
30
.0
35
0
32
.6
1
0
33
.1
1
0
35
.5
04
0
36
.4
0
37
.5
7
0
38.8
2
0 41.9
7
0
44
.1
0
0
44.6
6
0
49
.7
3
0
51
.7
8
0
54
.02
0
56
.0
2
0
62
.4
6
0
101
0010
008
200
0024
Figure 3.6 - Indexed X-ray pattern of Bi2Sr3CaFe3CuO
10 20 30 40 50 60 70 80 100 200 300 400 500 600 700 In te ns ity 2 (Theta) Intensity 12 .8 2
0 23.94
0 25 .1 7 0 25 .7 8 0 27 .4 1 0 30 .1 1 0 32 .7 8 0 33 .1 8 0 35.62 0 36.4 8 0 42 .0 8 0 44 .4 8 0 46 .9 9 0 49 .5 4
0 51.8
0 0 54 .1 1 0 56 .84 0 62 .4 7 0 64.0 7 0 200 110 119
008 0018 0012
214
Figure 3.7 Indexed X-ray pattern of Bi2Sr3CaFe2.8Cu.2Oz
Superconductor
10 20 30 40 50 60 70 80 100 200 300 400 500 600 700 In te ns ity 2 (THeta) Intensity 12 .7 6 0 23 .8 2 0 25 .1 4 0 25 .7 7 0 26 .8 9 0 27 .3 7 0 28 .0 0 0 29 .4 0 0 30 .1 5 0 32 .6 8 0 33 .1 9 0 35 .0 6 0 35 .6 3 0 37 .5 8 0 40 .8 6
0 42.0
9 0 44 .0 9 0 48.5 4
0 51.7
4
0
54.07
0 56 .7 9 0 62 .4 8 0 0010 103 012 0012 112 0014 204
Figure 3.8 Indexed X-ray pattern of Bi2Sr3CaFe2.6Cu.4Oz
Superconductor
10 20 30 40 50 60 70 80
100 200 300 400 500 In te ns ity 2 (Theta) Intensity 12 .9 7 0 24 .9 7 0 25 .3 3 0 25 .9 0 0 27 .5 7
0 30.3
3 0 32 .8 5 0 33 .2 9 0 35 .8 5 0 36.5 9 0 42 .2 8 0 44 .2 7 0 46 .5 1 0 49 .6 0 0 51 .9 0 0 54 .2 0 0 56 .9 2 0 62 .5 0 0 64 .1 5 0 101 021 002 0012 110 200 112 006 0018 116
Figure 3.9 Indexed X-ray pattern of Bi2Sr3CaFe2.4Cu.6Oz
Superconductor
20 30 40 50 60 70 80
100 200 300 400 500 600 700 In te ns ity 2 (theta) Intensity 23.93 0 25 .2 2 0 25 .8 1 0 26.9 7 0 27 .4 8 0 28 .0 8 0 30 .1 9 0 32 .7 7 0 33 .2 9 0 35 .7 1 0 36.5 9 0 38 .9 9
0 42.1
2 0 44 .2 4 0 46 .4 3 0 47 .0 3 0 48 .6 9 0 49 .5 9
0 51.9
0 0 56.8 2 0 62 .5 6 0 64 .0 5 0 72 .3 1 0 101 021 002 111 012 0012 0014 202 006
Figure 3.10 Indexed X-ray pattern of Bi2Sr3CaFe2.2Cu.8Oz
Superconductor
Table-3.1
S .N O.
Compound Bi-2212 & Bi-2223
Grindi ng time
System Cell Parameter 2θ0
d(A) (h, k, l)
A0
6 Bi2Sr3CaFe3CuOz
23.76 25.06 36.40 41.97 63.96 3.743 3.552 2.467 2.152 1.455 (101) (0010) (008) (2 0 0) (0024) 6h Tetragonal Lattice- (body centred) a=3.810 c=30.60
7 Bi2Sr3CaFe2.8Cu.2Oz
25.78 32..7 8 35.62 36.48 46.99 56.84 62.47 3.455 2.731 2.520 2.463 1.933 1.619 1.468 (200) (110) (119) (008) (0018) (0012) (214) 6h Orthorhom bic a=6.008 b=8.376 c=5.863
8 Bi2Sr3CaFe2.6Cu.4Oz
25.77 26.82 28.00 30.15 33.19 35.63 48.54 3.456 3.314 3.186 2.963 2.699 2.519 1.875 (0010) (103) (012) (0012) (112) (0014) (204) 6h Orthorhom bic (Base centred) a=5.426 b=5.402 c=30.64
Bi2Sr3CaFe2.4Cu.6Oz
24.97 25.33 25.90 30.33 3.706 3.515 3.439 2.946 (101) (021) (002) (0012) 6h
Orthorhom bic
9 32.85 33.29 36.59 44.27 46.51 56.92
2.725 2.690 2.455 2.045 1.952 1.617
(110) (200) (112) (006) (0018) (116)
10 Bi2Sr3CaFe2.2Cu.8Oz
23.93 25.22 25.81 26.97 28.08 30.19 35.71 49.56 56.82
3.718 3.530 3.451 3.304 3.177 2.960 2.513 1.87 1.620
(101) (021) (002) (111) (012) (0012) (0014) (202) (006)
6h
Orthorhom bic
a=6.010 b=8.380 c=5.870
4.
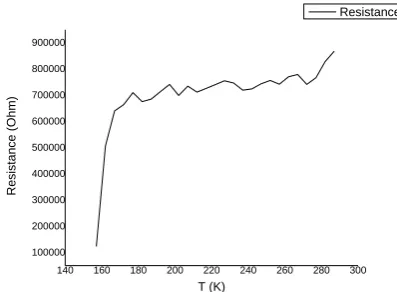
RESISTIVITY MEASUREMENTSAll the measurement were carried out between 298K to157K. All the experimental work wsa carried out at IIT Roorki Uttrakhand. The Tc of the superconducting sample has been measured by using the resistivity measurement carried out by four-probe technique, which is considered as a good method for studying the electrical behavior of superconducting materials and a good tool for determining the Tc [11]. In this method, a small current is passed through a sample and the voltage drop across it. The terminals distinct from those used for passing the main part of the current through the specimen and the electrical contacts of the sample were made of fine copper wires and adhered with silver paste. The system was used for the measurement of critical resistance of the sample, with the presence of liquid nitrogen. The experimental results obtained for the different compounds are show in figure below 4.1 to 4.10. It can be seen from the variation of the resistance the sample exhibit superconducting behavior [12].
140 160 180 200 220 240 260 280 300 300000
400000 500000 600000 700000 800000 900000
Resistan
ce (
Ohm
)
T (K)
Resistance
Figure 4.1 The resistance versus temperature for HTSC
Bi2Sr4CaFe2.8Cu.2Oz Tc, 157K
140 160 180 200 220 240 260 280 300 -100000
0 100000 200000 300000 400000 500000 600000 700000 800000 900000 1000000
Resistan
ce (
Ohm
)
T (K)
Resistance
Figure 4.2 The resistance versus temperature for HTSC
Bi2Sr4CaFe2.6Cu.4Oz Tc, 157K
140 160 180 200 220 240 260 280 300 100000
200000 300000 400000 500000 600000 700000 800000 900000
Resistan
ce (
Ohm
)
T (K)
Resistance
Figure 4.3 The resistance versus temperature for HTSC
140 160 180 200 220 240 260 280 300 100000
200000 300000 400000 500000 600000 700000 800000 900000
Resistan
ce (
Ohm
)
T (K)
Resistance
Figure 4.4 The resistance versus temperature for HTSC
Bi2Sr4CaFe2.2Cu.8Oz Tc, 157K
140 160 180 200 220 240 260 280 300 200000
300000 400000 500000 600000 700000 800000 900000
Resistan
ce (
Ohm
)
T (K)
Resistance
Figure 4.5 The resistance versus temperature for HTSC
Bi2Sr4CaFe2CuOz Tc, 157K
140 160 180 200 220 240 260 280 300 200000
300000 400000 500000 600000 700000 800000
Resistan
ce (
Ohm
)
T (K)
Resistance
Figure 4.6 The resistance versus temperature for HTSC
Bi2Sr3CaFe3CuO Tc, 157K
140 160 180 200 220 240 260 280 300 200000
300000 400000 500000 600000 700000 800000 900000
Resistan
ce (
Ohm
)
T (K)
Resistance
Figure 4.7The resistance versus temperature for HTSC
Bi2Sr3CaFe2.8Cu.2OzTc, 157K
140 160 180 200 220 240 260 280 300 300000
400000 500000 600000 700000 800000 900000 1000000
Resistan
ce (
Ohm
)
T (K)
Resistance
Figure 4.8 The resistance versus temperature for HTSC
Bi2Sr3CaFe2.6Cu.4OzTc, 157K
140 160 180 200 220 240 260 280 300 300000
400000 500000 600000 700000 800000 900000 1000000
Resistan
ce (
Ohm
)
T (K)
Resistance
Figure 4.9 The resistance versus temperature for HTSC
Figure 4.10 The resistance versus temperature for HTSC
Bi2Sr3CaFe2.2Cu.8Oz Tc, 157K
5. FTIR ANALYSIS
The FTIR study is obtain by SHIMADZU IRAFFinity-1S Spectrophotometer. One of the great advantages of infrared spectroscopy is that virtually any sample in virtually any state may be studied. Liquids, solutions, pastes, powders, films, fibres, gases and surfaces can all be examined with a judicious choice of sampling technique[13]. FTIR spectra were carried out in the range 4000-500 cm–1, with a resolution of 4cm–1 and a
mirror speed of 2 cm-1/sec. The range of
spectrophotometer is 7800 to 350cm–1. The interactions of infrared radiation with matter may be understood in terms of changes in molecular dipoles associated with vibrations and rotations [14]. In order to begin with a basic model, a molecule can be looked upon as a system of masses joined by bonds with spring-like properties. Taking first the simple case of diatomic molecules, such molecules have three degrees of translational freedom and two degrees of rotational freedom. The atoms in the molecules can also move relative to one other, that is, bond lengths can vary or one atom can move out of its present plane. This is a description of stretching and bending movements that are collectively referred to as vibrations.
4000 3500 3000 2500 2000 1500 1000 500 10
20 30 40 50 60 70 80 90 100 110 120 130 140 150 160 170 180 190 200
T
(%)
Wavenumber (cm-1
)
T
1469 860
1384 457
1593
Figure 5.6
Table –5.1 sample6. FTIR spectrum of Bi-2223 superconductor
Number of effective peaks
Wave number
cm-1
%T
1 1593 95.15
2 1469 77.49
3 1384 98.70
4 860 94.96
After examination of the data presenting in table-5.1, results that in the range 1593-860 cm-1. The most important in the present study for evidence of bonding formation positioned at 1593 cm-1 , 1469cm-1,1384cm-1 and 860cm-1469cm-1,1384cm-1 respectively can be assigned in a tetragonal lattice. These positions are very important for cell parameter. So cell parameter is not symmetrical.
4000 3500 3000 2500 2000 1500 1000 500 10
20 30 40 50 60 70 80 90 100 110 120 130 140 150 160 170 180 190 200
T
(
%)
wavenumber (cm-1
)
1558 1469
Figure 7
Table –5.2 sample-7. FTIR spectrum of Bi-2212 superconductor
Number of effective peaks
Wave number cm-1
%T
1 1558 97.51
2 1469 107.12
for the evidence of bonding formation in superconductor at positioned 1558cm-1, 1469cm-1 respectively. These positions are effective to the cell parameters of orthorhombic base centered. This represented to a vibration in superconductor but position 1469 is ineffective for vibration so this is the orthorhombic system and its cell parameter is quietly different.
4000 3500 3000 2500 2000 1500 1000 500 10
20 30 40 50 60 70 80 90 100 110 120 130 140 150 160 170 180 190 200
T
(
%)
Wavenumber (cm-1
)
858 401 478
1469 1600 1770 2486
Figure 8 :
Table 5. 3 - sample-8. FTIR spectrum of Bi-2212 superconductor
Number of effective peaks
Wave number cm-1
%T
1 401 85.13
2 478 91.25
3 858 84.07
4 1469 74.12
5 1600 97.74
In the tablel-5.3, the results that in the range 401-1600 cm-1. The most important in the present study for evidence of bond formation positioned at 401 cm
-1
,487cm-1, 858cm-1, 1469cm-1, 1600cm-1 respectably can be represented to a vibration in superconductor.
4000 3500 3000 2500 2000 1500 1000 500 10
20 30 40 50 60 70 80 90 100 110 120 130 140 150 160 170 180 190 200
T
(
%)
Wavenumber (cm-1
)
457 524 669 1107 1350 1382 1467
1562 1593 2337 2360 3292
Figure 9
Table –5.4 sample-9. FTIR spectrum of Bi-2212 superconductor
Number of effective peaks
Wave number cm-1
%T
1 457 94.46
2 524 100.0
3 669 93.02
4 1107 99.48
5 1350 92.13
6 1382 85.86
7 1467 94.07
8 1562 93.13
9 1593 85.25
10 2337 91.21
11 2360 83.25
After observation of the data presented in tablel-5.4, results that in the range 457-2360cm-1. The most important in the present study for evidence of bond formation positioned at 457 cm-1,524cm-1 , 669cm-1, 1107cm-1, 1350cm-1, 1382cm-1, 1467cm-1, 1562cm-1, 1593cm-1, 2337cm-1 and 2360cm-1 respectably can be represented to a vibration in superconductor.
4000 3500 3000 2500 2000 1500 1000 500 10
20 30 40 50 60 70 80 90 100 110 120 130 140 150 160 170 180 190 200
T
(
%)
Wavenumber (cm-1)
1467 1593
1384
Figure 10
Table –5.5 sample-10. FTIR spectrum of Bi-2212 superconductor
Number of effective peaks
Wave number cm-1
%T
1 1593 96.32
2 1467 92.35
3 1384 103.4
6. MÖSSBAUE SPECTROSCOPY
In 1961 the work of Rudolph L. Mössbauer (see Brown 1963), on resonant absorption of nuclear gamma rays in solids was recognized with the Nobel Prize. In this experiment, at the energy levels in an atomic system of the order of tens of micro-electron-volts using nuclear gamma rays from that system in the energy range of 14 kilo-electronvolts[15]. MÖssbauer spectroscopy is the most useful tool to study the behavior of crystals when iron used as a metal dopant at Cu sites. In the method used here, a spectrum is obtained of the number of counts per second, as a function of the velocity of the source, of 14.4 keV gamma rays that have passed through the absorber into a detector. The detector is a proportional counter which is efficient to the detection of this energy of gamma ray and is inefficient to the detection of higher energy gamma rays. This produces a series of folded count versus time spectra from which counts versus velocity can be deduced [16]. MÖssbauer spectra were recorded of the samples with MÖssbauer spectrometer using γ-ray source, but these samples do not show any MÖssbauer spectrum at room temperature. So there is no internal magnetic field in the superconductor.
IV.
CONCLUSION
According to the table-2.1, last six composition of samples are analyzing at room temperature. The XRD pattern after final grinding 6h is show in fig3.6 to 3.10. All the peaks are indexed in table3.1. XRD pattern
showed peaks belonging to the high-Tc (2223) phase as
a major component along with peaks due to the low-Tc
(2212) phase. The dominant is the high-Tc (2223) phase having orthorhombic structurewith lattice constants: a = 5.11 Å, b = 5.420 Å and c = 37.2 Å. But other two samples(1, 2) cell parameter is not identical because bonding vibration is more as shown by FTIR figures and interaction is very weak so superconductor nature is not destroyed. The resistance decreases with temperature decreases according to the graphs resistance versus temperature Fig-4.1 to 4.10, this show that the resistivity is decreases with the temperature and conductivity will increases with decreases temperature. So the sample
behaves likes 2223 superconductors at 157K
temperature. The Mossbauer spectroscopy is not useful
at room temperature. Crystal structure of
superconductors and their compounds involves large
unit cells in which points defects, oxygen vacancies, impurity atoms twin planes and inter granular impurity phases are pervasive It is made a comparative analysis of the observed XRD, Resistivity, FTIR, and Mossbauer
spectroscopy[16-23]. These superconductors were
prepared by ball mill and reported samples were prepared by annealing method. This study revels both study gives same results and a complex formation.
V.
REFERENCES
[1] Maeda H, Tanaka Y, Fukutomi M, Asano T (1988). A
new high-Tc oxide superconductor without a rare earth
element, Jpn. J. Appl. Phys. 27:L209-L210.
[2] S.Uchida et al. Jpn. J.Appl. Phy . 26L1 (1987).
[3] H. Takagi, S. Uchida et al. Jpn. J.Appl. Phy . 26L123
(1987).
[4] H.S. singh and Rohitash kumar, international
conference on ceramic, Bikaner, india IJMPCS world scientific publication, Vol. 22 (2013) 35-36.
[5] H.W. Zandbergen et al. Nature 332 620 (1988).
[6] H. Kamerlingh Onnes, research notebooks 56,
Kamerlingh oness Archive, Berhaave Museum, Leiden, the Netherlands.
[7] Koyoma S, Endo U, Kawai T (1988). “Formation of
high Tc phase of Bi-Pb-Sr-Ca-Cu-O superconductors”,
Proceeding of the 1st international symposium on
superconductivity, Tokyo Berlin, 88: 833-836.
[8] H.S. singh & Rohitash kumar, international conference
on ceramic, Bikaner, india IJMPCS world scientific publication, Vol. 22 (2013) 35-36.
[9] Widad M. Faisal and Salwan K. J. Al-Ani, “Enhanced
superconducting properties of the Pb doped trilayer
high-temperature (Bi2Sr2Can-1CunO2n+4δ) cuprate
superconductor” International Journal of the Physical Sciences Vol. 7(2), pp. 171 - 181, 9 January, 2012.
[10] Rohitash Kumae and H.S.Singh, “Spectroscopic Study
on Iron Oxide Based Bi-2223 Superconductors” INTERNATIONAL JOURNAL OF SCIENTIFIC PROGRESS AND RESEARCH (IJSPR), Volume-15, Number - 01, 2015.
[11] K. Iida, S. Haindl, T. Thersle, J. Ha¨nisch, F. Kurth, M.
Kidszun, R. Hu¨hne, I. Mo¨nch, L. Schultz, B. Holzapfel, and R. Heller: Appl. Phys. Lett. 97 (2010) 172507.
[12] T. Katase, H. Hiramatsu, V. Matias, C. Sheehan, Y.
Ishimaru, T. Kamiya, K. Tanabe, and H. Hosono: Appl. Phys. Lett. 98 (2011) 242510.
[13] K. H. Tan, “Principles of soil chemistry,” Mariel
Dekker Inc., New York, USA, 1998.
[14] G. Parthasarathy, “Effect of High-Pressures on the
Deccann Trap, Mahrashtra, India,” Journal of Applied
Geophysics Vol. 58, No. 4, pp. 321-329.
[15] H. Frauenfelder, The Mössbauer Effect, W.A.
Benjamin, New York, 1962. (QC 490 F7).
[16] R.L. Mössbauer, Z. Physik 151, 124 (1958). Later
review paper: R.L. Mössbauer, Recoilless nuclear
resonance absorption, Ann. Rev. Nuclear Sci. 12, 123
(1962).
[17] R.M. Hazen, L. W. Finger, R. J. Angel, C. T. Prewitt,
N.L. Ross, H. K. Mao, C. G. Hadiddiacos, P.H. Hor, R.L. Meng, C.W. Chu, Phys Rev. 835 7137 (1987).
[18] T. Siegrist, S. Sunshine, D.w. Murphy, R.J. Cava, S.M.
Zahurak, Phys. Rew. 835 7137 (1987).
[19] J.D. Jorgensen, H.B. Schutter, D.G. Hinks, D.W.
Capone ii, K. Zhang, M.B. Brodsky, D.J. Scalapino, Phys. Rew. Lett. 58 1024 (1987).
[20] Hoydoo You, R.K. Mcmillan, J.D. Axe, D.E. Cox J.Z.
Liu, G.W. Crabtree and G.J. Lam < Sol. St Com. 64 739 (1987).
[21] P. Boolchand and D. McDaniel, Studies of High
Temperature superconductors Ed. A.V. Narlikar Vol. 4, Nova, New York.
[22] H.S. Singh, Rohitash Kumar, MÖssbauer Spectroscopic
Study of the Mahadevpur Meteorite Arunachal Pradesh and Assam, J. Pure Appl. & Ind. Phys. Vol.3 (2), 138-141 (2013).
[23] H.S. Singh, Rohitash kumar, “MÖSSBAUER
SPECTROSCOTIC STUDY OF CHEMICAL STATE
OF IRON IN NATURAL SAMPLES
HORNBLENDES FROM UDAIPUR DISTRIC