A STUDY ON COMPETENCY MAPPING OF EMPLOYEES WITH REFERENCE
TO MURUGAPPAN AND COMPANY
A.Tejeswari*, Dr.T.V.Ambuli
*Asst.Professor, MBA, Jerusalem College of Engineering Chennai
Head of the Department, Department of Master of Business Administration
Keywords: Competency mapping, career development, emotional strength, occasional skill tests
Abstract
Human resource management is a process of bringing people and organizations together so that the goals of each other are met. Over the years, there is a change in the nature of jobs, which calls for future skill mapping through proper HRM initiatives. Indian organizations are also witnessing such a change which brings about the need for a multi skill development There arises the need of competency mapping. Competency mapping identifies an individual’s strengths and weaknesses in order to help them better understand themselves and to show them where career employees with reference to Murugappan and company. Research design adopted for the study is descriptive study with a sample size of 102. Tools used in the present study are percentage analysis, chi-square, coorelation and regression analysis.From the study it is found that there is no association between work experience and high emotional strength. •So Use of occasional skill tests within the department could help the employees to keep a track of where exactly they stand and thus would help them put more development efforts need to be directed. The present study is about competency mapping of authentic ratings when asked to.
Introduction
Competency Mapping is a process to identify key competencies for an organization and/or a job and incorporating those competencies throughout the various processes (i.e. job evaluation, training, recruitment) of the organization. A competency is defined as a behavior (i.e. communication, leadership) rather than a skill or ability.
In the modern complex world, which is characterized by scarcity of resources, it has become first and foremost object of every businessperson to use the available resources efficiently and in best way. The different resources include Men (manpower viz... labours and employees), Material (raw materials and fuel), Machinery (Plant, machinery and tools) and Money (Capital). To maximize returns and minimize wastage all these resources must be properly synchronized. Man power, both technical and managerial, is the most important resource of organization. No other factor can be utilized efficiently without manpower.
Thus, its mismatch with any of the factor will give rise to wastage of time, money and efforts, leading to loss of efficiency. Thus, it is very necessary to use this resource effectively. However, the most important resource is also the most difficult to manage. The reason for this difficulty is that no two persons are similar. Each person is been endowed with different qualities, skills, attitudes, motives, knowledge etc.
improved assessment of candidate but still the reliability of the test result is not adequate to forecast effectiveness of the candidate for the job. It was found by the research conducted by Industrial and Organizational Psychologists that ‘effectiveness of a person to carry out a job depends not only on a single or isolated factor but on “set of many different factors”. Such set of factors that help the possessor to be proficient in a particular job is termed as Competency for the particular job.
Review of literature
Competency-Competency is a skill, a personal characteristic or a motive demonstrated by various behaviors which contribute to outstanding performance in a job. Competency is a set of knowledge, skills and attitudes required to perform a job effectively and efficiently, which results in outstanding performance at work
MILLER, et. al. (2010) suggests, “there are two senses in which competence can be defined. The first is competence equating to performance, which is the ability to perform nursing tasks, and the second is competence as a ‘psychological construct.’
YUVARAJ (2011) has explained the Job Competencies required to work in a manufacturing industry, professionals for knowledge, ability and attitude. Gap analysis was also made to a limited extend.
MD.ISHTIAK UDDIN, et. al. (2012) is of the view that Competency mapping can also be used for coaching and succession planning, considering the significance of Competency Mapping for individual and organizational growth, the present study was undertaken. Efforts have been made to elaborate the various competencies with minute parameters and to correlate them with the managerial competence level.
Competencies in an organization
In order to carry out an organization's business in a superior manner, it needs to identify the competencies it's managers and all other employees should possess, further improve and practice to improve their job performance towards achieving it's goals.
Competency is not a task statement
Competency is a combination of an underlying capability, a characteristic or an ability with knowledge and skills that results in an effective performance. If competencies are improved, they will give still more effective or superior performance. Competencies are knowledge and skills statements and not task statements. For example: conducting the meetings is a task. In order to do so, one needs required competency.
Therefore, in this case the required competency is the combination of skills to make an agenda, to promote a healthy group process, to resolve conflicts, to manage time etc.
Inventory of competencies and developing competency matrix
1. An organization should develop an inventory of all the competencies it will need from its people in order to run its business as per its vision, mission, objectives and strategies.
2. These identified competencies then should be classified and grouped together accordingly. The following classifications can be made:
Behavioral or soft competencies. Managerial competencies
Technical competencies/hard competencies
There could be other alternate ways for classifying competencies as given below: Competencies for individual excellence or for managing self.
Competencies for interpersonal relations.
Managerial competencies which can be further classified as: 1. Organizational. 2. Role related and 3. People related Functional or technical competencies. Information related competencies.
3. Each competency, in turn, will have its levels of proficiencies. They should be identified.
4. Clear explanations of each level of each competency should be written down. These levels are given different labels by different organizations as per their needs. Some examples are given below:
In one organization, these proficiency levels for each competency are graded as: oh-oh, so-so, good and great.
In other organization, they are termed as: baseline, collaborative productivity, ownership, managing complexity and expert. In another organization, they simply put them as: level 1, level 2, level 3 and level 4.
5. Also, for each job or each position which competencies of which proficiency level are required should be determined. This is called developing a "competency matrix".
Competency mapping
Having created competency matrix for every job/position, the job incumbent's current Competencies are evaluated against the desired competencies and their level of proficiency. This is mapping the competencies of a job holder against the desired competency matrix for that job.
Objectives of the study
To determine the association between work experience and high emotional strength
To correlate the optimum usage of time with that of individual capability in tracking the progress of activity. To determine the extent of relationship between leadership and follow-up
Need and scope of study Need of the study
To comprehend how Competency Mapping is linked to various HR practices and to find the impact of Competency mapping on Individuals Growth
Scope of the study
A detailed study of Competency mapping has been made by studying various literatures on competency mapping and by referring various articles on the same. The effort is made to bring out effectiveness in various areas like recruitment and selection, training and development, performance management, skill development, training need identification, etc.
Limitation of study
The limitations that were felt during the course of this project are as follows:
• Due to lack of time, only the manager and employee self-ratings could be taken. The project would have been much better in quality if the employee ratings for other employees were also considered like a 360 degree rating. It would have brought a lot more accuracy and authenticity to the ratings.
• It was observed that in many teams the complete seriousness of the exercise was not understood. This was reflected in the type of ratings that were provided.
Research methodology
Research design
Descriptive research.
Sampling technique -Convenient sampling
Sample size - A sample of 102 was chosen among the population of more than 200 employees
Data collection techniques
The primary data - Structured Questionnaire and
The secondary data -books, journals, and company records, etc
Tools used for analysis
Percentage Analysis
Chi Square Analysis
Correlation
Regression
Percentage analysis
1.6.1.1. TABLE SHOWING AGE OF RESPONDENTS
AGE (IN YEARS) NO. OF RESPONDENTS PERCENTAGE OF
RESPONDNETS
20-25 59 59%
25-30 24 24%
30-35 16 16%
35 & Above 3 3%
TOTAL 102 100%
Interference:
TABLE 1.6.1.2. TABLE SHOWING GENDER OF RESPONDENTS
AGE (IN YEARS) NO. OF RESPONDENTS PERCENTAGE OF
RESPONDENTS
Male 59 58%
Female 43 42%
TOTAL 102 100%
Interference
From the above table, it is inferred that 58% of the respondents belong to male, and remaining 42% belong to female.
TABLE 1.6.1.3 TABLE SHOWING QUALIFICATIONS OF RESPONDENTS
QUALIFICATION NO. OF RESPONDENTS PERCENTAGE OF
RESPONDENTS
Diploma 41 40%
UG 48 47%
Others 13 13%
TOTAL 102 100%
Interference
From the above table it is inferred that 41% of the respondents are Diploma holders, 48% are UG graduate and remaining 13% of respondents are others
TABLE 1.6.1.4 TABLE SHOWING WORK EXPERIENCE OF RESPONDENTS
EXPERIENCE (IN YEARS)
NO. OF
RESPONDENTS
PERCENTAGE OF
RESPONDNETS
Less than 1 Year 26 25%
1-5 years 28 27%
6-10years 27 27%
Above 10 years 21 21%
TOTAL 102 100%
Interference From the above table it is inferred that 26% of the respondents have Less than 1 year experience, 28% have 1-5 years, 27% have 6-10 years and 21% have above 10 years of experience in the organization.
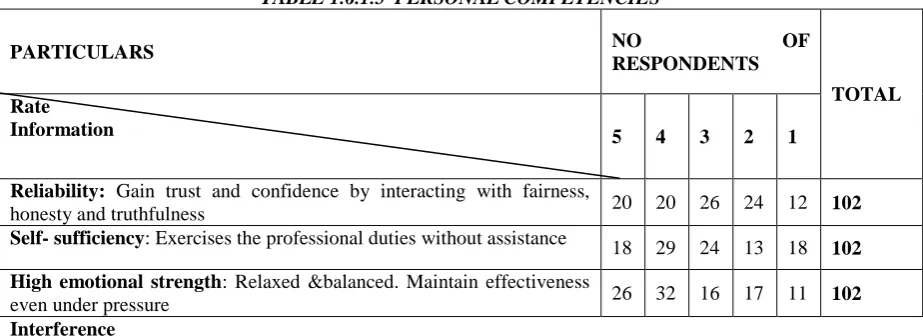
TABLE 1.6.1.5 PERSONAL COMPETENCIES
PARTICULARS NO OF
RESPONDENTS
TOTAL Rate
Information 5 4 3 2 1
Reliability: Gain trust and confidence by interacting with fairness,
honesty and truthfulness 20 20 26 24 12 102
Self- sufficiency: Exercises the professional duties without assistance 18 29 24 13 18
102
High emotional strength: Relaxed &balanced. Maintain effectiveness
even under pressure 26 32 16 17 11 102
Interference
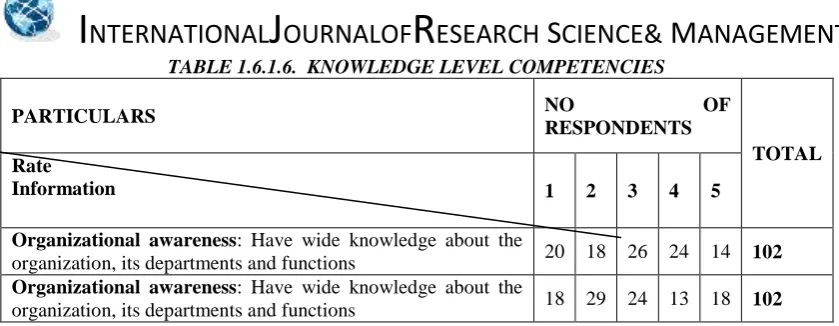
TABLE 1.6.1.6. KNOWLEDGE LEVEL COMPETENCIES
PARTICULARS NO OF
RESPONDENTS
TOTAL Rate
Information 1 2 3 4 5
Organizational awareness: Have wide knowledge about the
organization, its departments and functions 20 18 26 24 14 102
Organizational awareness: Have wide knowledge about the
organization, its departments and functions 18 29 24 13 18 102
Interference
The above data and chart infers that the respondents receive information about knowledge level competencies.
TABLE 1.6.1.7. JOB RELATED SKILLS/COMPETENCIES
PARTICULARS NO OF
RESPONDENTS
TOTAL Rate
Information 1 2 3 4 5
Presentation skill: Able to present ideas, concepts,
plan and procedures clearly to the target group 35 26 14 16 11 102
Negotiation skill: Discuss and share opinions so as to
arrive at a constructive agreement. 29 23 12 25 13 102
Accuracy in communication: Listen to others and
express the idea with clarity and precision 25 18 12 27 20 102
Interference
The above data infers that the respondents belong to job related skills / competencies.
TABLE 1.6.1.8 SKILLS AND ATTRIBUTES
PARTICULARS NO OF
RESPONDENTS
TOTAL Rate
Information 1 2 3 4 5
Thinking strategically: Understanding internal and external factors that
impact learning and performance in organization 23 29 15 21 14 102
Analytical, problem solving and decision-making skill: Weigh the pros and cons in an uncertain and ambiguous situation, calling for a high level of judgment or taking appropriate decision without much delay
68 14 12 0 8 102
Social skills and abilities: Develop, negotiate, resolve
conflict, persuade, use and respond to authority and power so as to get things done
51 24 15 10 2 102
Emotional Flexibility: Deal with emotional stress and strain that arises as consequence of working situations of authority, leadership, power, targets and deadlines
56 18 20 5 3 102
Pro-activity: Respond to the needs of the instant situation, but while making such a response consider the long-term aims and goals and the impact of immediate decision
39 26 19 12 6 102
Interference
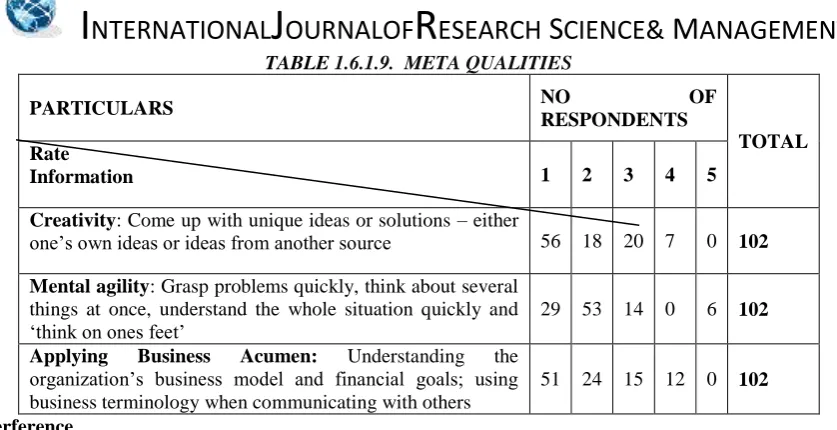
TABLE 1.6.1.9. META QUALITIES
PARTICULARS NO OF
RESPONDENTS
TOTAL Rate
Information 1 2 3 4 5
Creativity: Come up with unique ideas or solutions – either
one’s own ideas or ideas from another source 56 18 20 7 0 102
Mental agility: Grasp problems quickly, think about several things at once, understand the whole situation quickly and ‘think on ones feet’
29 53 14 0 6 102
Applying Business Acumen: Understanding the organization’s business model and financial goals; using business terminology when communicating with others
51 24 15 12 0 102
Interference
The above data infers that the respondents belong to Meta qualities.
TABLE 1.6.1.10. VISION AND PURPOSE
PARTICULARS NO OF
RESPONDENTS
TOTAL Rate
Information 1 2 3 4 5
Sees new possibilities to take the organization to a
higher realm 32 16 26 16 12 102 Optimistic and motivates. Sees everything with a
positive outlook 29 26 23 20 4 102
Interference
The above data infers that the respondents belong to vision and purpose.
TABLE 1.6.1.11. DEVELOPING PEOPLE
PARTICULARS NO OF
RESPONDENTS
TOTAL Rate
Information 1 2 3 4 5
Assembles strong teams with empowerment 28 25 21 15 13 102
Communicates effectively with people 34 17 31 11 9 102 Interference
The above data infers that the respondents belong to Developing people.
TABLE 1.6.1.12. VALUES AND ETHICS
PARTICULARS NO OF
RESPONDENTS
TOTAL Rate
Information 1 2 3 4 5
Aligns with company values 31 28 16 14 13 102
Adheres to code of conduct 19 40 18 13 12 102
Interference
The above data infers that the respondents belong to values and ethics.
TABLE 1.6.1.13. COMMITMENT
PARTICULARS NO OF
RESPONDENTS
TOTAL Rate
Information 1 2 3 4 5
Widely trusted 29 16 19 25 13
102
Takes ownership on the assigned responsibilities 26 25 23 12 16
102
Delivers results 31 29 17 17 8 102
Interference
The above data infers that the respondents belong to commitment.
1.6.2 CHI SQUARE
H0: there is no association between work experience and high emotional strength
H1: there is association between work experience and high emotional strength
TABLE 1.6.2.1 Case Processing Summary
Cases
Valid Missing Total
N Percent N Percent N Percent Work Experience * High
Emotional Strength
102 100.0% 0 0.0% 102 100.0%
Work Experience*High Emotional Strength Cross tabulation Count
High Emotional Strength Strongly
Agree Agree
Neutral Disagree Strongly Disagree
Total
Work Experience <1yr
26 0 0 0 0 26
1-5 yrs 0 28 0 0 0 28
6-10 yrs 0 4 16 7 0 27
>10 yrs 0 0 0 10 11 21
Total 26 32 16 17 11 102
Chi-Square Tests
Value Df
Asymp. Sig. (2-sided)
Pearson Chi-Square 244.472a 12 .000
Likelihood Ratio 234.477 12 .000 Linear-by-Linear
Association
91.302 1 .000
Chi-Square Tests
Value Df
Asymp. Sig. (2-sided)
Pearson Chi-Square 244.472a 12 .000
Likelihood Ratio 234.477 12 .000 Linear-by-Linear
Association
91.302 1 .000
N of Valid Cases 102
a. 12 cells (60.0%) have expected count less than 5. The minimum expected count is 2.26
Directional Measures
Value Nominal by Interval Eta Work Experience
Dependent
.967
High Emotional Strength Dependent
.954
Interference
From the above data it can be inferred that the chi-square value is >0.05 thus null hypotheses is accepted. Hence there is no association between work experience and high emotional strength.
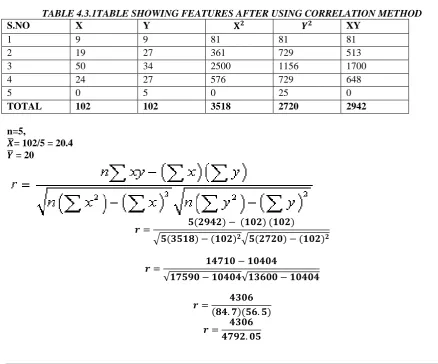
Correlation
Correlation between respondents view on capability of the individual to make the most efficient and optimum use of the time that is allotted to him/her and capability of the individual to keep tracking the progress of any activity and push through the bottle necks that might hinder the process.
TABLE 4.3.1TABLE SHOWING FEATURES AFTER USING CORRELATION METHOD
S.NO X Y 𝐗𝟐 𝒀𝟐 XY
1 9 9 81 81 81
2 19 27 361 729 513
3 50 34 2500 1156 1700
4 24 27 576 729 648
5 0 5 0 25 0
TOTAL 102 102 3518 2720 2942
n=5,
𝑿̅= 102/5 = 20.4
𝒀̅ = 20
𝒓 = 𝟓(𝟐𝟗𝟒𝟐) − (𝟏𝟎𝟐) (𝟏𝟎𝟐)
√𝟓(𝟑𝟓𝟏𝟖) − (𝟏𝟎𝟐)𝟐√𝟓(𝟐𝟕𝟐𝟎) − (𝟏𝟎𝟐)𝟐
𝒓 = 𝟏𝟒𝟕𝟏𝟎 − 𝟏𝟎𝟒𝟎𝟒
√𝟏𝟕𝟓𝟗𝟎 − 𝟏𝟎𝟒𝟎𝟒√𝟏𝟑𝟔𝟎𝟎 − 𝟏𝟎𝟒𝟎𝟒
𝒓 = 𝟒𝟑𝟎𝟔
(𝟖𝟒. 𝟕)(𝟓𝟔. 𝟓)
𝒓 = 𝟒𝟑𝟎𝟔
𝒓 = 𝟎. 𝟖𝟗
Interface
The values, i.e. the capability of the individuals to make optimum use of the time allotted to him/her and the capability of the individual to keep track of the progress of any activity and push through the bottlenecks that hinder the growth of the process are positively correlated.
Regression analysis from the actual means
To find the average probable change in one variable (Leadership: Capability of the individual to lead a certain group of people to achieve a desired result or goal.) with respect to another variable (Follow up:Capability of the individual to keep tracking the progress of any activity and push through the bottle necks that might hinder the process.)
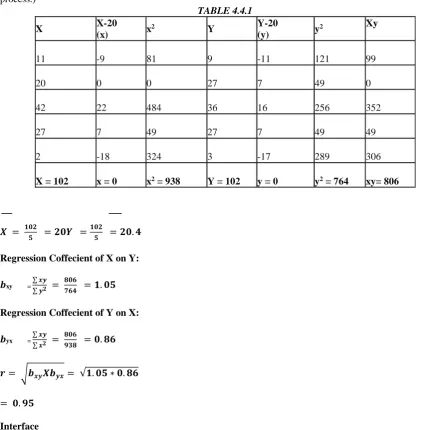
TABLE 4.4.1
X X-20
(x) x
2 Y Y-20
(y) y
2 Xy
11 -9 81 9 -11 121 99
20 0 0 27 7 49 0
42 22 484 36 16 256 352
27 7 49 27 7 49 49
2 -18 324 3 -17 289 306
X = 102 x = 0 x2 = 938 Y = 102 y = 0 y2 = 764 xy= 806
𝑿 = 𝟏𝟎𝟐
𝟓 = 𝟐𝟎𝒀 = 𝟏𝟎𝟐
𝟓 = 𝟐𝟎. 𝟒
Regression Coffecient of X on Y:
𝒃xy = ∑ 𝒙𝒚
∑ 𝒚𝟐 =
𝟖𝟎𝟔
𝟕𝟔𝟒 = 𝟏. 𝟎𝟓
Regression Coffecient of Y on X:
𝒃yx = ∑ 𝒙𝒚
∑ 𝒙𝟐 =
𝟖𝟎𝟔
𝟗𝟑𝟖 = 𝟎. 𝟖𝟔
𝒓 = √𝒃𝒙𝒚𝑿𝒃𝒚𝒙= √𝟏. 𝟎𝟓 ∗ 𝟎. 𝟖𝟔
= 𝟎. 𝟗𝟓
Interface
It can be inferred that the two variables, i.e., leadership and follow-up are closely related.
Findings
59% of the respondents belong to age group of 21-25, 24% of age group 25-30, 16% of age group 30-35, and remaining 3% belong to age group 35 and above.
41% of the respondents are Diploma holders, 48% are UG graduate and remaining 11% of respondents are others.
25% of the respondents have Less than 1 year experience, 27% have 1-5 years, 27% have 6-10 years and 21% have above 10 years of experience in the organization.
The respondents receive information about personal competencies such as reliability, self-sufficiency and high emotional strength.
The respondents receive information about knowledge level competencies that includes organizational awareness
The respondents belong to job related skills / competencies including presentation skill, negotiation skills and accuracy in communication..
The respondents belong to skills and attributes such as strategic thinking, analytical, problem solving and decision-making skills, emotional flexibility,etc.
The respondents belong to meta qualities such as creativity and mental agility.
The respondents belong to vision and purpose to be optimistic and to see new possibilities to take the organization to a higher realm.
The respondents belong to developing people to assemble strong team with empowerment and to communicate effectively with people.
The respondents belong to values and ethics to align with company values, adhere to code of conduct and reward right behavior.
The respondents belong to commitment that includes being widely trusted, takes ownership on the assigned responsibilities and to deliver results.
The chi-square value is >0.05 thus null hypotheses is accepted. Hence there is no association between work experience and high emotional strength.
Recommendation
The following are the recommendations based on the observations and results gathered from the research:
Employees should be clearly explained regarding the objective of conducting the exercise and also the importance of such exercise to their own selves, so that there is a cent percent involvement from the employees’ side. This would also help in speeding up the exercise as the doubts regarding the procedure and the expectations from it could be cleared out in the initial phases itself.
The exercise should be carried out in 360 degrees as it would strengthen the authenticity of the ratings and would give a clearer picture as to the exact skill and competency levels of the employees.
The exercise should be carried out with the involvement of the senior management as it would bring more quality to the ratings collected.
Use of occasional skill tests within the department could help the employees keep a track of where exactly they stand and thus would help them put more authentic ratings when asked to.
The trainings should be planned with the involvement of the employees as well (not only the team leaders) so that there are no low yield trainings being held. This would cut down the costs of training further.
Further, the findings of the exercise could be shared with the employees in a manner deemed fit by the senior management, so that the employees are clear about the areas in which they are lacking, and thus from their own side ca start working on it.
This sharing of the results would also give the employees an idea on who to approach in case of a certain skill, as the experts are identified as a result of this exercise. So this would improve the cross education, helping and cohesiveness among the employees. This would further help in the strengthening of the bonds between the employees, thus strengthening the manpower asset of the organization as a whole.
Conclusion
as skills and competencies are concerned and also an idea as to how to use them for the benefit of the organization. It would improve the quality of the exercise by leaps and bounds. The project was carried out in a good manner and has met the expectations of the organization and the institute satisfactorily, though it still has quite some scope for improvements which could be incorporated subsequently.
References
[1] Lombardo, Michael M.; Eichinger, Robert W.; (2004) FYI: For Your Improvement, a Guide for Development and Coaching, 4th ED.
[2] Tripp, Dr. Steven D.; (1992) Performance + Instruction: A skills matrix and its implications (article),
Wiley Periodicals.
[3] Sahu, R.K., (2009) Competency Mapping, New Delhi, Excel Books. [4] Sahu, R.K., (2005) Training for development, New Delhi, Excel Books.
[5] Sanghi, Seema (2007) The Handbook Of Competency Mapping: Understanding, Designing And Implementing Competency Models In Organizations, California,Sage Publications.
[6] Sharma, Radha R.,(2002) 360 Degree Feedback, Competency Mapping and Assessment Centres, Tata McGraw Hill.
[7] Dr.V.K.Jain.,(2013) International Journal of Emerging Research in Management & Technology : Competency Mapping in Indian Industries- A Case Study
[8] N.Anisha ., (2012) International Journal of Advancements in Research & Technology : Competency mapping of the employees
[9] Heyward M ., (2002 Journal of Research in International Education [10]Rankin ., IOSR Journal of Business and Management
[11]Verma (2008) International Journal of English and Education [12]Miller .,(2010) Journal of Digital Literacy